
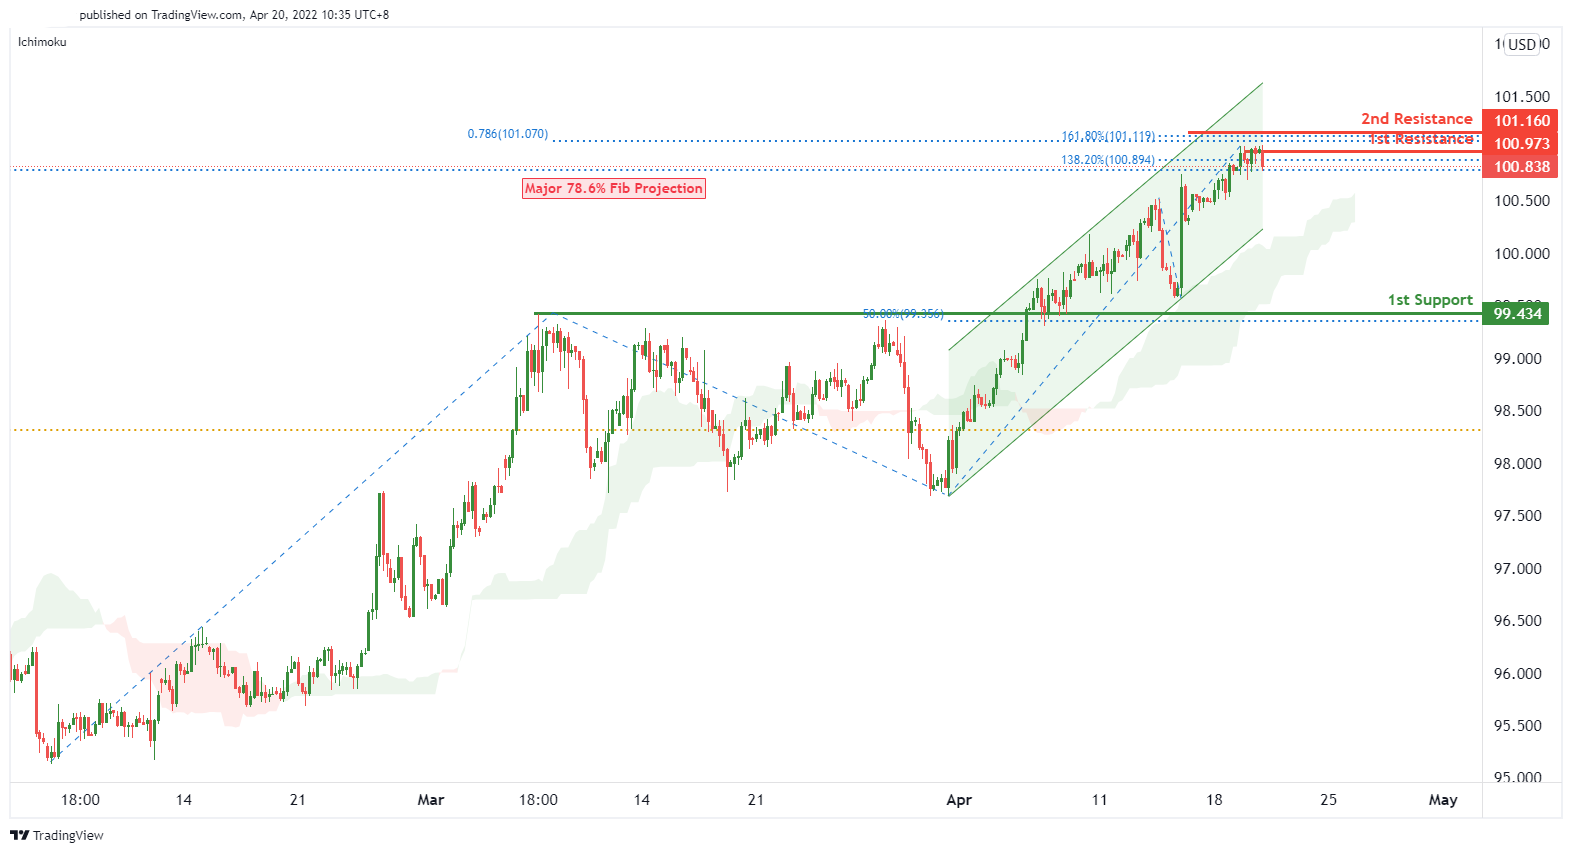
DXY:
We see a potential for bearish dip from 1st resistance level of 100.973 in line with 138.2% Fibonacci extension and 78.6% Fibonacci projection towards the 1st support level of 99.434 in line with 50% Fibonacci retracement, along with a graphical pullback support. Alternatively, price might continue to rise to 2nd resistance level of 101.160 in line with 161.8% Fibonacci extension and 78.6% Fibonacci projection.
Areas of consideration:
- H4 time frame, 1st resistance at 100.973
- H4 time frame, 2nd resistance at 101.160
- H4 time frame, 1st support at 99.434
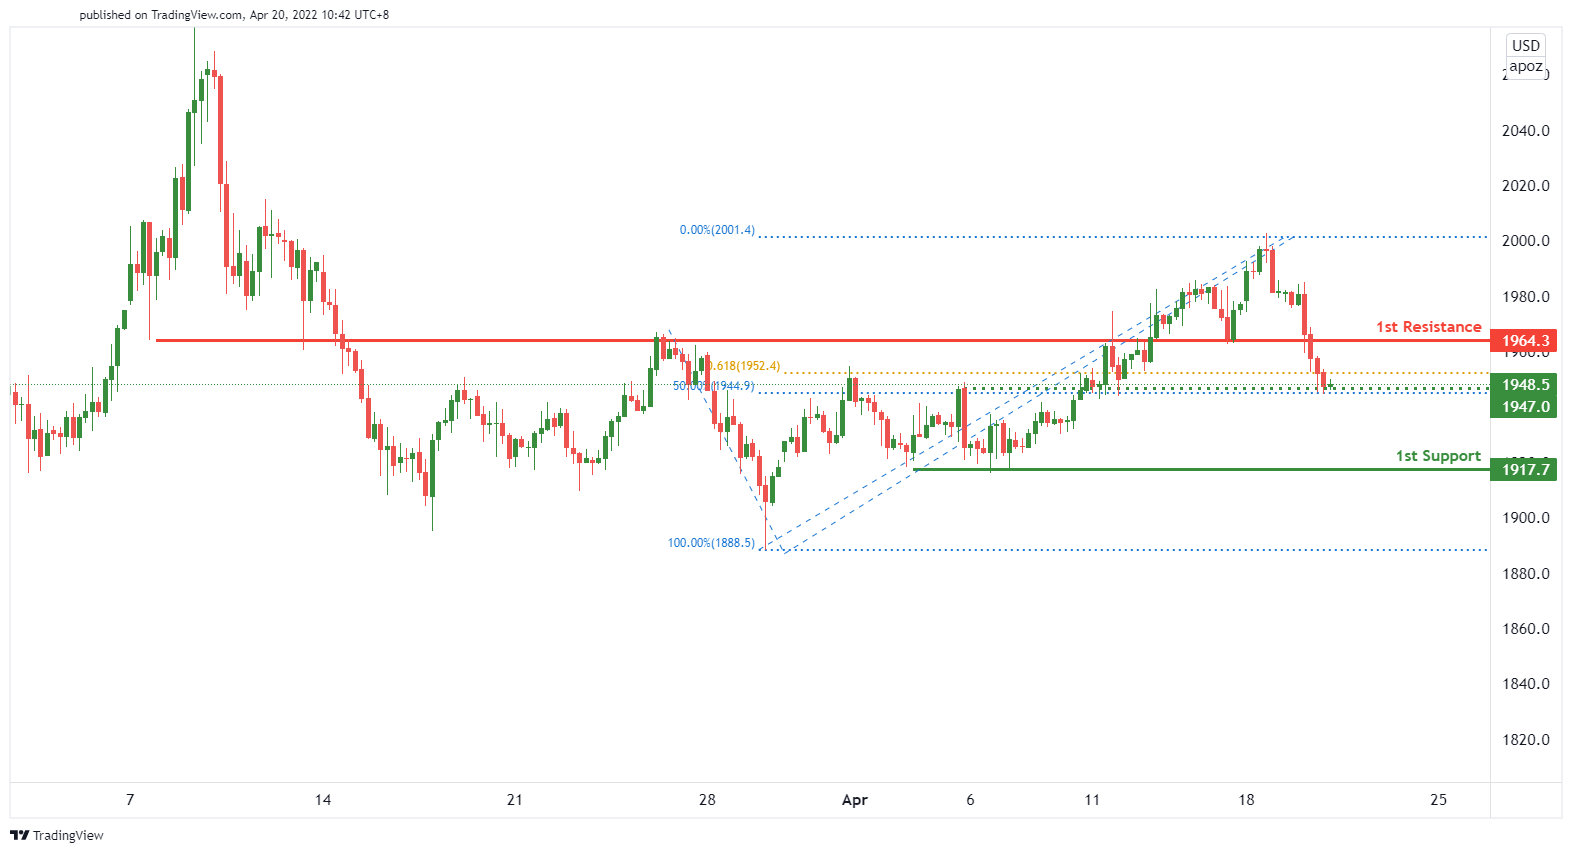
XAU/USD (GOLD):
We see that price is on a bearish momentum. Price can potentially dip from 1st resistance level of 1964.3 along with a graphical overlap resistance towards the 1st support level of 1917.7 in line with a horizontal swing low support.
Areas of consideration:
- H4 time frame, 1st Resistance at 1964.3
- H4 time frame, 1st Support at 1917.7
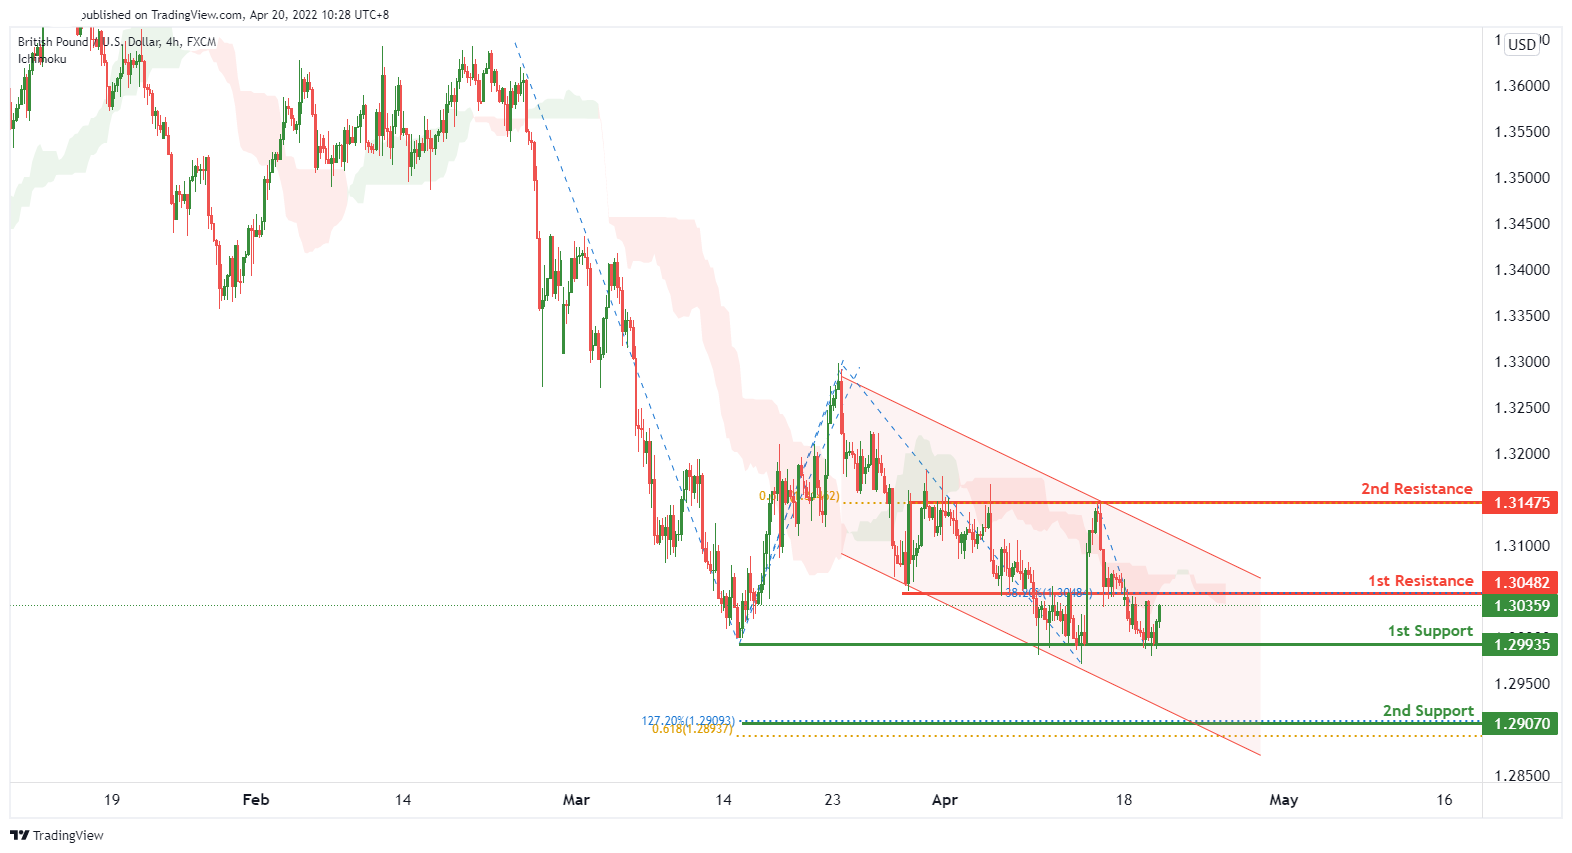
GBP/USD:
On the H4 timeframe, we have a neutral bias. Price is abiding to the descending channel and trading below the ichimoku cloud. Therefore, price can potentially break through the 1st support level of 1.29935 along with a graphical swing low support to trigger a dip towards the 2nd support level of 1.29070 which is in line with 61.8% Fibonacci projection and 127.2% Fibonacci extension. Otherwise, price might break through the 1st resistance level of 1.30482 which is in line with 38.2% Fibonacci retracement and a pullback resistance to trigger a rise towards the 2nd resistance level of 1.31475 which is in line with 61.8% Fibonacci projection.
Areas of consideration:
- H4 1st resistance at 1.30482
- H4 2nd resistance at 1.31475
- H4 1st support at 1.29935
- H4 2nd support level at 1.29070
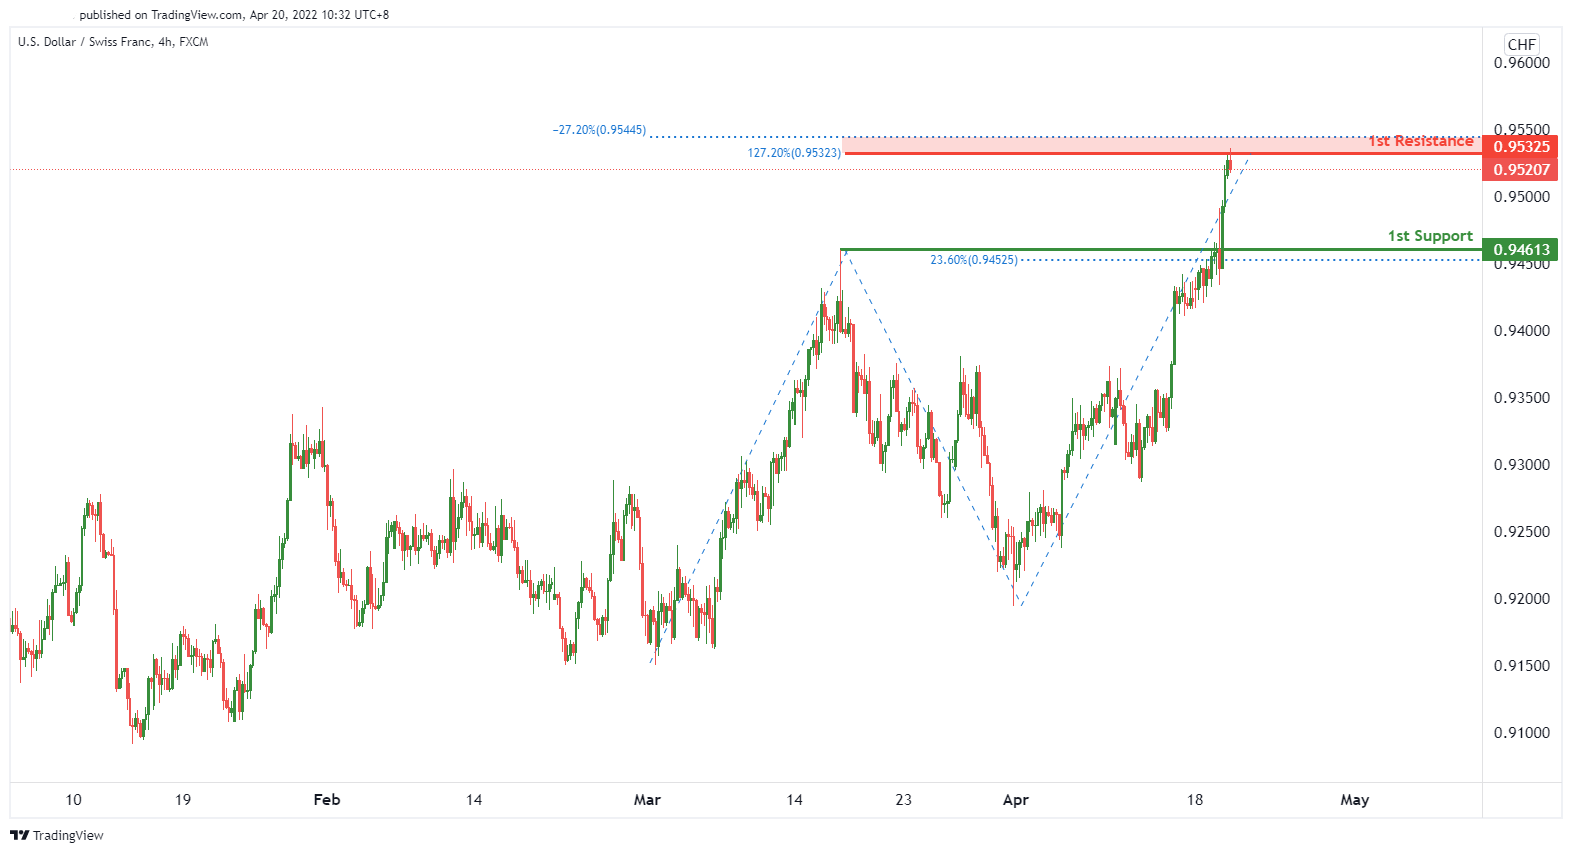
USD/CHF:
On the H4, we see the potential for bearish reversal from our 1st resistance at 0.95325 in line with 100% FIbonacci projection and 127.2% Fibonacci extension and -27.2% Fibonacci expansion towards our 1st support at 0.94613 which is in line with 23.6% Fibonacci retracement and a graphical pullback support.
Areas of consideration
- 1st support level at 0.94613
- 1st resistance level at 0.95325
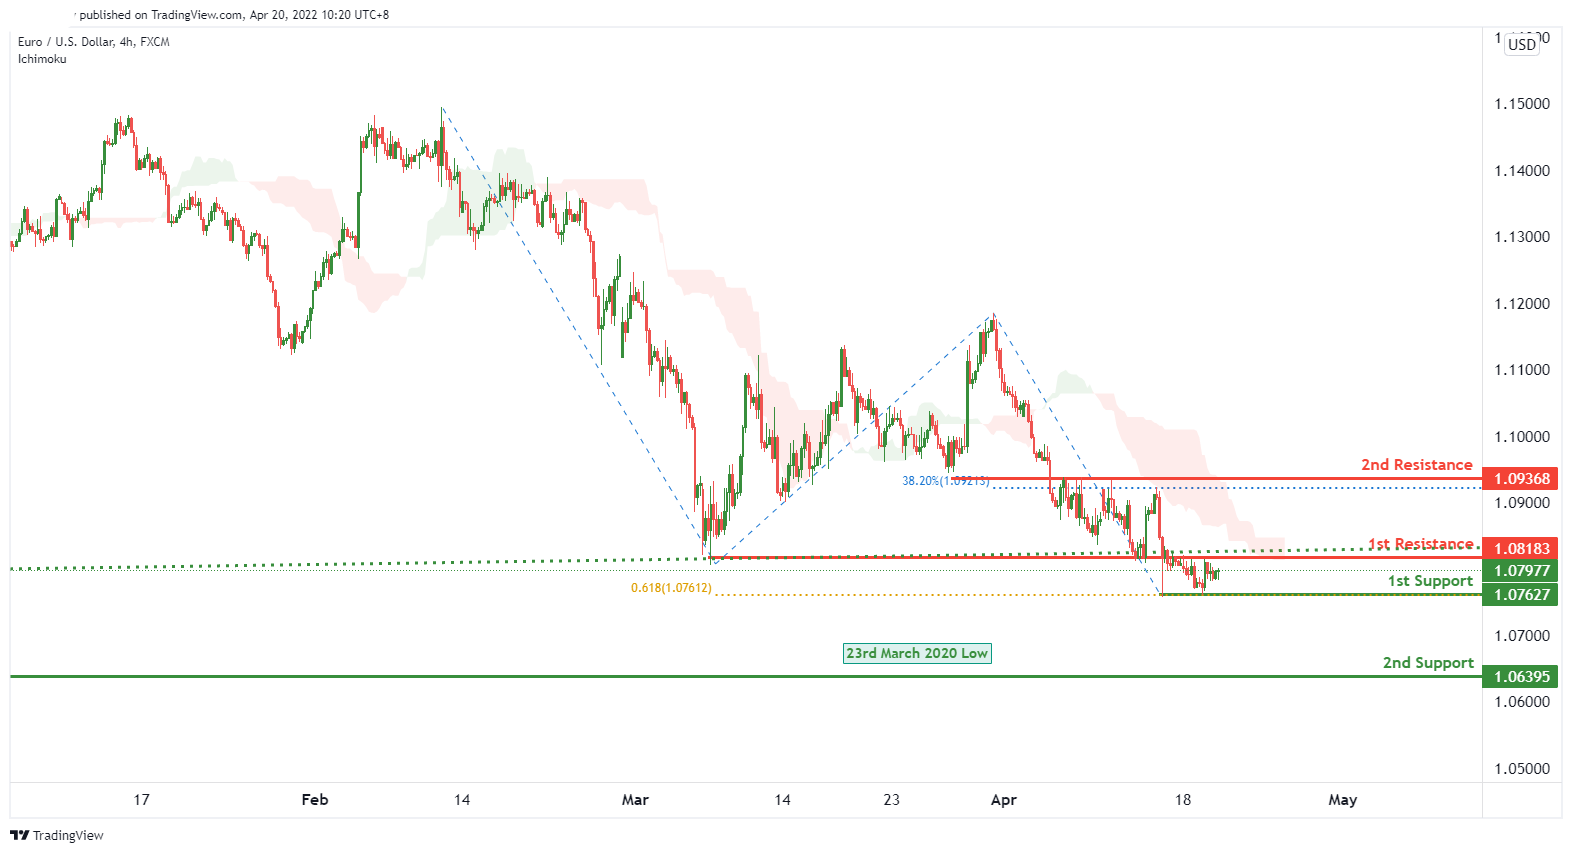
EUR/USD :
On the H4 timeframe, we have a neutral bias. Price is trading below the ichimoku cloud and thus, price can potentially break through the 1st support level of 1.07627 which is in line with 61.8% Fibonacci projection to trigger a dip towards the 2nd support level of 1.06395 along with a major horizontal swing low support. Otherwise, price might break through the 1st resistance level of 1.08183 which is in line with a pullback resistance to trigger a rise towards the 2nd resistance level of 1.09368 which is in line with 38.2% Fibonacci retracement.
Areas of consideration :
- H4 1st resistance at 1.08183
- H4 2nd resistance at 1.09368
- H4 1st support at 1.07627
- H4 2nd support at 1.06395
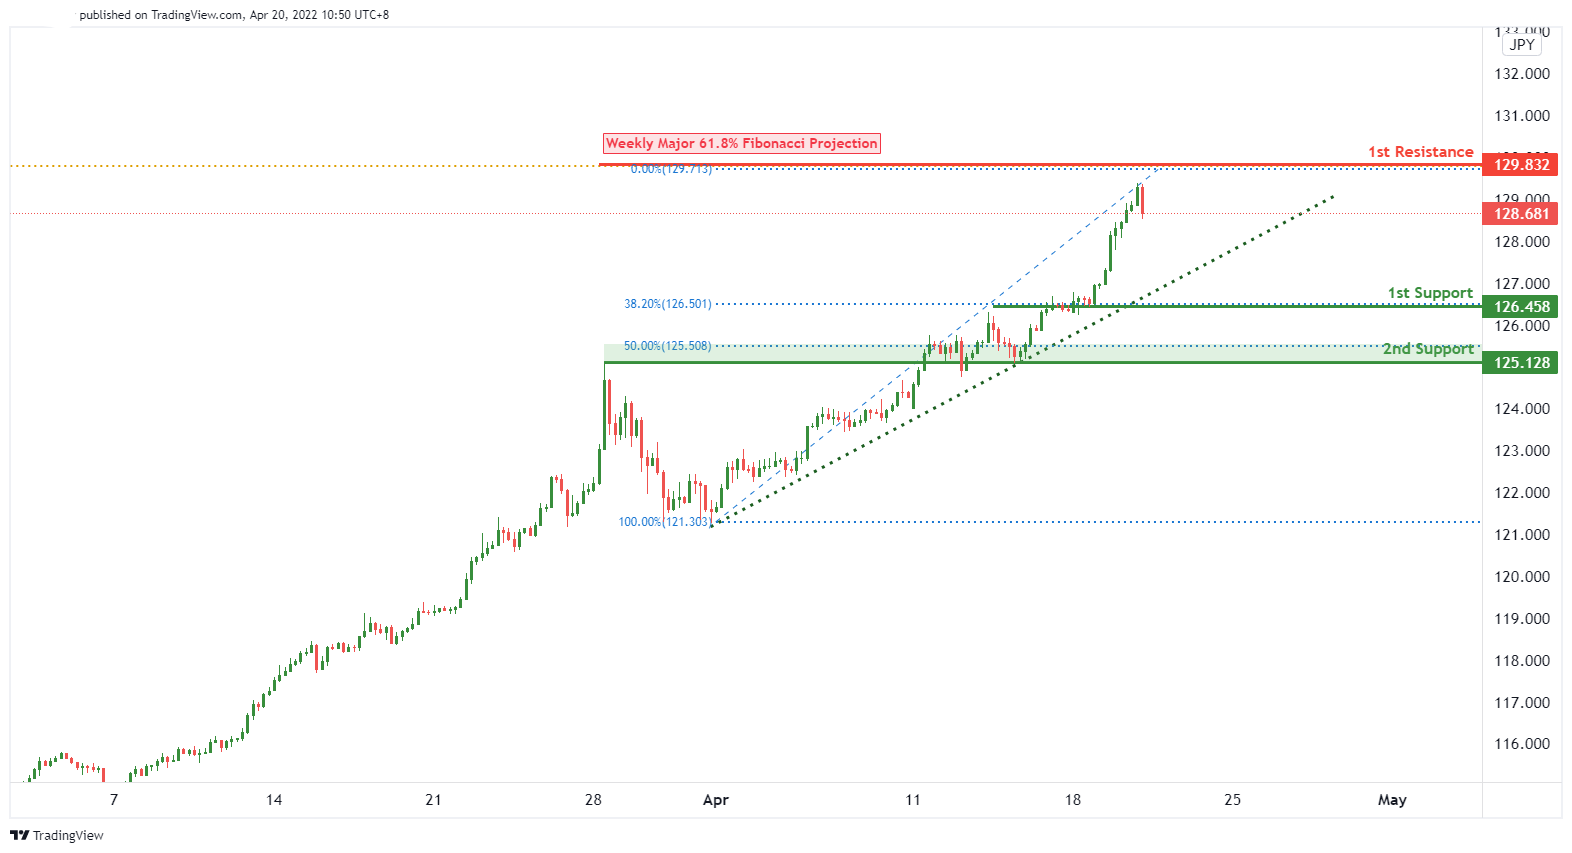
USD/JPY:
We expect price to have a bearish reversal from 1st resistance level of 129.832 in line with weekly major 61.8% Fibonacci projection towards the 1st support level of 126.458 in line with 38.2% Fibonacci retracement. If price breaks through the 1st support level, it will trigger a dip towards the 2nd support level of 125.128 which is in line with 50% Fibonacci retracement.
Areas of consideration:
- H4 time frame, 1st resistance at 129.832
- H4 time frame, 1st support at 126.458
- H4 time frame, 2nd support at 125.128
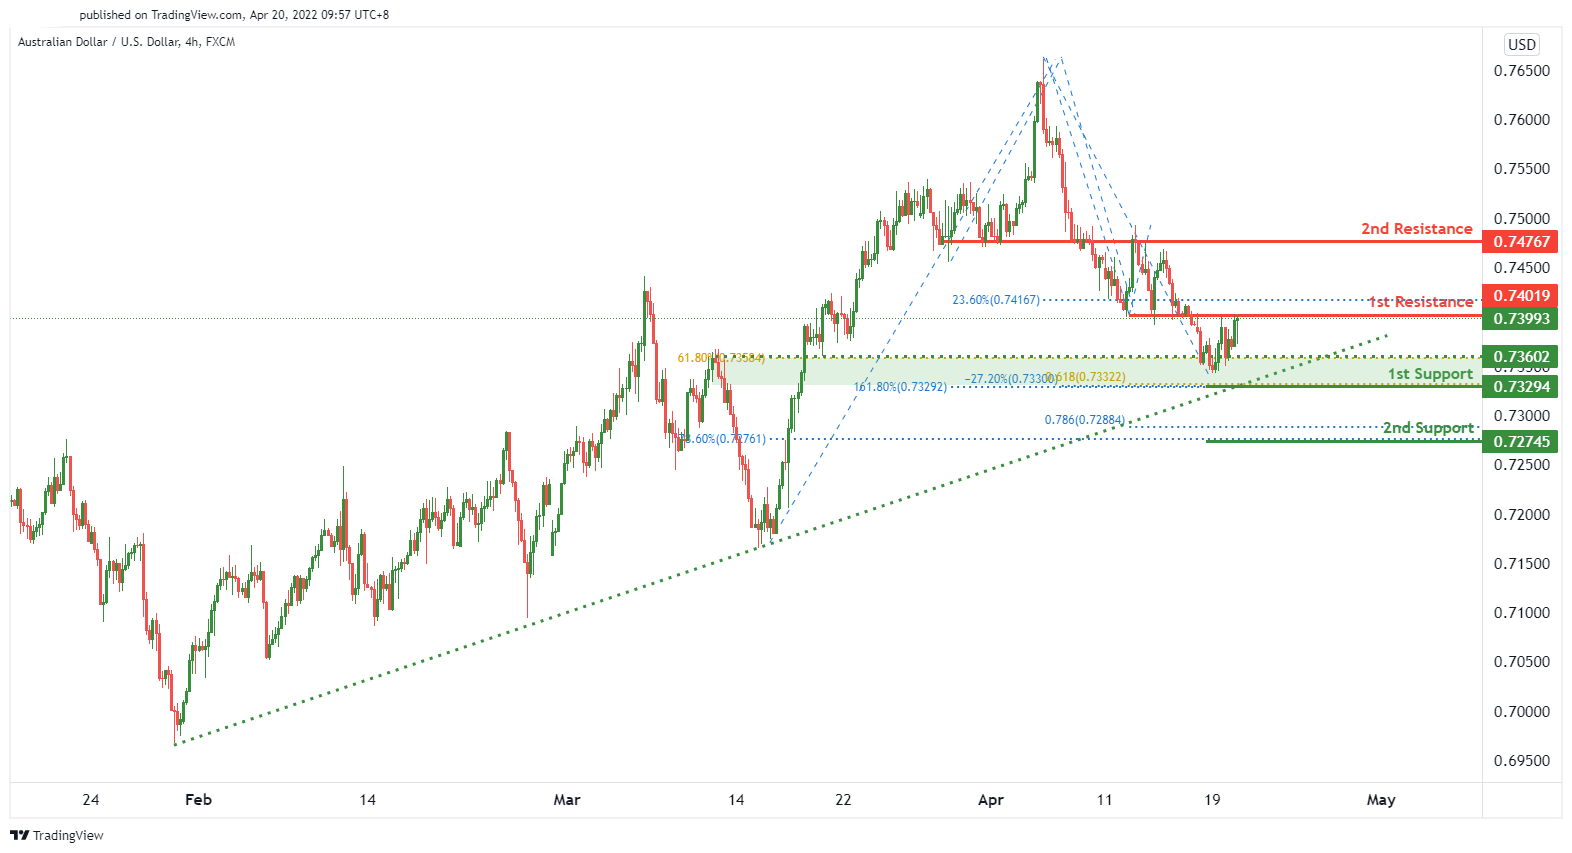
AUD/USD:
On the H4 timeframe, price is abiding by the ascending trendline. We see the potential for a bearish reversal from 1st resistance at 0.74019 in line with 23.6% Fibonacci retracement towards the 1st support level at 0.73294 in line with 61.8% Fibonacci projection, 161.8% Fibonacci extension and -27.2% Fibonacci expansion. However, price might break through 1st resistance level to trigger to move towards 2nd resistance level at 0.74767 in line with a horizontal pullback resistance.
Areas of consideration
- H4 1st resistance at 0.74019
- H4 2nd resistance at 0.74767
- H4 1st support at 0.73294
- H4 2nd support at 0.72745
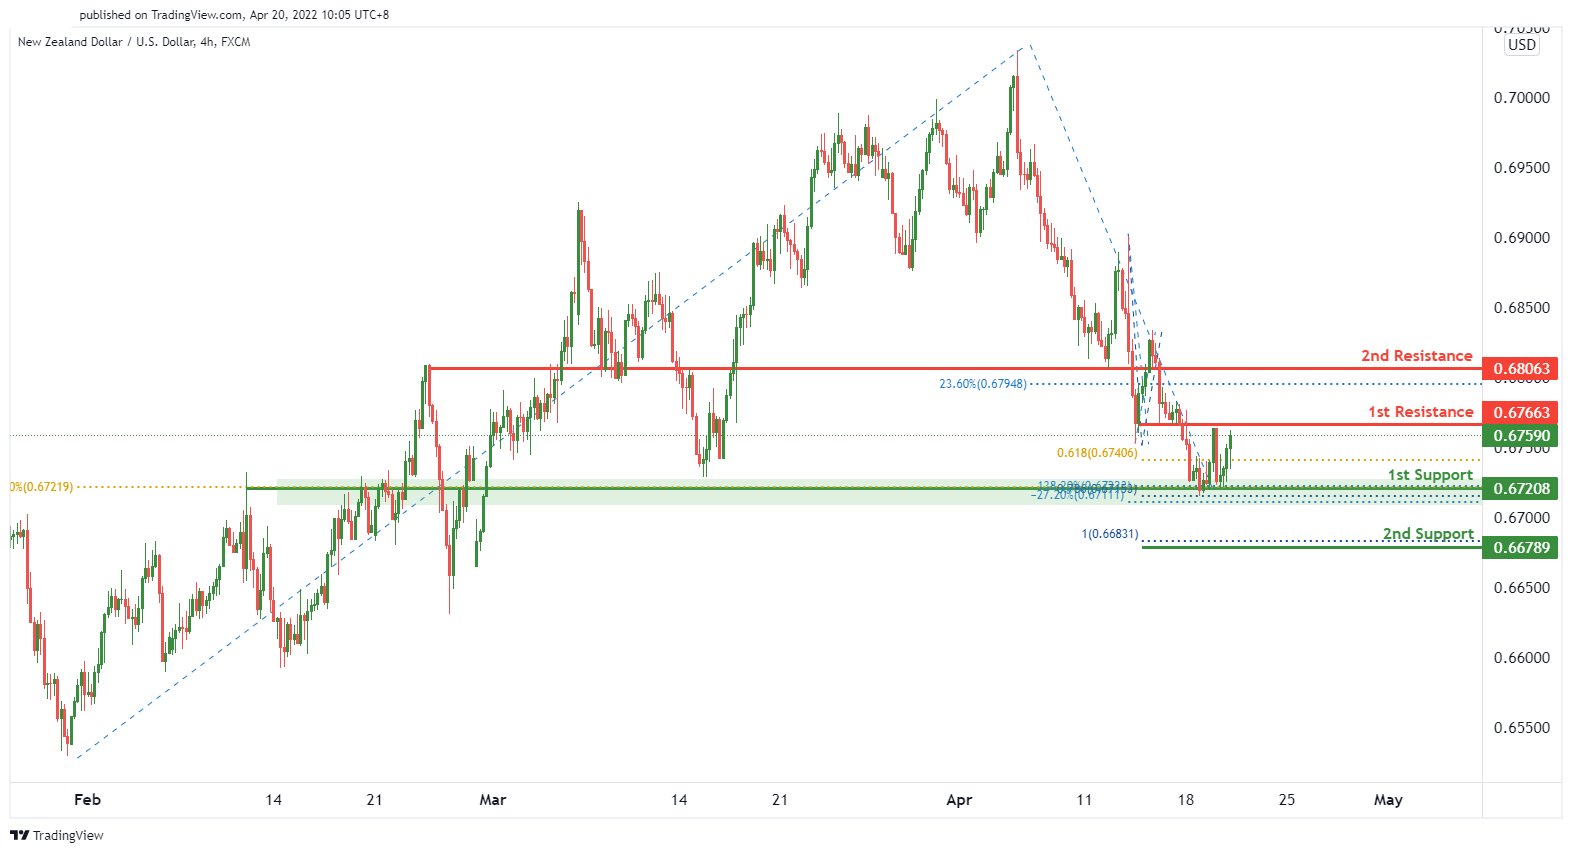
NZD/USD:
On the H4, we expect to see a potential for a bearish reversal from our 1st resistance level of 0.67663 in line with a minor pullback resistance towards our 1st support level of 0.67208 in line with 61.8% Fibonacci retracement, 138.2% Fibonacci extension and -27.2% Fibonacci expansion. Alternatively, price might break through the 1st resistance level and trigger to rise towards the 2nd resistance level of 0.68063 in line with 23.6% Fibonacci retracement.
Areas of consideration:
- H4 time frame, 1st support at 0.67208
- H4 time frame, 2nd support at 0.66789
- H4 time frame, 1st resistance at 0.67663
- H4 time frame, 2nd resistance at 0.68063
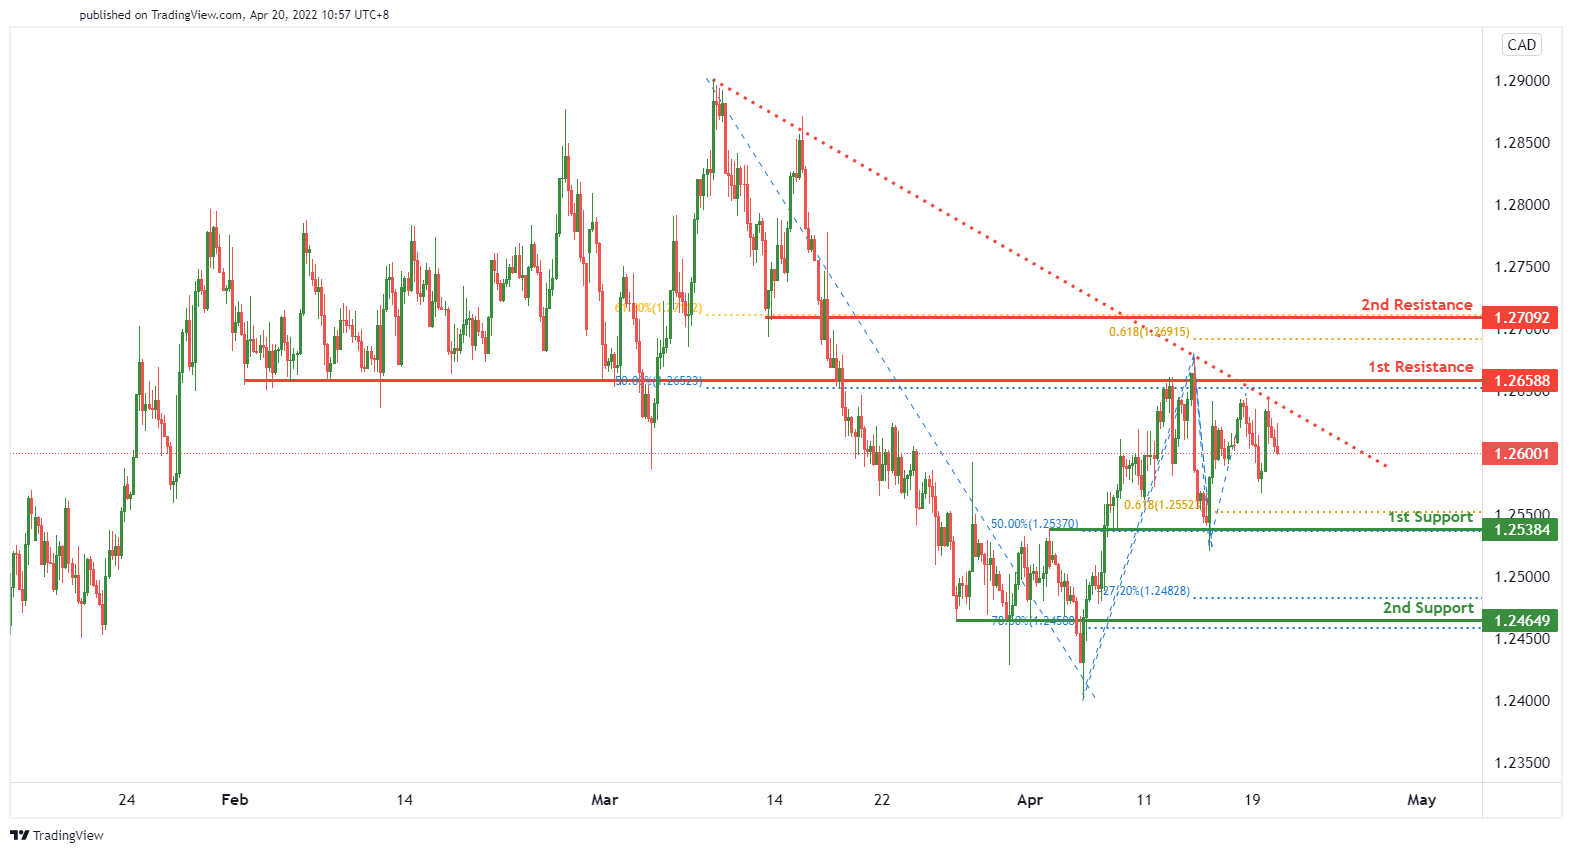
USD/CAD:
Price is abiding by the descending trendline. We are expecting a bearish dip to occur from 1st resistance level of 1.26588 in line with 50% Fibonacci retracement towards the 1st support level of 1.25384 in line with 50% Fibonacci retracement and 61.8% Fibonacci projection. Alternatively, price might break through the key resistance level and rise to the 2nd resistance level of 1.27092 in line with 61.8% Fibonacci retracement and 61.8% Fibonacci projection.
Areas of consideration:
- H4 time frame, 1st resistance at 1.26588
- H4 time frame, 2nd resistance at 1.27092
- H4 time frame, 1st support at 1.25384
- H4 time frame, 2nd support at 1.24649
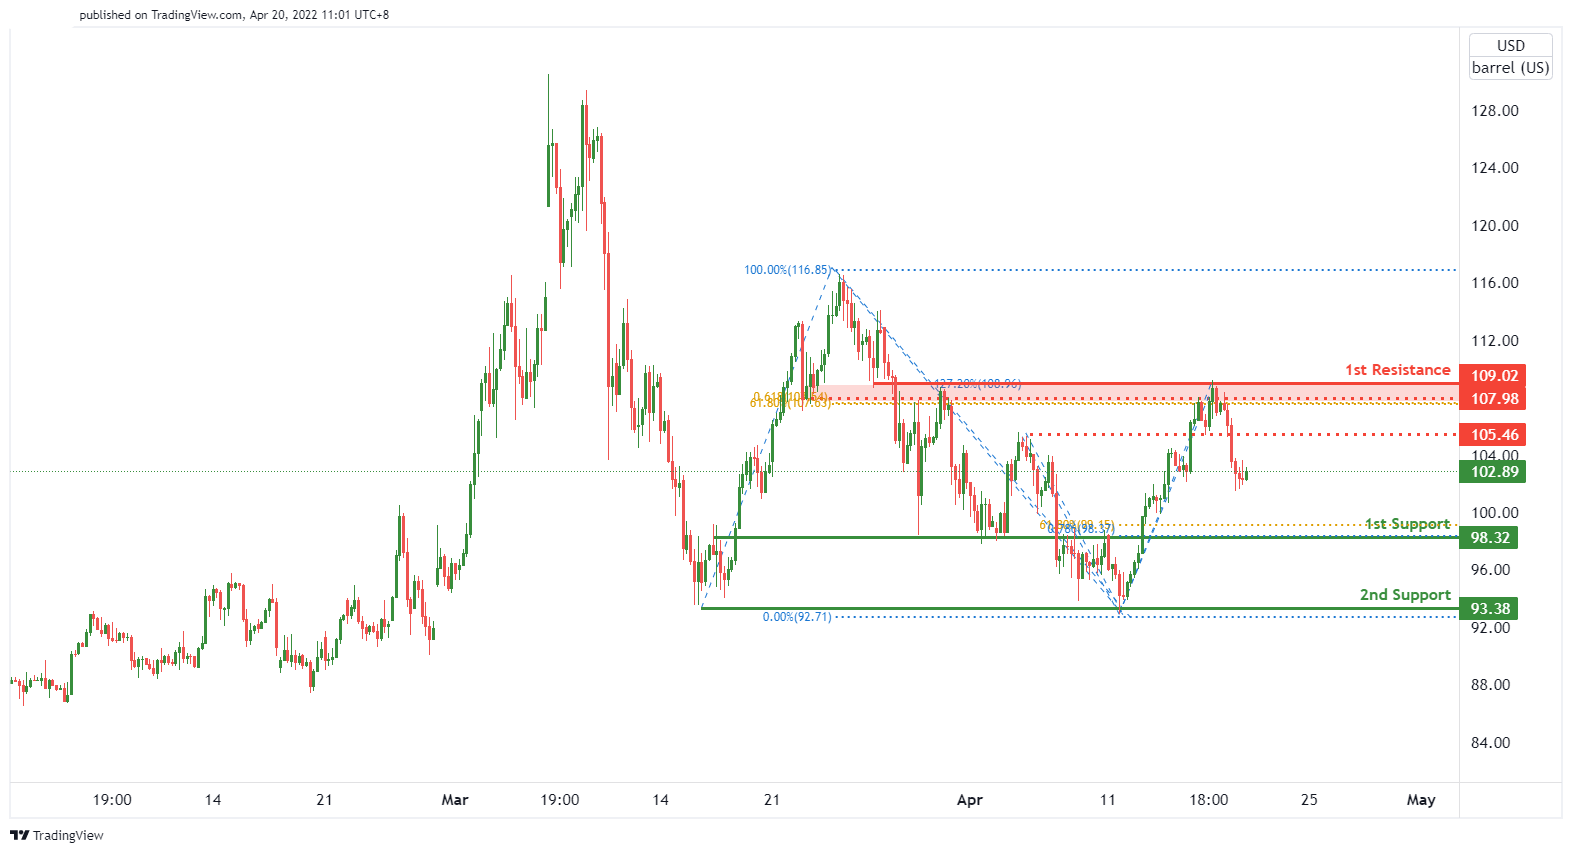
OIL:
We are expecting for a potential bullish bounce from 1st support level of 98.32 lines up with 61.8% Fibonacci retracement and 78.6% Fibonacci projection towards the 1st resistance level of 109.02 lines up with 61.8% retracement, 61.8% Fibonacci projection and 127.2% Fibonacci extension. Alternatively, price might break the key support level and continue to drop to the 2nd support level of 93.38 along with a horizontal swing low support.
Areas of consideration:
- H4 time frame, 1st resistance of 109.02
- H4 time frame, 1st support of 98.32
- H4 time frame, 2nd support of 93.38
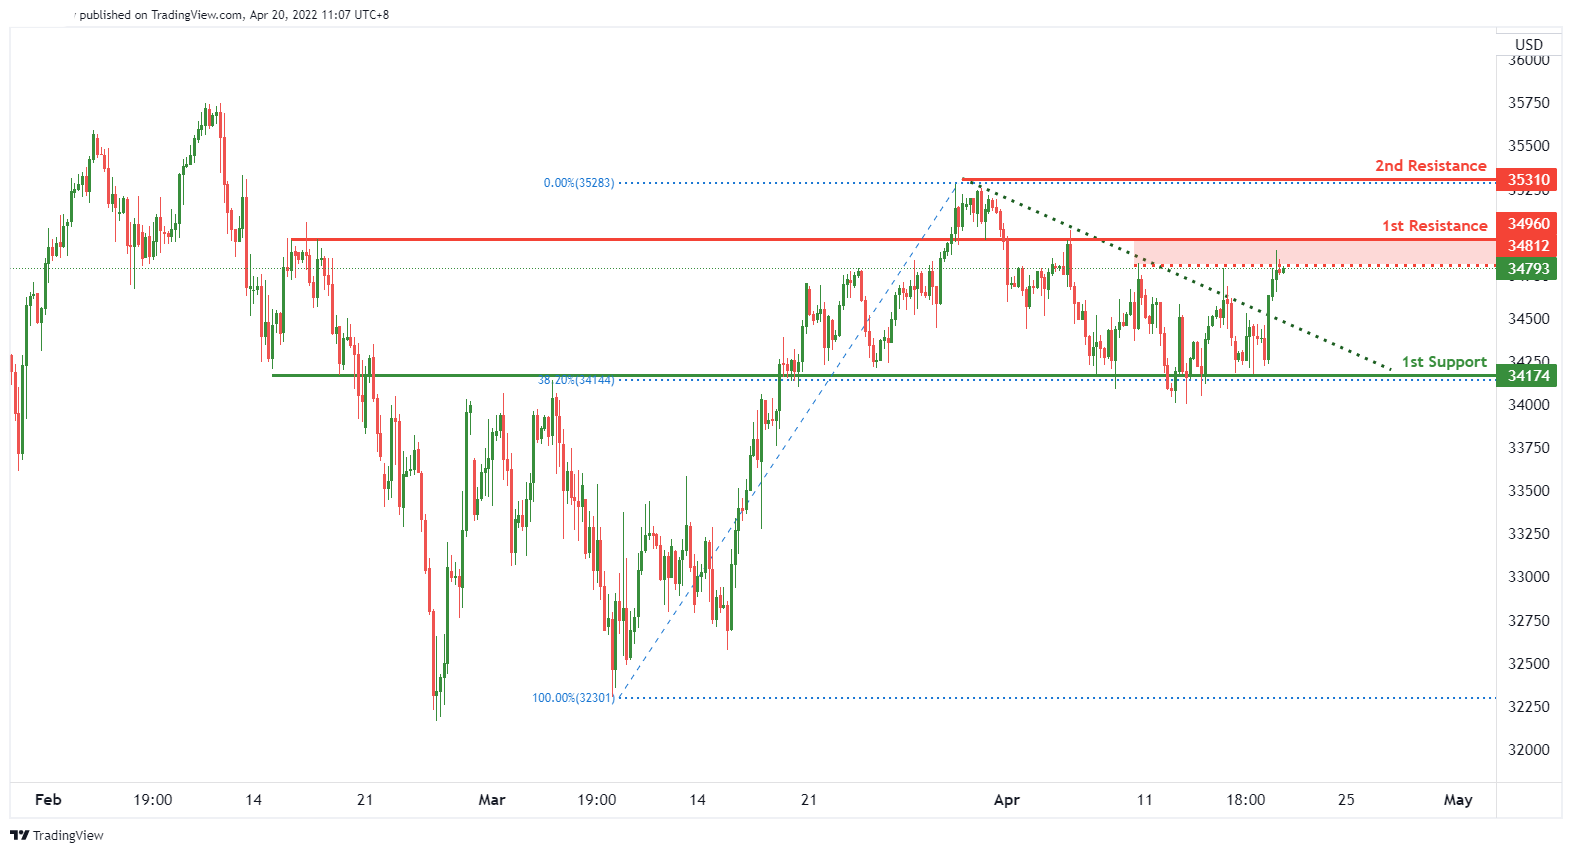
Dow Jones Industrial Average:
Price is near to the pivot level. We can see a potential for a bearish reversal from 1st resistance level of 34960 along with previous graphical swing high resistance towards the 1st support level of 34174 which lines up with 38.2% Fibonacci retracement. Alternatively, price might break the key resistance level and rise towards the 2nd resistance level of 35310 in line with graphical swing high resistance.
Areas of consideration :
- H4 time frame, 1st resistance at 34960
- H4 time frame, 2nd resistance at 35310
- H4 time frame, 1st support at 34174


