
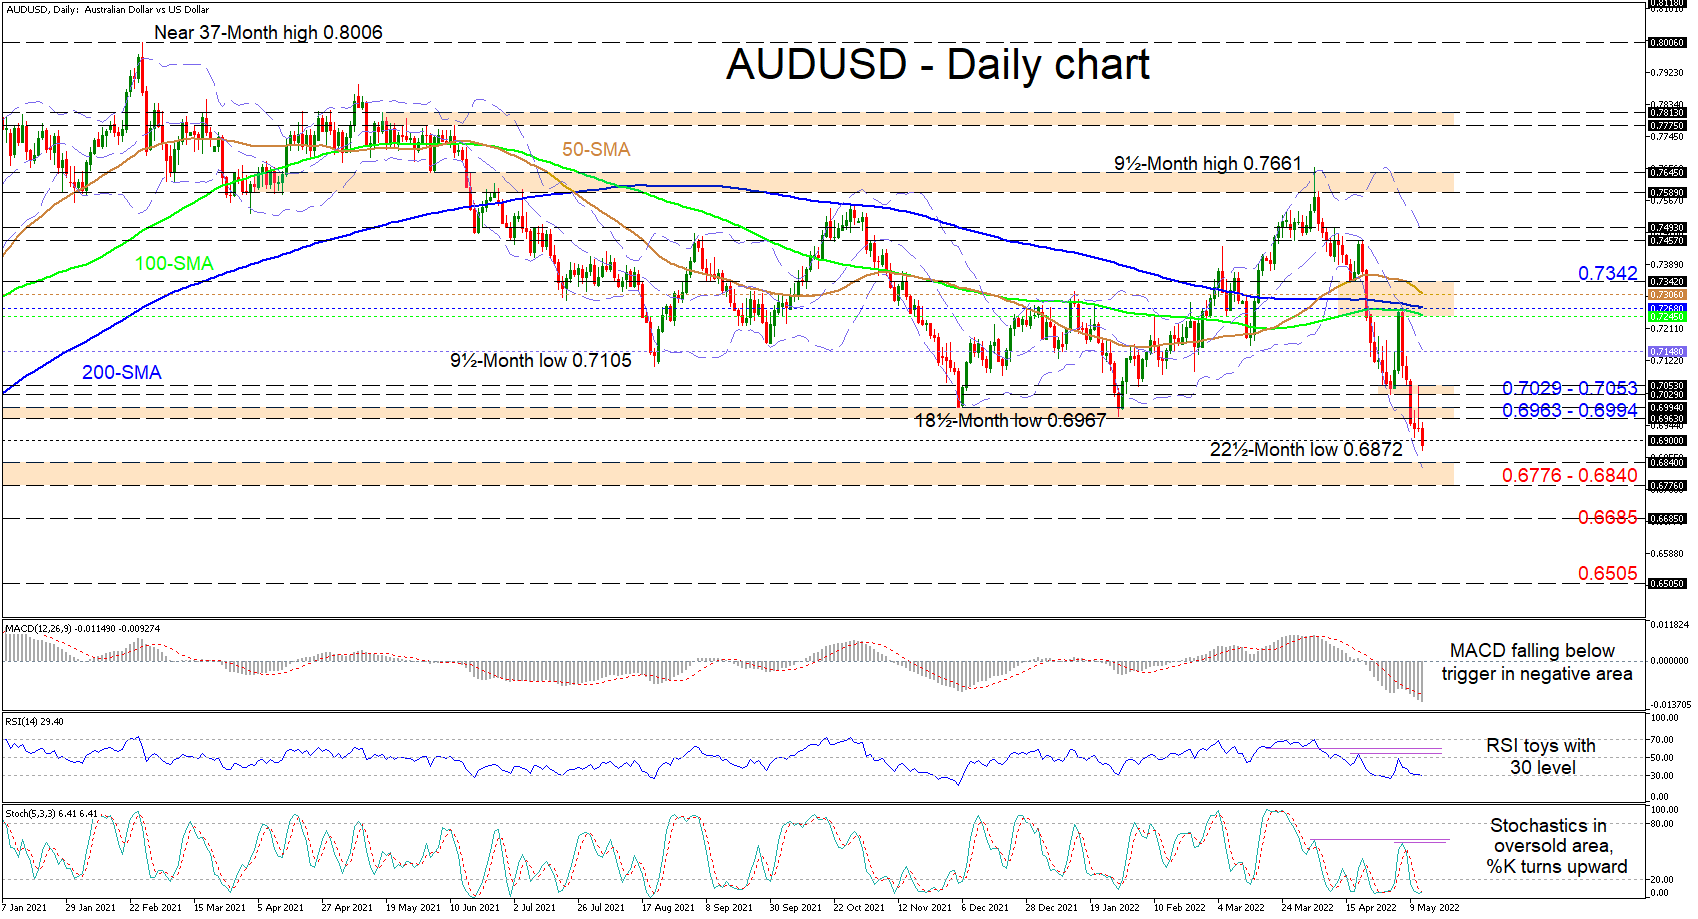
AUDUSD has pierced beneath the 0.6900 border and is eyeing the lower Bollinger band, located within the key 0.6776-0.6840 support boundary that stretches back to mid-June 2020. While the longer-term 100- and 200-day simple moving averages (SMAs) have capped advances, the rolling over of the 50-day SMA is endorsing a continuation of the more than one-month decline from the bullish spike of 0.7661.
Meanwhile, the short-term oscillators are transmitting conflicting messages in directional momentum. The MACD is suggesting additional selling in the pair, while the softer slide in the RSI is implying weakness in bearish impetus. Moreover, the stochastic oscillators’ negative charge is looking dubious as, south of the 20 mark, the upturn in the stochastic %K line has nudged above the %D line.
If the downward trajectory endures, preliminary support could occur around the fortified 0.6776-0.6840 support section shaped by the lows over the second half of June 2020, a zone which also contains the lower Bollinger band. Successfully diving underneath this crucial border may reinforce the negative outlook, with sellers aiming to weigh on the 0.6685 inside swing high recorded in the early stages of March 2020. If sellers retain control, they could then seek out the 0.6505 low around the end of May 2020.
On the flipside, if buyers re-emerge and drive the price back above the 0.6900 hurdle, they may be confronted with nearby upside constraints starting with the tough 0.6963-0.6994 resistance band, shaped by multiple troughs extending back to mid-July 2020. Secondly, not much higher, the 0.7029-0.7053 barrier could then come into focus. Should buyers overrun these congested barricades, they may then tackle the falling mid-Bollinger band at 0.7148 before pursuing a significant section of resistance existing from the 100-day SMA at 0.7245 until the 0.7342 inside swing low.
Summarizing, AUDUSD is sustaining a broader bearish bias below the 0.6963-0.6994 support foundation and the 0.7245-0.7342 resistance region, which includes the May high. That said, for optimism to begin to grow, the bulls would need to propel the price north of the 0.7029-0.7053 obstacle.


