
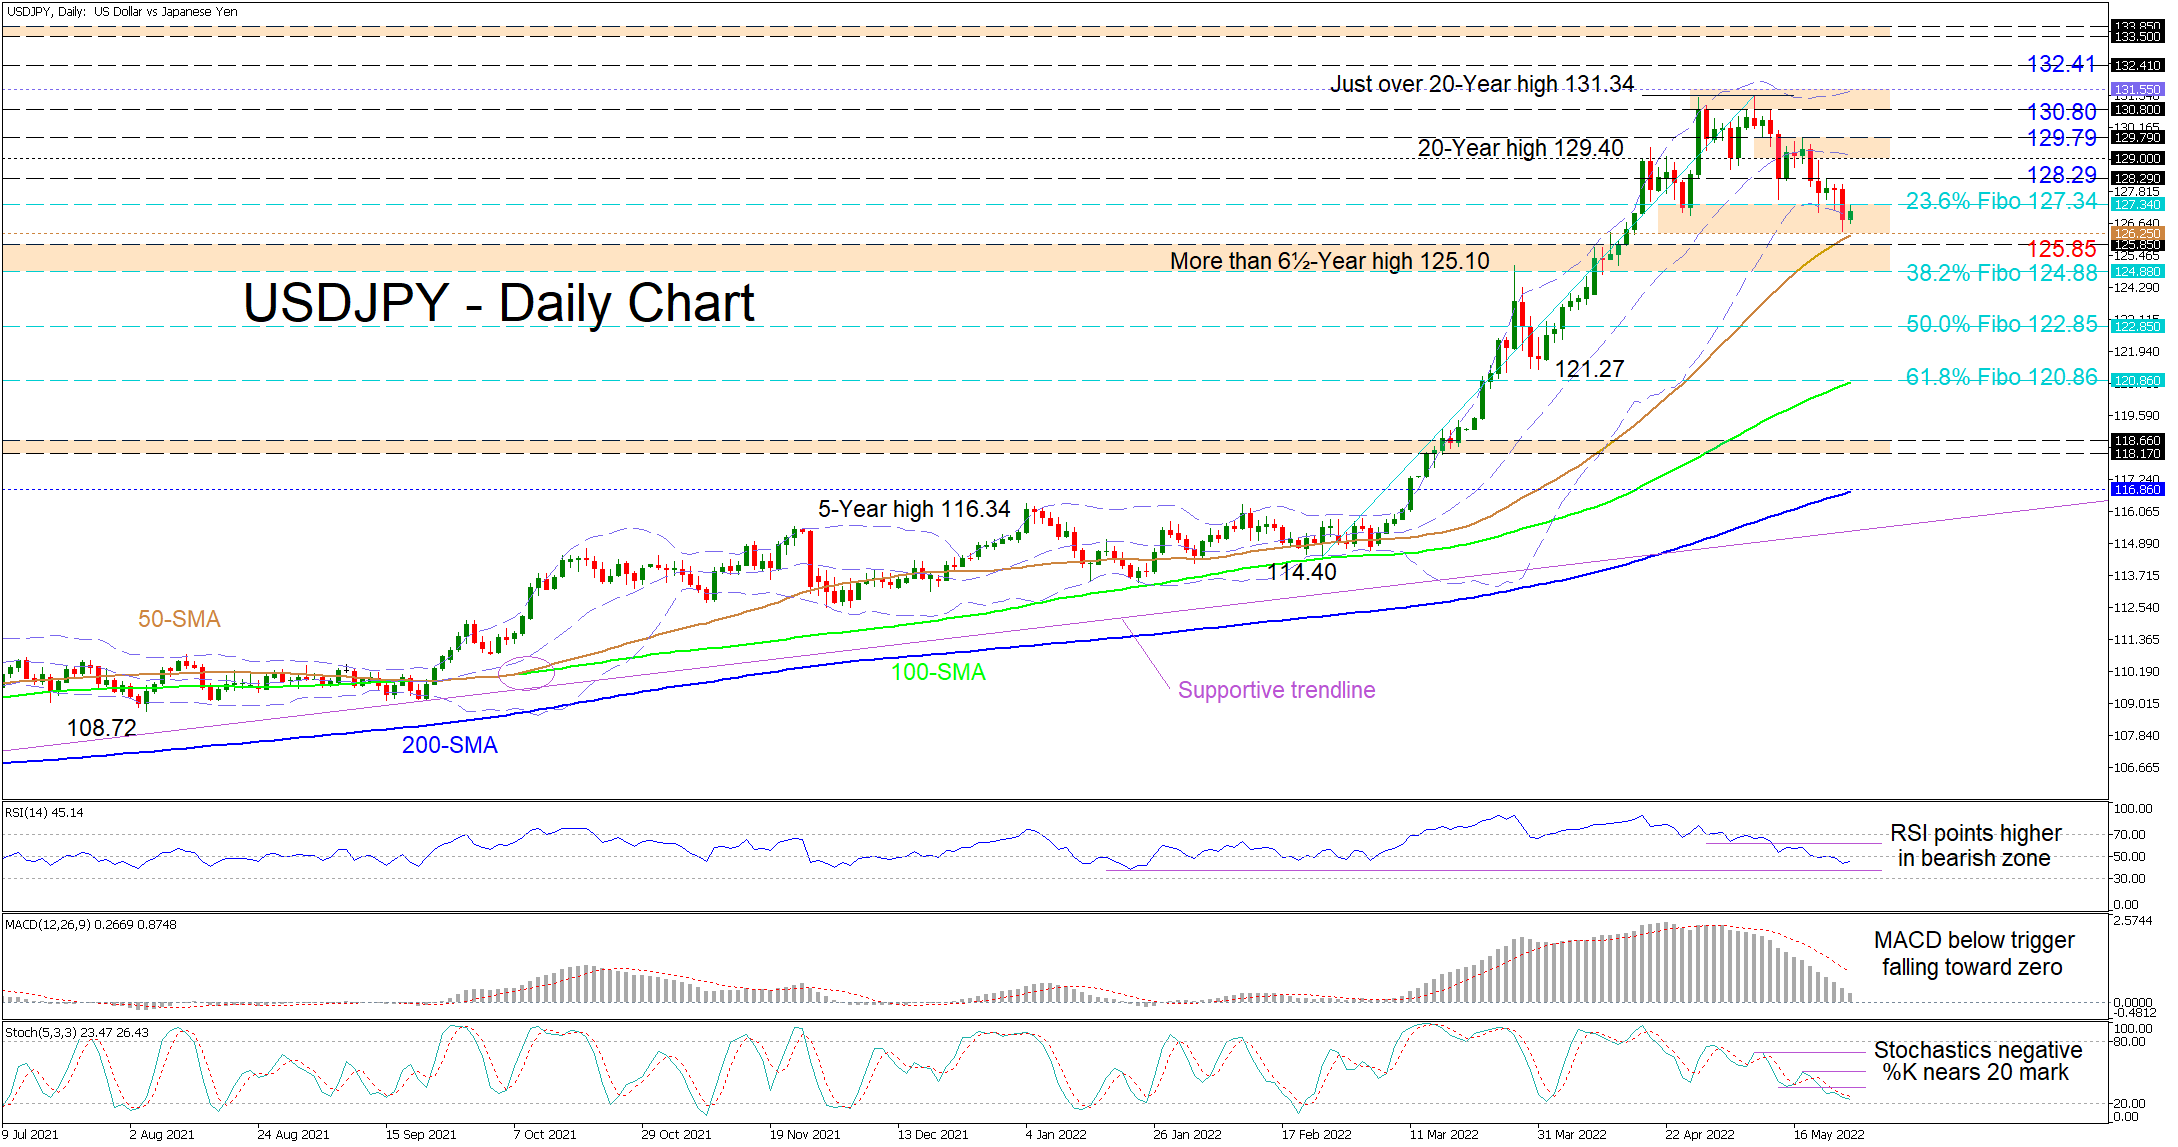
USDJPY is trading around the lower Bollinger band residing within a support zone which is linking the 127.34 barrier with the rising 50-day simple moving average (SMA) at 126.25, the former being the 23.6% Fibonacci retracement of the uptrend from 114.40 until a high that oversteps the 20-year mark at 131.34. The hiking SMAs are sponsoring the positive structure despite the price fading past the 23.6% Fibonacci level.
As things stand, the short-term oscillators are demonstrating mixed messages in directional momentum. The MACD is still sliding beneath its red trigger line and is nearing the zero threshold, indicating that positive momentum is dwindling. Furthermore, the %K and %D lines of the negatively charged stochastic oscillator are a stretch away from the 20 oversold barrier. Meanwhile, the RSI is improving in the bearish region, implying buyers are fighting back.
If the 126.25-127.34 upside defence, involving the 50-day SMA and the 23.6% Fibo impede further retracements in the pair and buyers manage to prop the price back above the 23.6% Fibo of 127.34, resistance could commence around the nearby 128.29 high. If buying pressures increase, the next resistance obstacle may present itself between the 129.00 handle and the 129.79 border, a fortified area that encapsulates the mid-Bollinger band. Should additional bullish legs unfold, the region from the 130.80 level until the upper Bollinger band at 131.55 – that includes more than 20-year highs – could make it difficult for the pair to pilot to new heights and test the 132.41 mid-April 2002 deterrent.
Otherwise, if sellers resurface and overwhelm the ascending 50-day SMA at 126.25, an adjacent support boundary from the 125.85 mark until the 38.2% Fibo of 124.88 may counter the bears’ efforts to deepen a downside correction in the pair. If this durable border which incorporates the June 2015 peaks fails to dismiss negative tendencies in the pair, the 50.0% Fibo of 122.85 may promptly draw traders’ attention. If the pair sustains a heavy tone, the spotlight could then shift towards the March 31 trough of 121.27 and the 100-day SMA’s location presently at the 61.8% Fibo of 120.86.
Summarizing, USDJPY’s bullish structure is under the microscope as the price weighs on the 50-day SMA at 126.25 and the 124.88-125.85 support just beneath. The pair’s bullish bias should remain intact if the price holds above the 124.88-125.85 barrier. Meanwhile, a price dive extending below the 124.88 side of the support may reinforce dampening prospects in the pair encouraging a deeper retracement to develop.


