
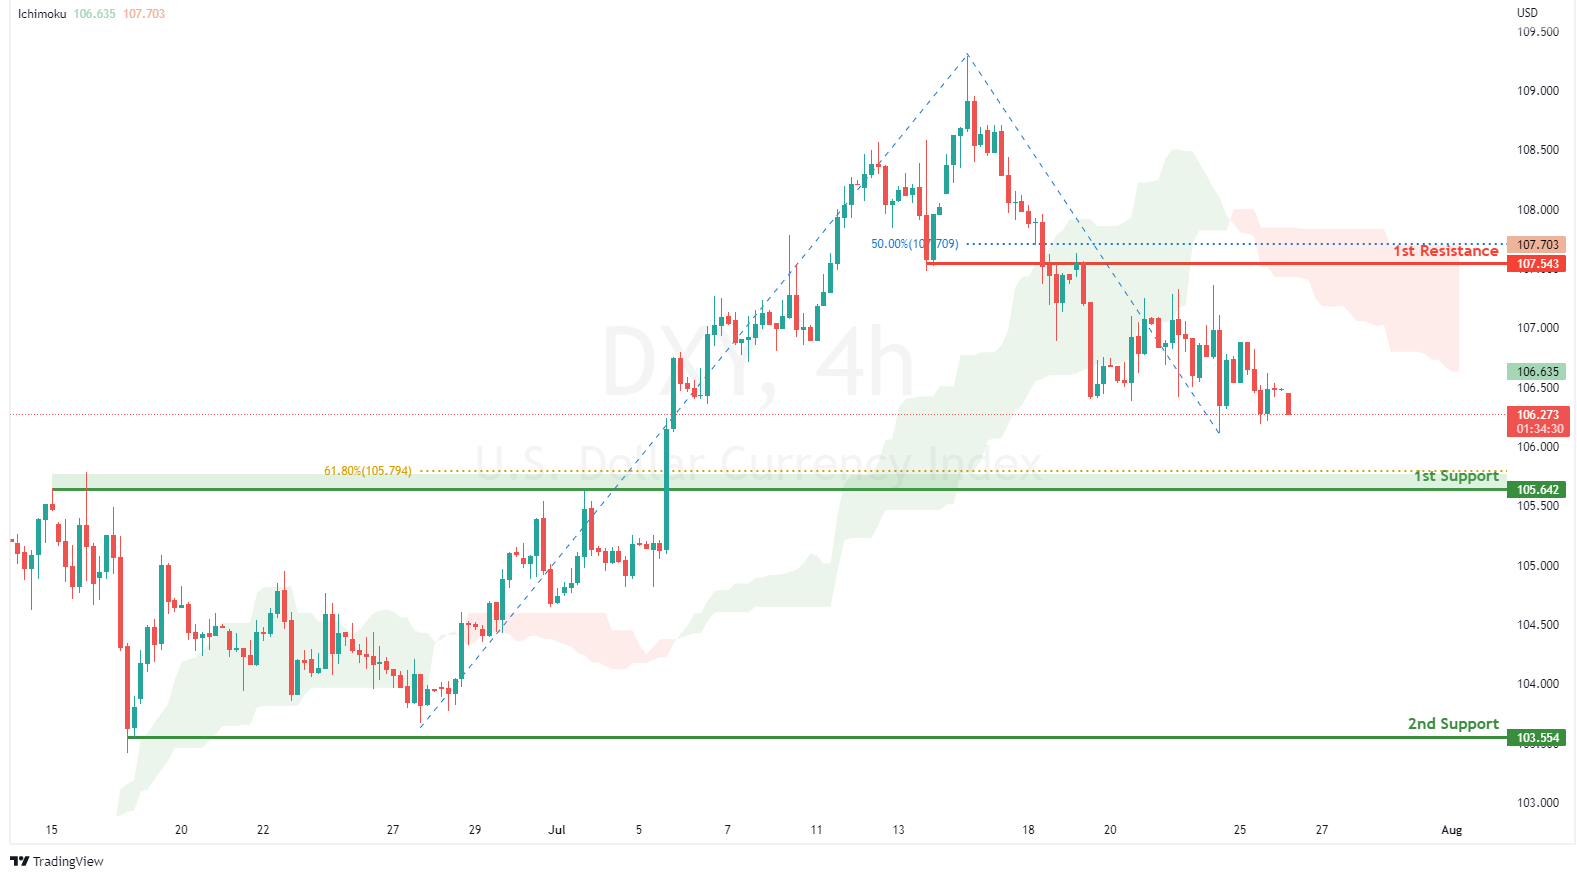
DXY:
On the H4, with prices moving below the ichimoku indicator, we have a bearish bias that prices will drop to the 1st support at 105.642 in line with overlap support and 61.8% fibonacci retracement. Once there is downside confirmation of price breaking 1st support structure, we would expect bearish momentum to carry price to 2nd support at 103.554 in line with swing low support. Alternatively, price could rise to 1st resistance at 107.543 where the pullback resistance and 50% fibonacci retracement are.
Areas of consideration:
- H4 time frame, 1st resistance at 107.543
- H4 time frame, 1st support at 105.642
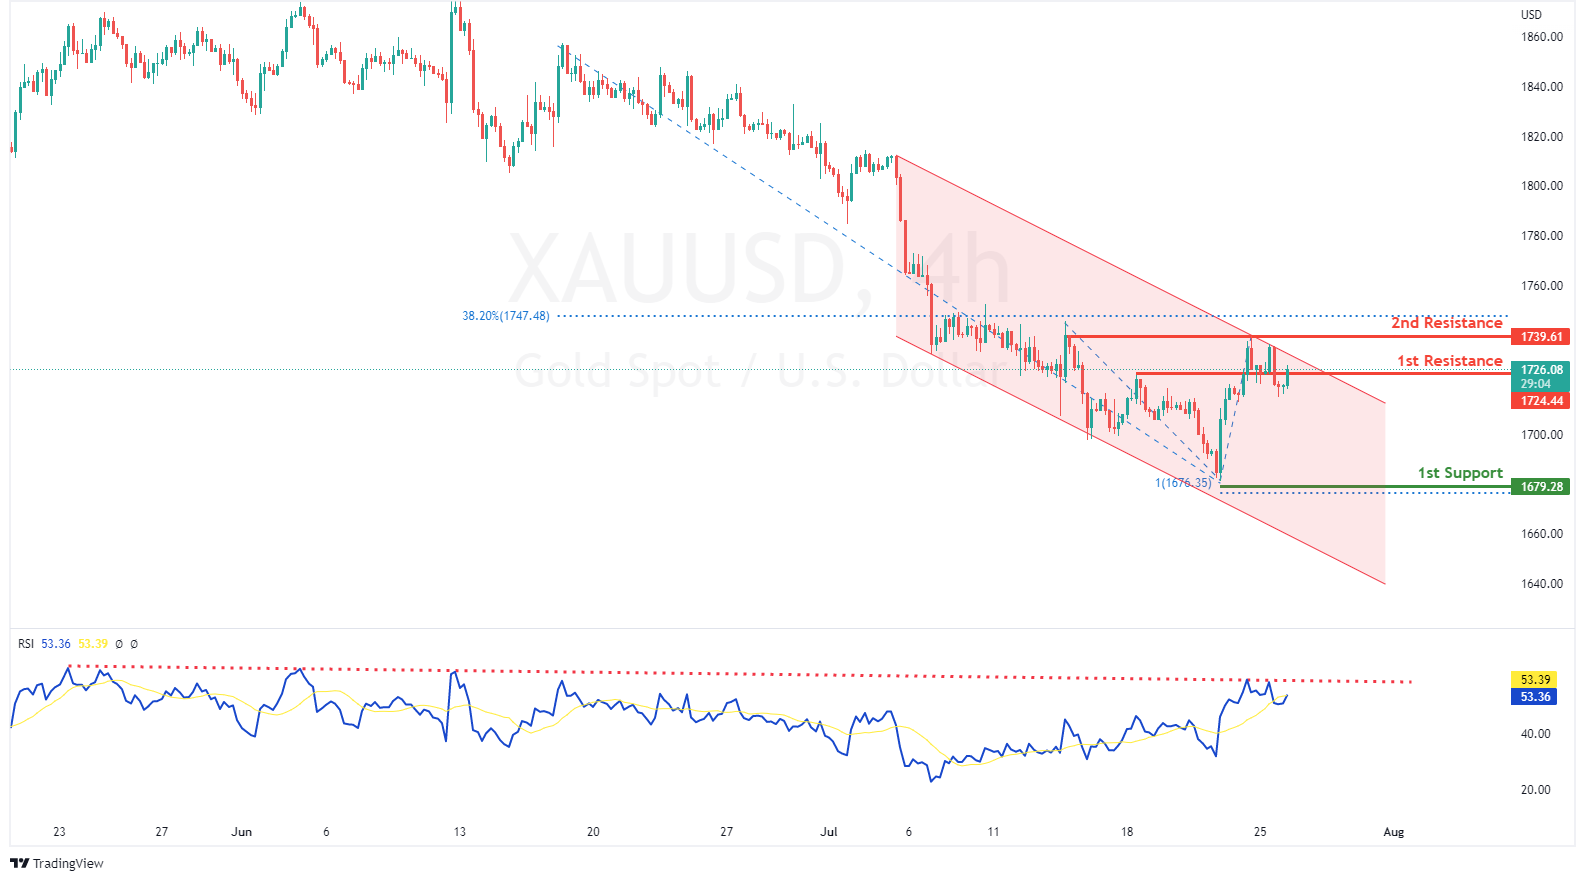
XAU/USD (GOLD):
On the H4, with price moving within a descending channel and RSI moving in a descending trendline, we have a bearish bias that price will drop from 1st resistance at 1724.44 where the pullback resistance is to 1st support at 1679.28 in line with 100% fibonacci projection and swing low support on the daily timeframe. Alternatively, price could break 1st resistance and rise to 2nd resistance at 1739.61 where the 38.2% fibonacci retracement and swing high resistance are.
Areas of consideration:
- H4 time frame, 1st Resistance at 1724.44
- H4 time frame, 1st Support at 1679.28
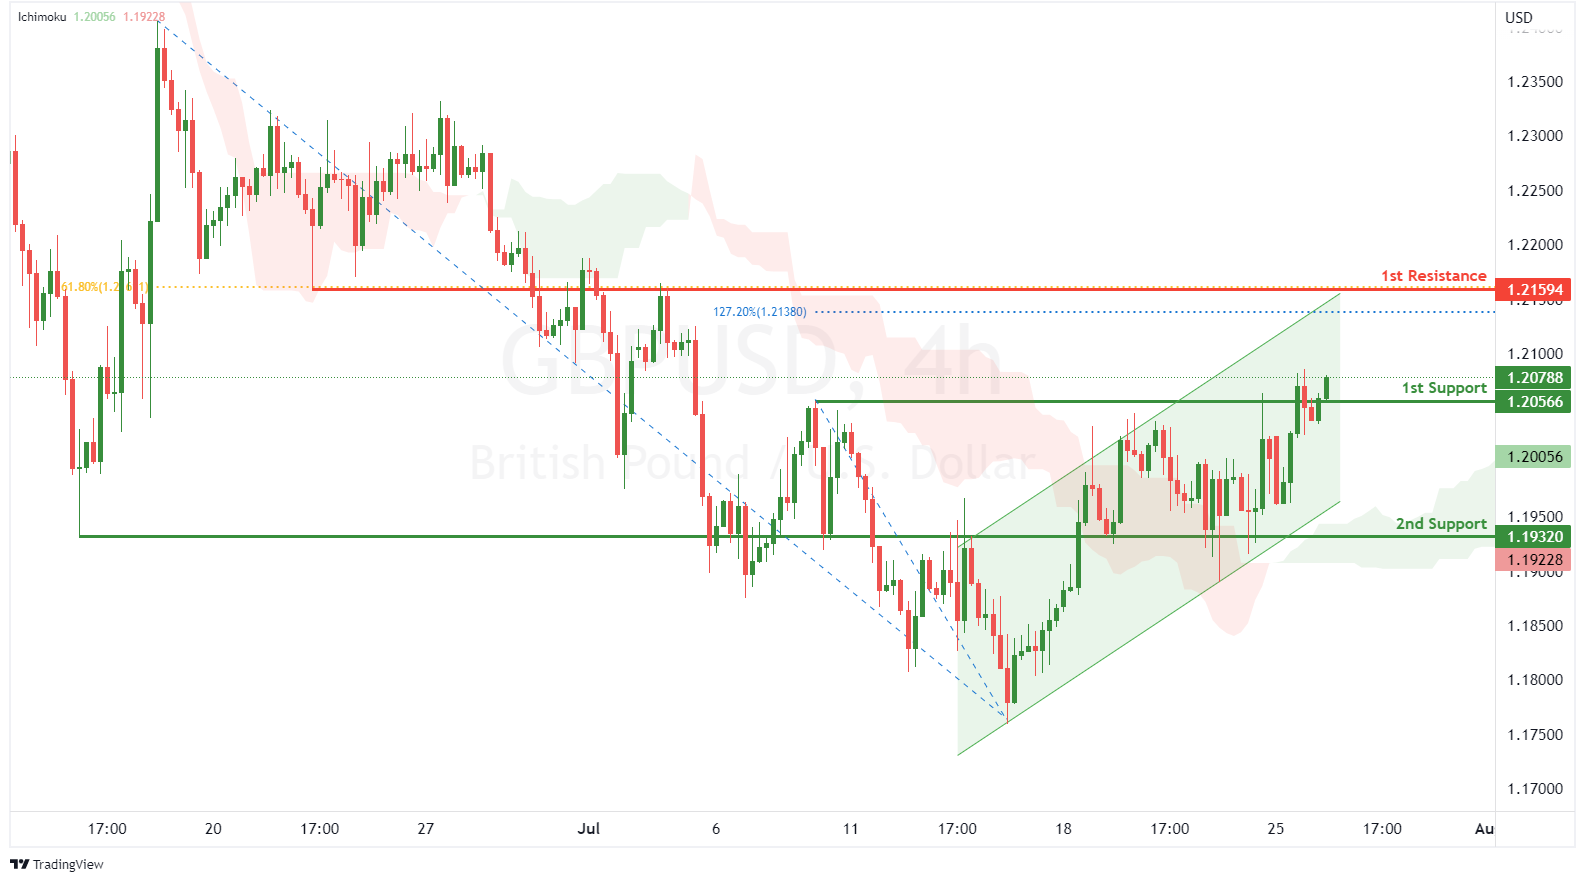
GBP/USD:
On the H4, with prices moving within an ascending channel and above the ichimoku indicator, we have a bullish bias that price will rise to the 1st resistance at 1.21594 where the pullback resistance, 127.2% fibonacci extension and 61.8% fibonacci retracement are from the 1st support at 1.20566 where the pullback support is. Alternatively, price could break 1st support and drop to 2nd support at 1.19320 where the pullback support is.
Areas of consideration:
- H4 1st resistance at 1.21594
- H4 1st support at 1.20566
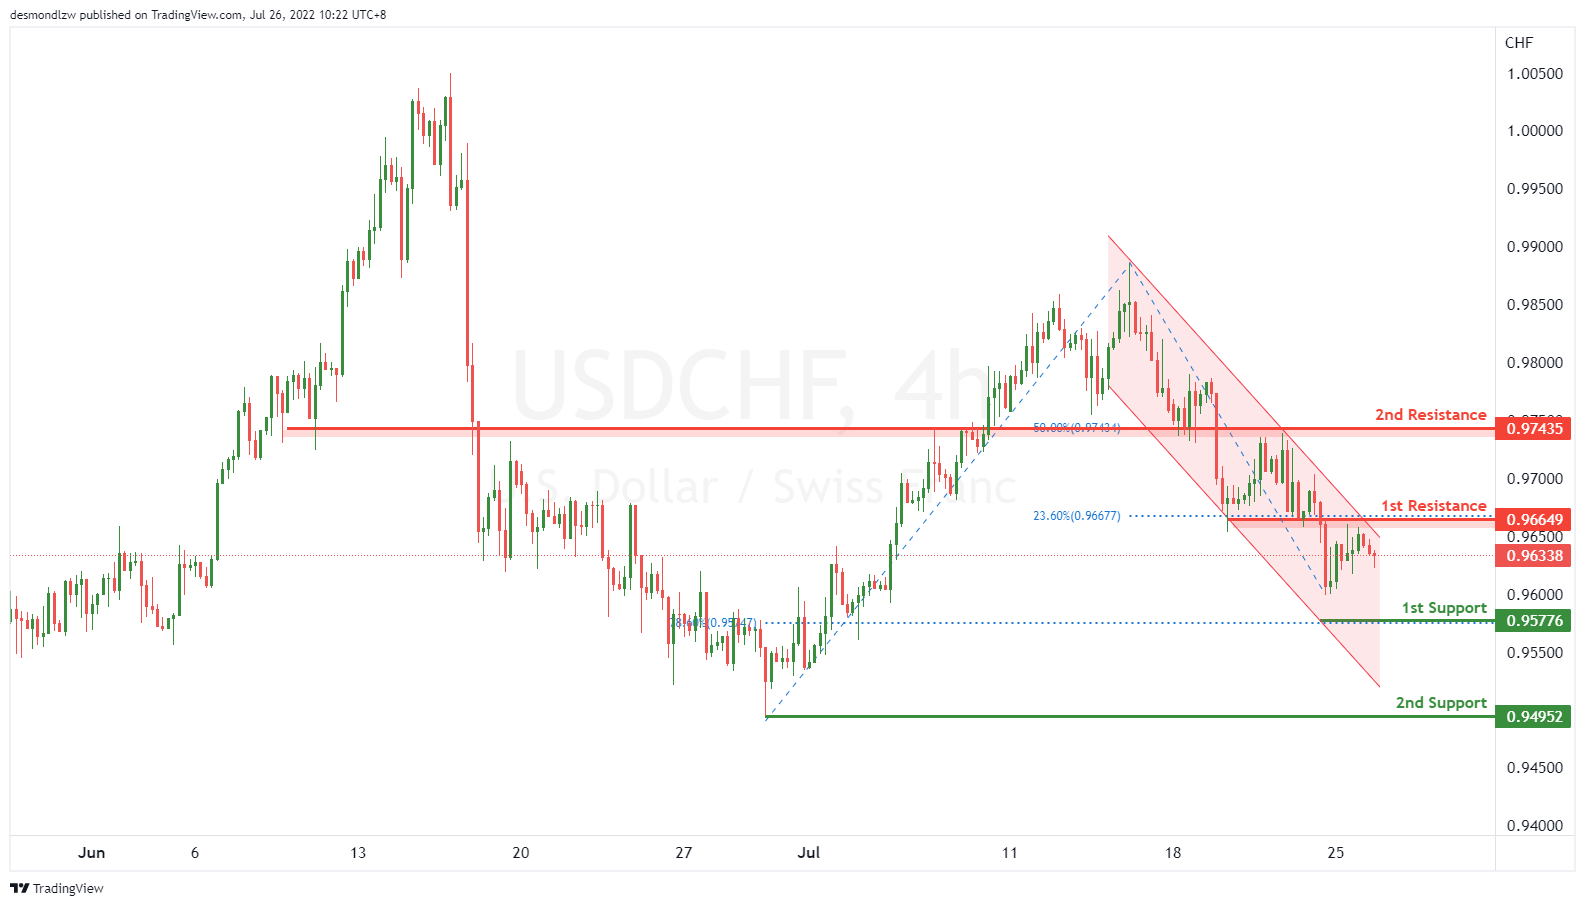
USD/CHF:
On the H4, with price moving along the descending channel, we have a bearish bias that price might drop from our 1st resistance at 0.96649, which is in line with overlap resistance to the 1st support at 0.95776, which is in line with 78.6% fibonacci retracement, if the price keep going down, it may drop to our 2nd support at 0.94952, which is in line with the swing low. Alternatively, price may break 1st resistance and head for 2nd resistance at 0.97435 where the 50% fibonacci retracement is.
Areas of consideration
- 1st resistance level at 0.96649
- 1st support level at 0.95776
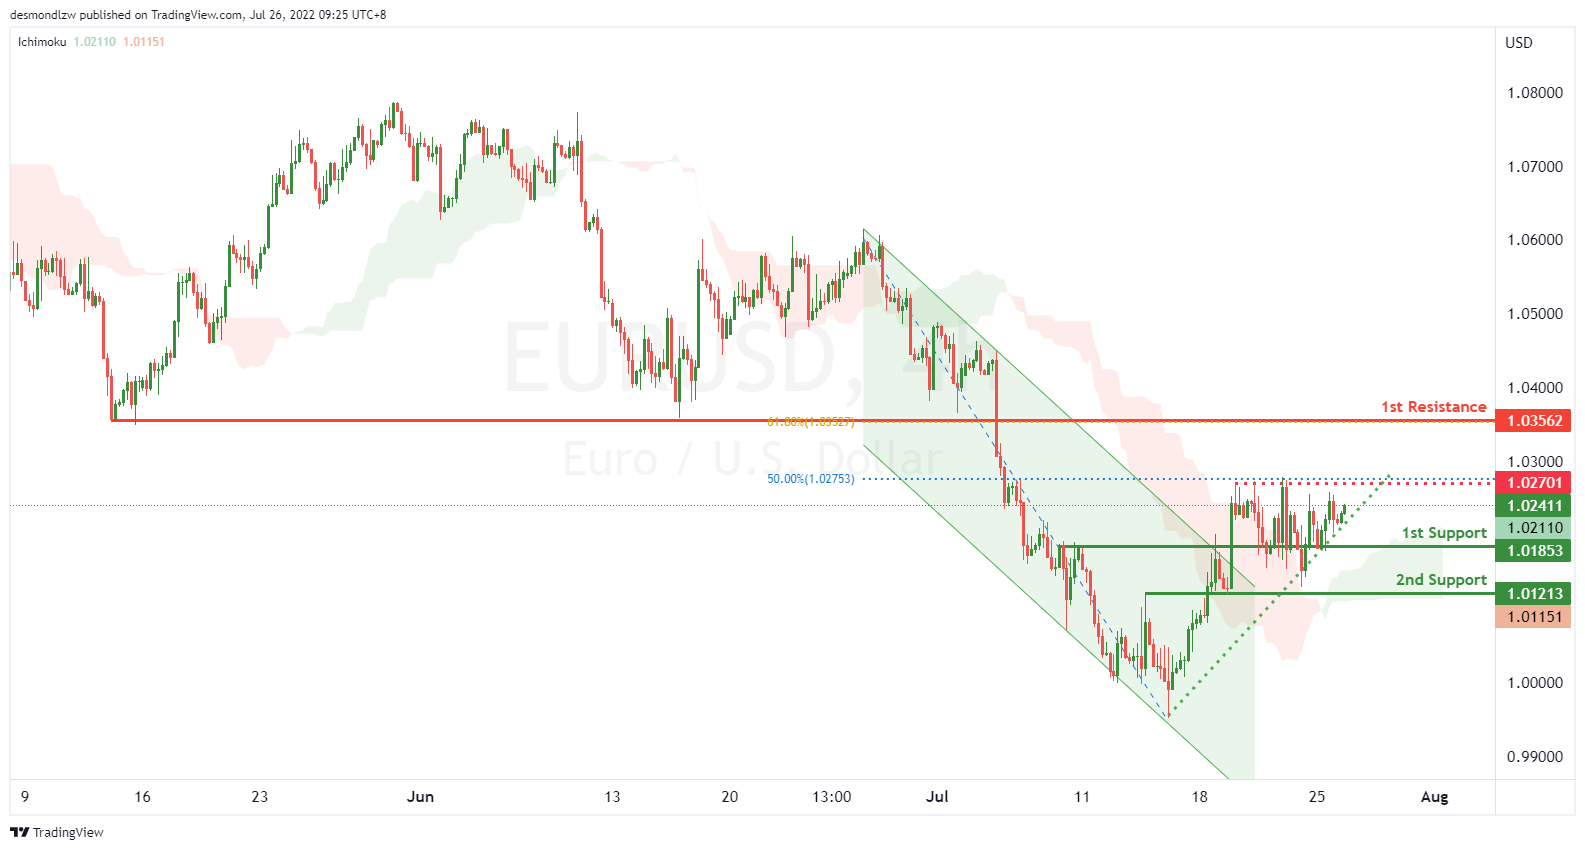
EUR/USD :
On the H4, with price moving above the ichimoku cloud and breaking out of the descending trend channel, we have a bullish bias that price will continue to rise from the 1st support at 1.01904 at the overlap support. If price breaks above the intermediary resistance at 1.02698 in line with the 50% fibonacci retracement, we have upside confirmation that price will continue to rise to the 1st resistance at 1.03570 at the pullback resistance in line with the 61.8% fibonacci retracement. Alternatively, price may break the support structure at the 1st support and drop to the 2nd support at 1.01213 at the overlap support.
Areas of consideration :
- H4 1st resistance at 1.03570
- H4 1st support at 1.01904
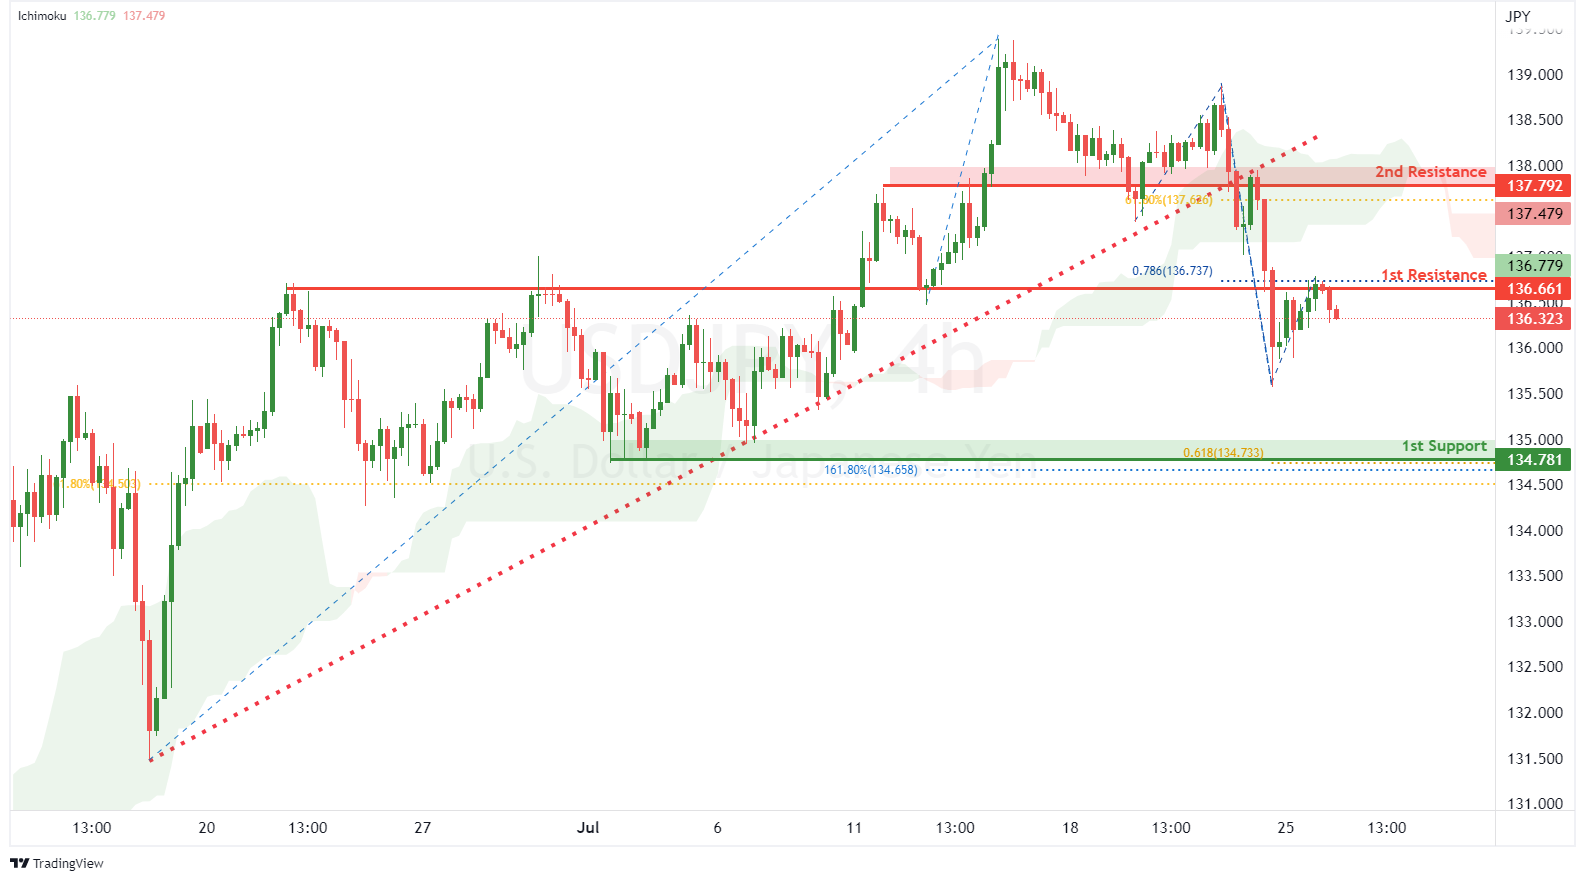
USD/JPY:
On the H4, with price broken out of the ascending trendline and moving below the ichimoku indicator, we have a bearish bias that price will rise and drop from our 1st resistance at 136.661 where the overlap resistance and 78.6% fibonacci projection are to the 1st support at 134.781 where the swing low support, 61.8% fibonacci projection, 161.8% fibonacci extension and 61.8% fibonacci retracement are. Alternatively, price could break 1st resistance structure and head for 2nd resistance at 137.792 where the pullback resistance and 61.8% fibonacci retracement are.
Areas of consideration:
- H4 time frame, 1st resistance at 136.661
- H4 time frame, 1st support at 134.781
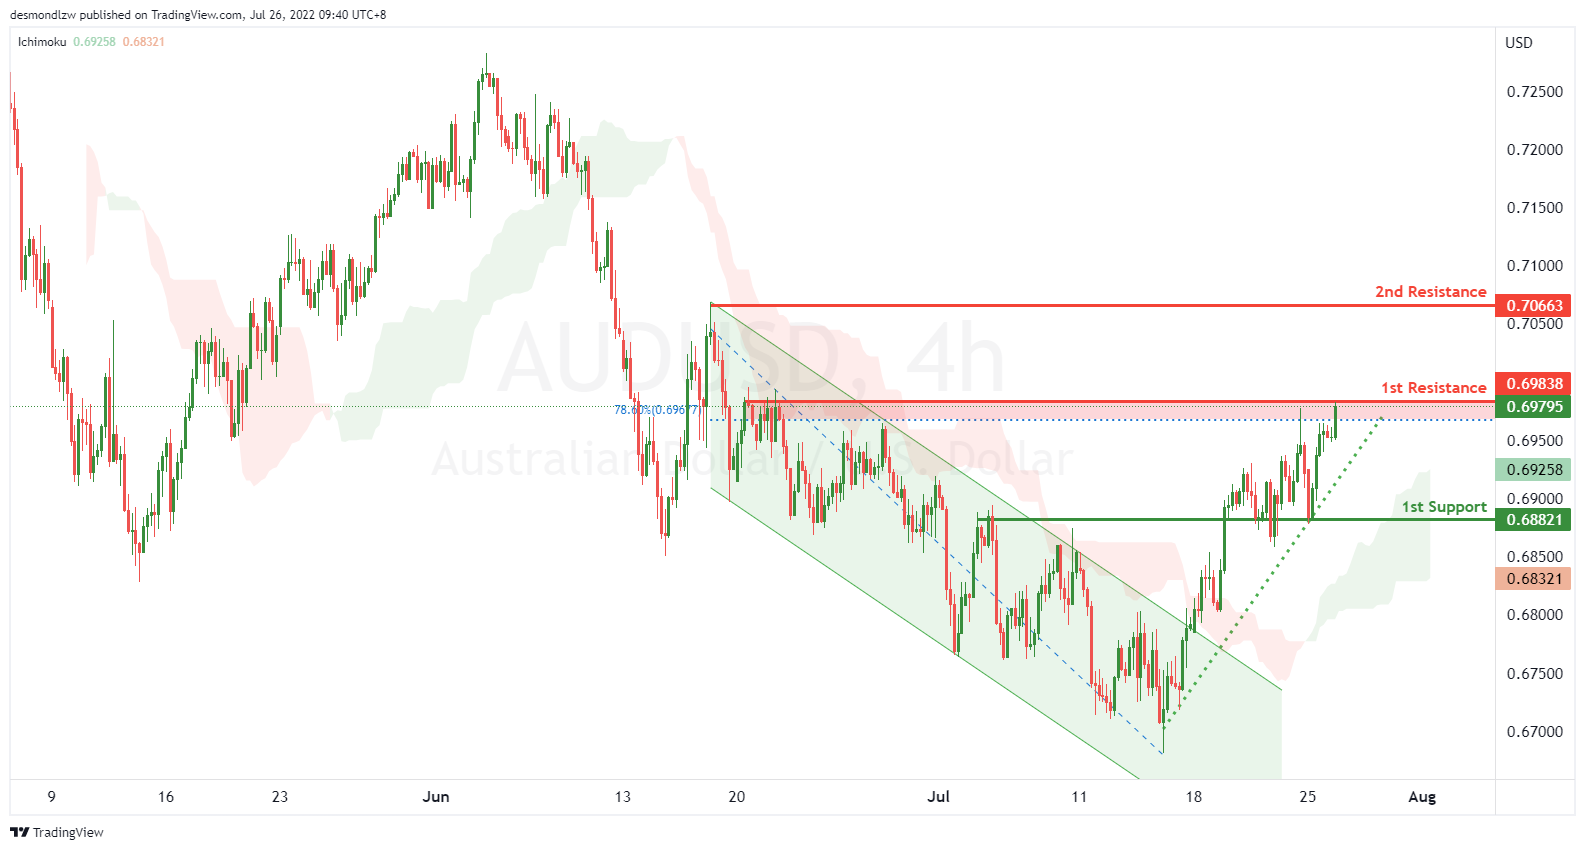
AUD/USD:
On the H4, with price moving above the ichimoku cloud and breaking out of the descending trend channel and moving in an ascending support, we have a bullish bias that price will rise from the 1st resistance at 0.69838 at the overlap resistance in line with the 78.6% fibonacci retracement to the 2nd resistance at 0.70663 at the swing high. Alternatively, price may reverse off 1st resistance and drop to the 1st support at 0.68021 at the overlap support.
Areas of consideration
- H4 1st resistance at 0.69838
- H4 1st support at 0.68021
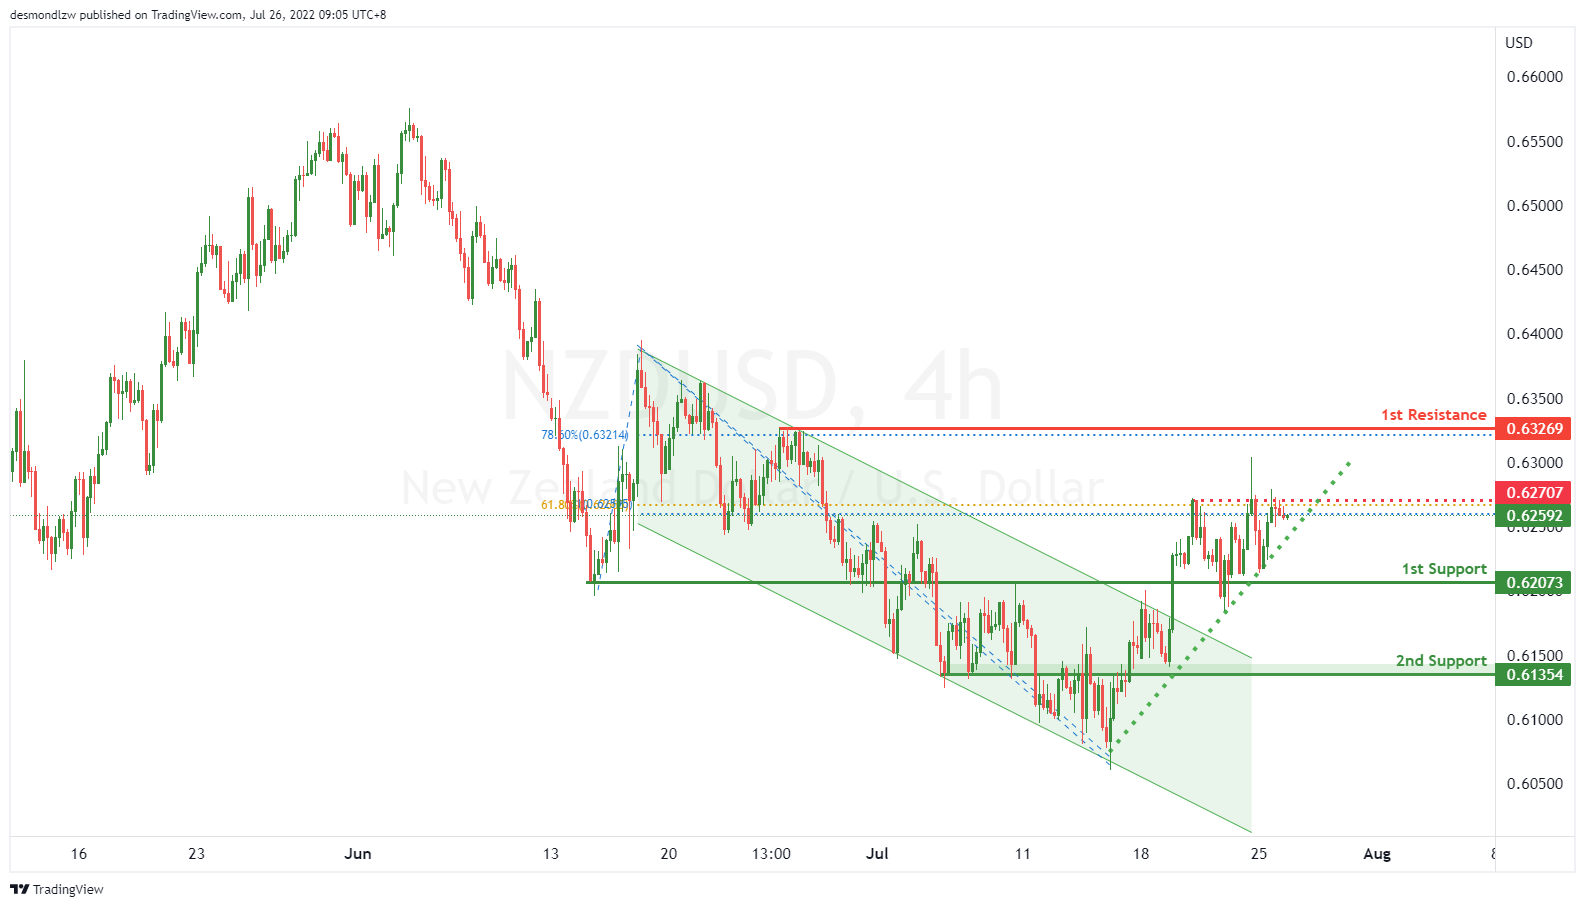
NZD/USD:
On the H4, with price breaking the descending trend channel, short term ascending support and moving above the ichimoku cloud, we have a bullish bias that price will rise from the 1st support at 0.62177 at the overlap support. If price breaks the intermediary resistance at 0.62707 at the swing high in line with the 61.8% fibonacci retracement and 100% fibonacci projection, we will have upside confirmation that price will rise to the 1st resistance at 0.63269 at the swing high in line with the 78.6% fibonacci retracement. Alternatively, price may break the support structure at the 1st support and drop to the 2nd support at 0.61419 at the pullback support.
Areas of consideration:
- H4 time frame, 1st support at 0.62177
- H4 time frame, 1st resistance at 0.63269
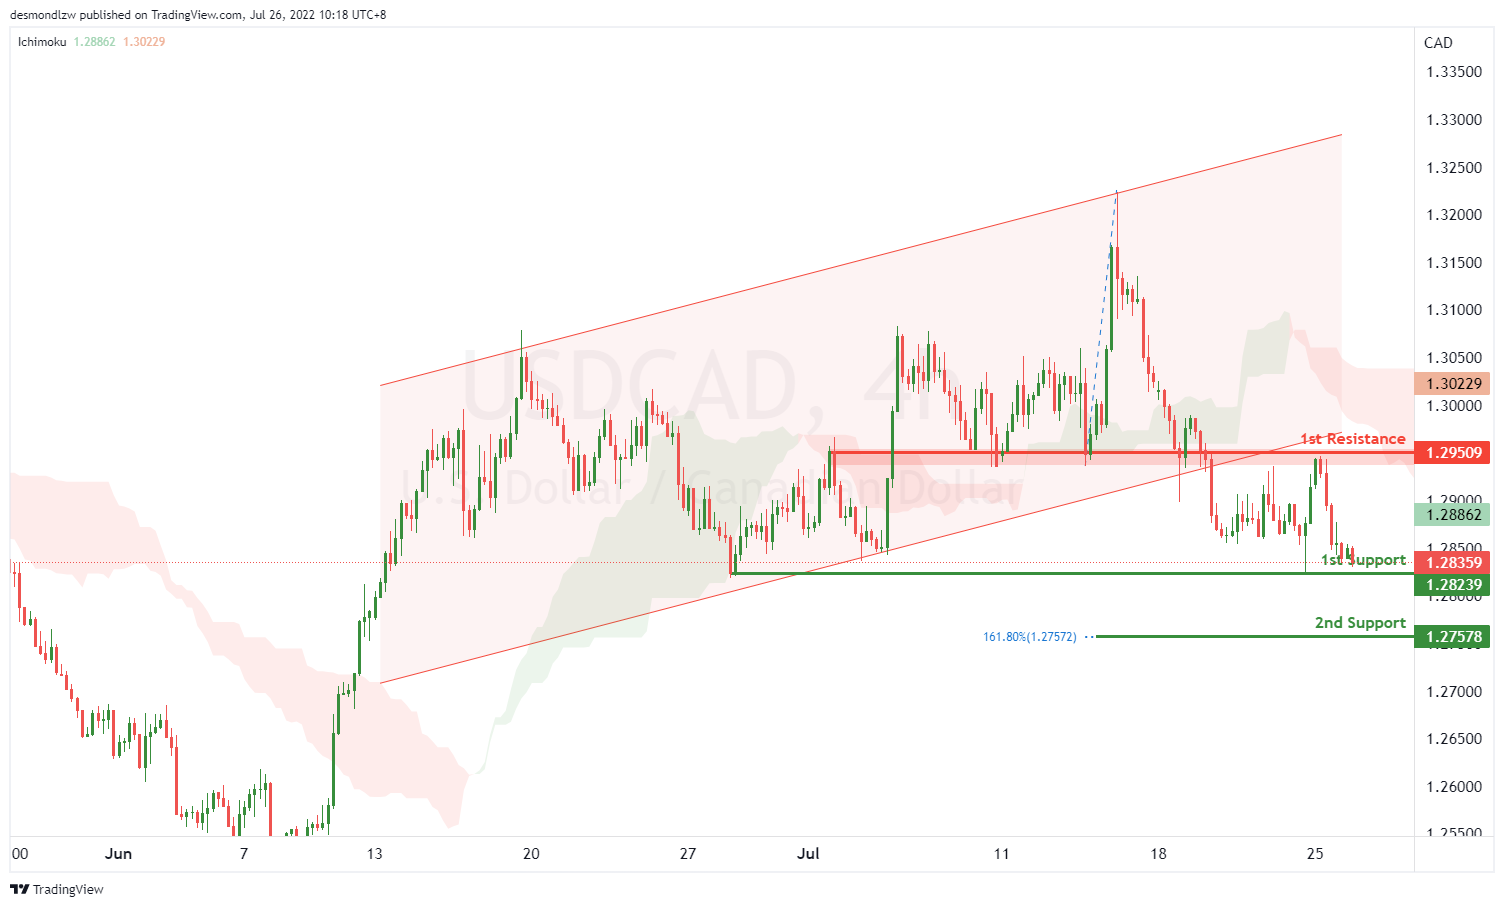
USD/CAD:
On the H4, with the price breaking the ascending channel, we have a bearish bias that the price may drop from our 1st support at 1.28239, which is in line with swing lows to our 2nd support at 1.27578, which is in line with the 161.8% fibonacci extension. Alternatively, the price may rise to the 1st resistance at 1.29509, which is in line with the overlap resistance.
Areas of consideration:
- H4 time frame, 1st support at 1.28239
- H4 time frame, 2nd support at 1.27578
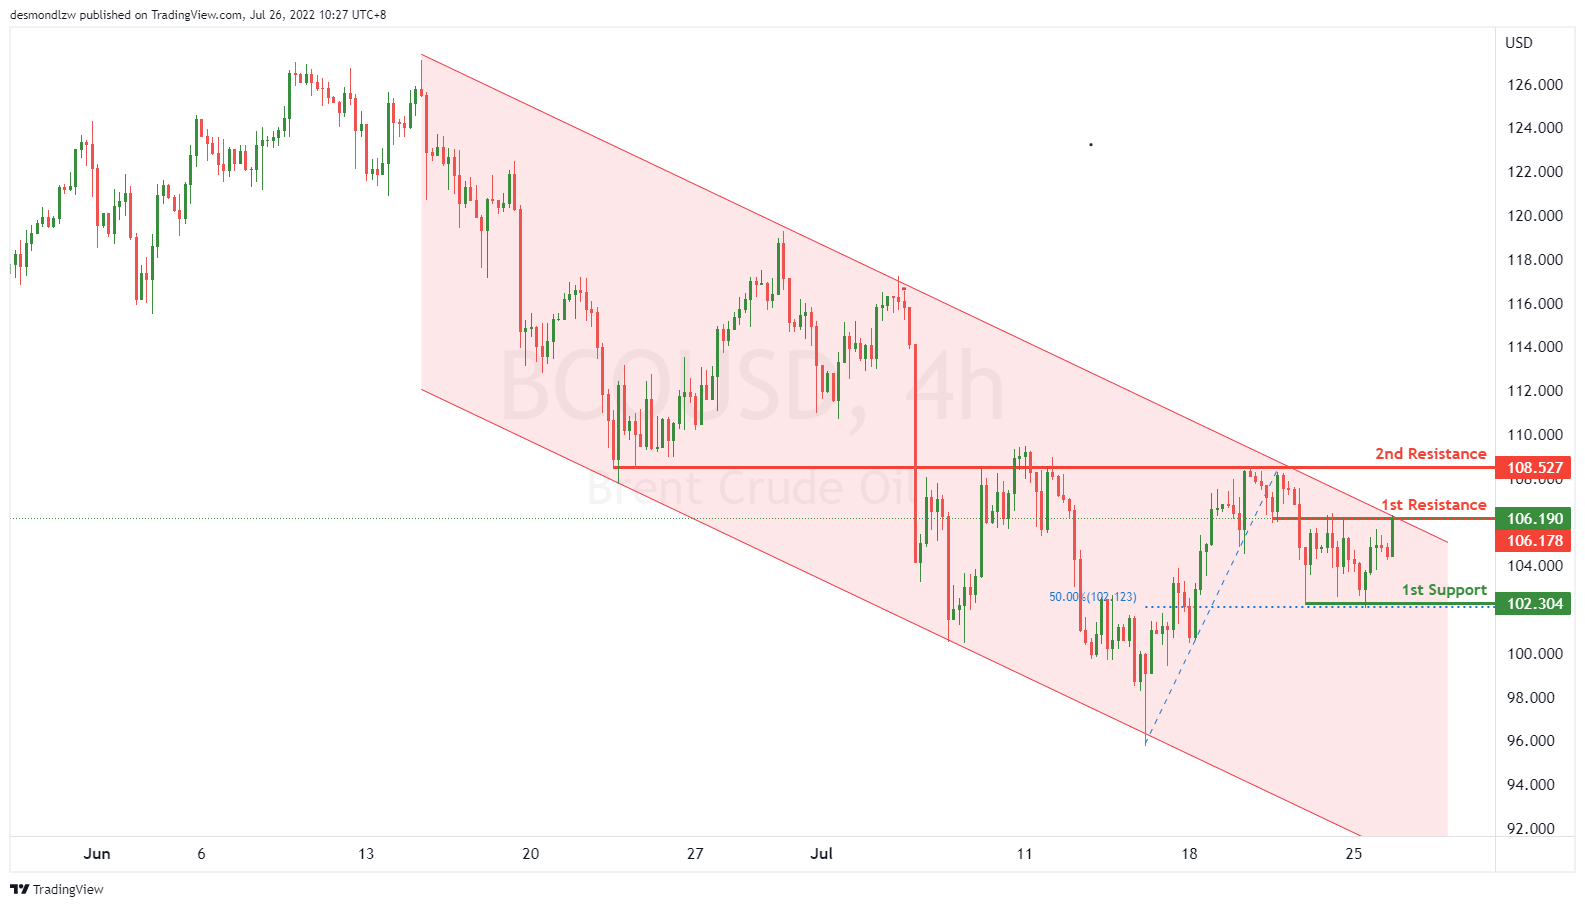
OIL:
On the H4, with price moving along the bearish channel, we have a bearish bias that price might drop from our 1st resistance at 106.178, which is in line with the close swing high price to our 1st support at 102.304, which is in line with 50% fibonacci retracement. Alternatively, as the price is almost at the upper bound of the channel, the price may rise to 2nd resistance at 108.527, which is in line with overlap resistance.
Areas of consideration:
- H4 time frame, 1st support of 102.304
- H4 time frame, 2nd support of 108.527
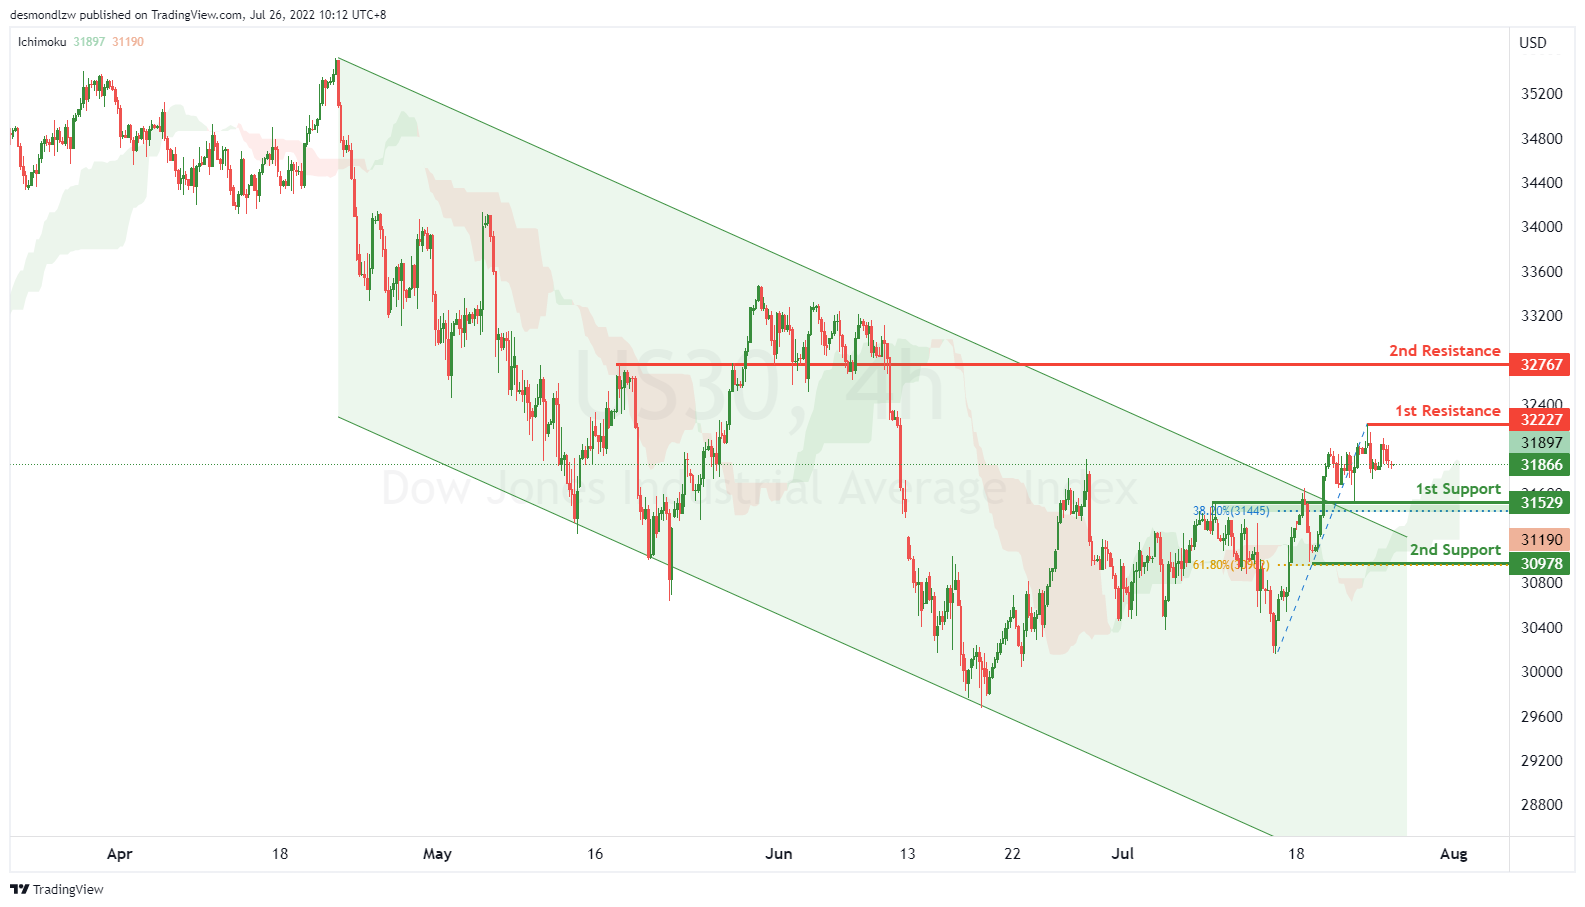
Dow Jones Industrial Average:
On the H4, with price moving with a bearish channel and having a bullish break, we have a bullish bias that price might rise from our 1st resistance at 32227, which is in line with the swing highs to our 2nd resistance at 32767, which is in line with overlap resistance. Alternatively, price may reverse off the 1st resistance and drop to the 1st support at 31529, which is in line with the overlap support and 38.2% fibonacci retracement, if the price keeps going down, it may drop to our 2nd support at 30978, which is in line with 61.8% fibonacci retracement.
Areas of consideration:
- H4 time frame, 1st resistance of 32227
- H4 time frame, 2nd resistance at 32767


