
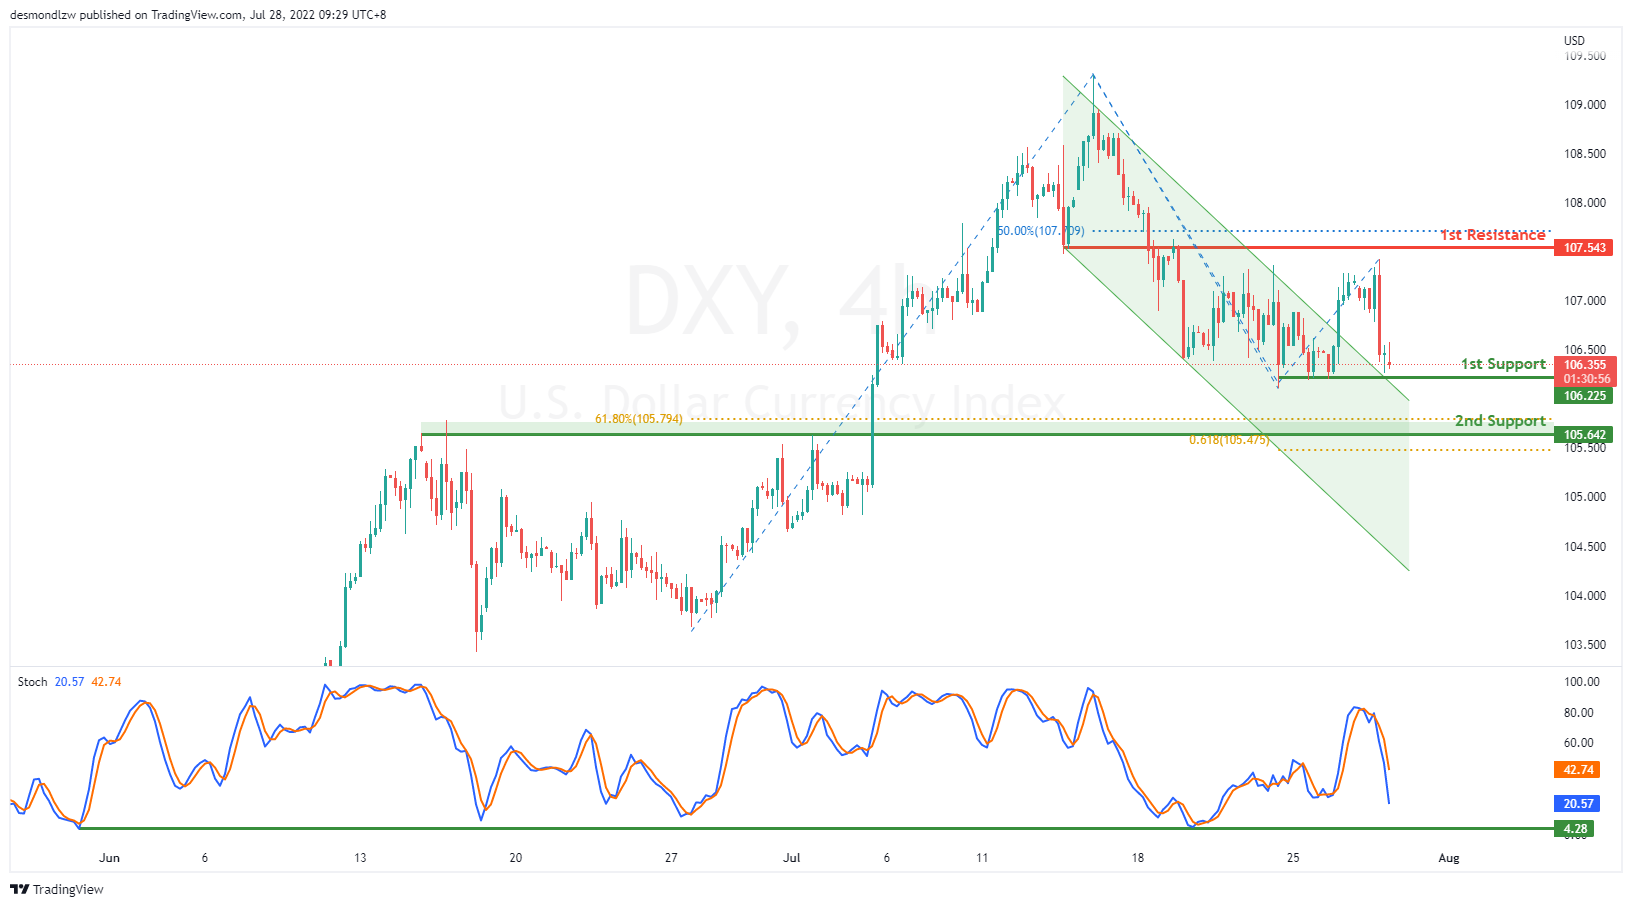
DXY:
On the H4, with prices breaking out of the descending channel and expected to bounce off the stochastic support, we have a bullish bias that prices will drop and rise from the 1st support at 106.225 where the swing low support is to the 1st resistance at 107.543 where the pullback resistance and 50% fibonacci retracement are. Alternatively, price could break 1st support structure and head to 2nd support at 105.642 where the overlap support, 61.8% fibonacci retracement and 61.8% fibonacci projection are.
Areas of consideration:
- H4 time frame, 1st resistance at 107.543
- H4 time frame, 1st support at 106.225
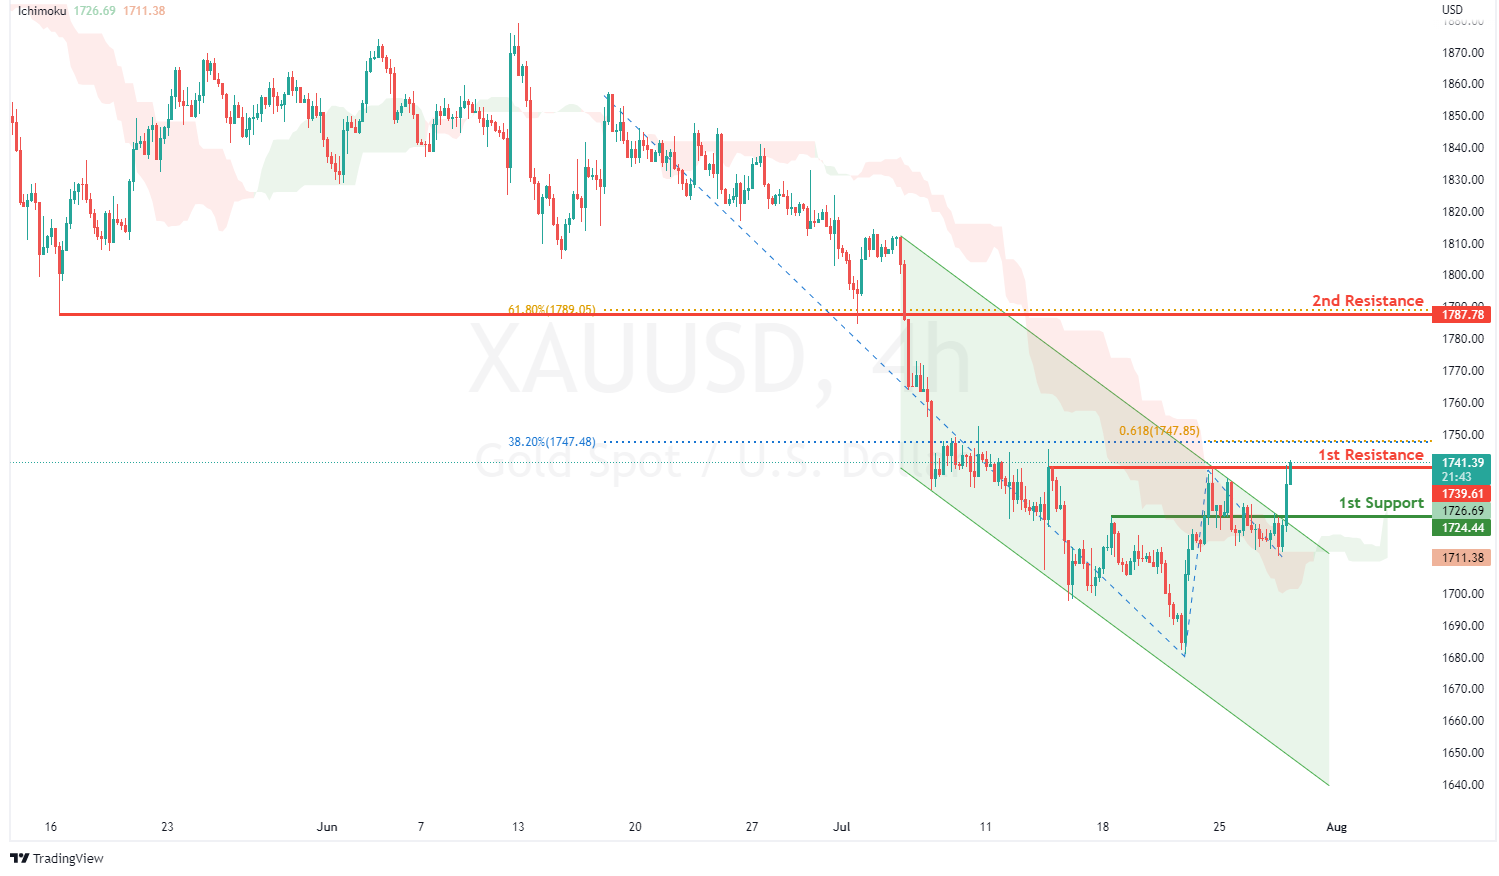
XAU/USD (GOLD):
On the H4, with prices breaking out of a descending channel and moving above the ichimoku indicator, we have a bullish bias that price will rise to the 1st resistance at 1739.61 where the swing high resistance, 38.2% fibonacci retracement and 61.8% fibonacci projection are. Once there is upside confirmation of price breaking 1st resistance structure, we would expect bullish momentum to carry price to 2nd resistance at 1787.78 in line with pullback resistance and 61.8% fibonacci retracement. Alternatively, prices could drop to 1st support at 1724.44 where the pullback support is.
Areas of consideration:
- H4 time frame, 1st Resistance at 1739.61
- H4 time frame, 1st Support at 1724.44
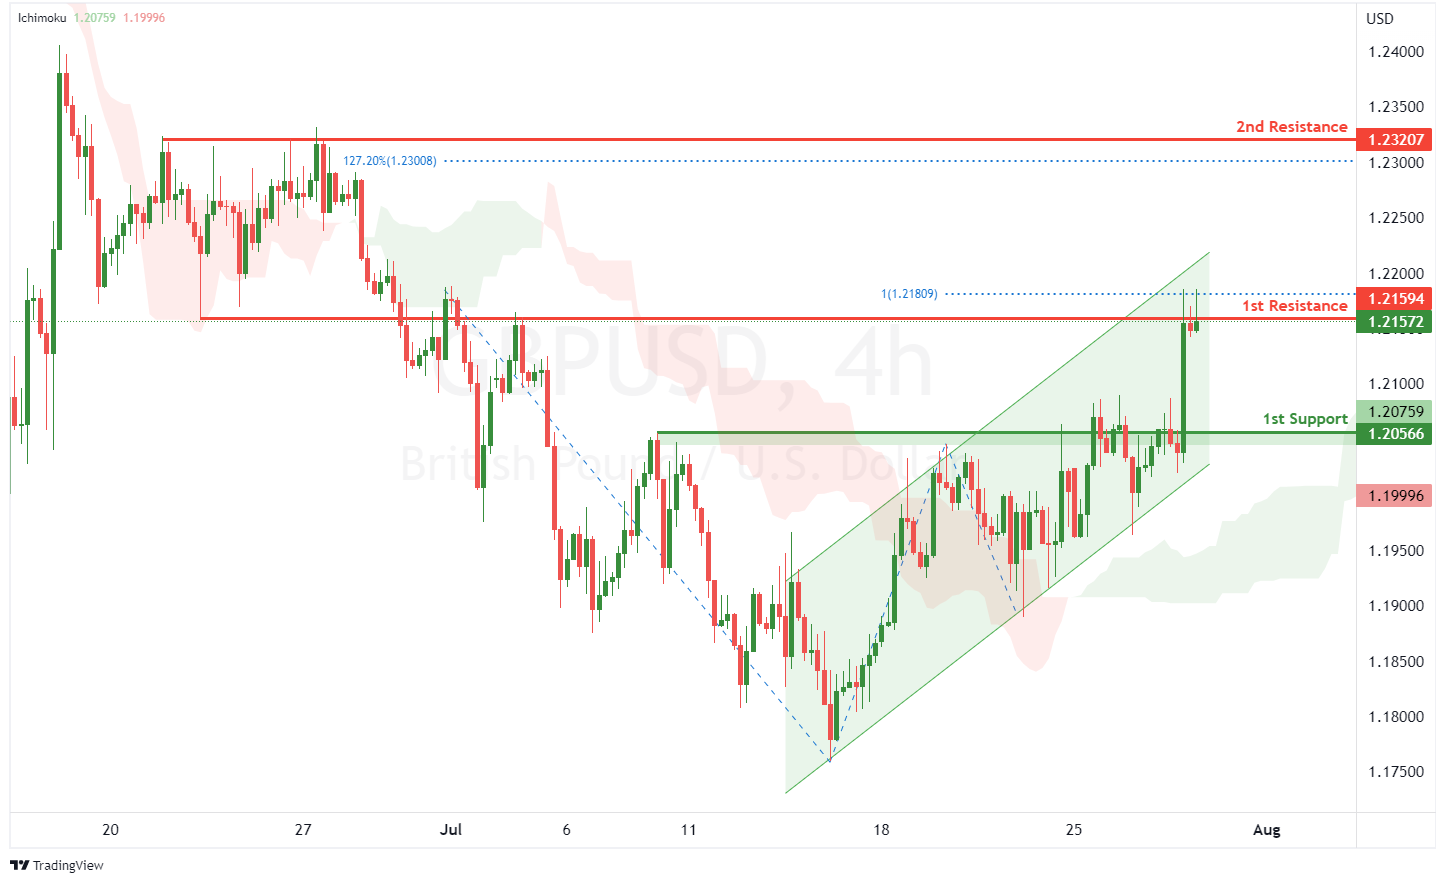
GBP/USD:
On the H4, with prices moving within an ascending channel and above the ichimoku indicator, we have a bullish bias that price will rise to the 1st resistance at 1.21594 where the pullback resistance and 100% fibonacci projection are. Once there is upside confirmation of price breaking 1st resistance, we would expect bullish momentum to carry price to 2nd resistance at 1.23207 where the swing high resistance and 127.2% fibonacci extension are. Alternatively, price could drop to 1st support at 1.20566 where the pullback support is.
Areas of consideration:
- H4 1st resistance at 1.21594
- H4 1st support at 1.20566
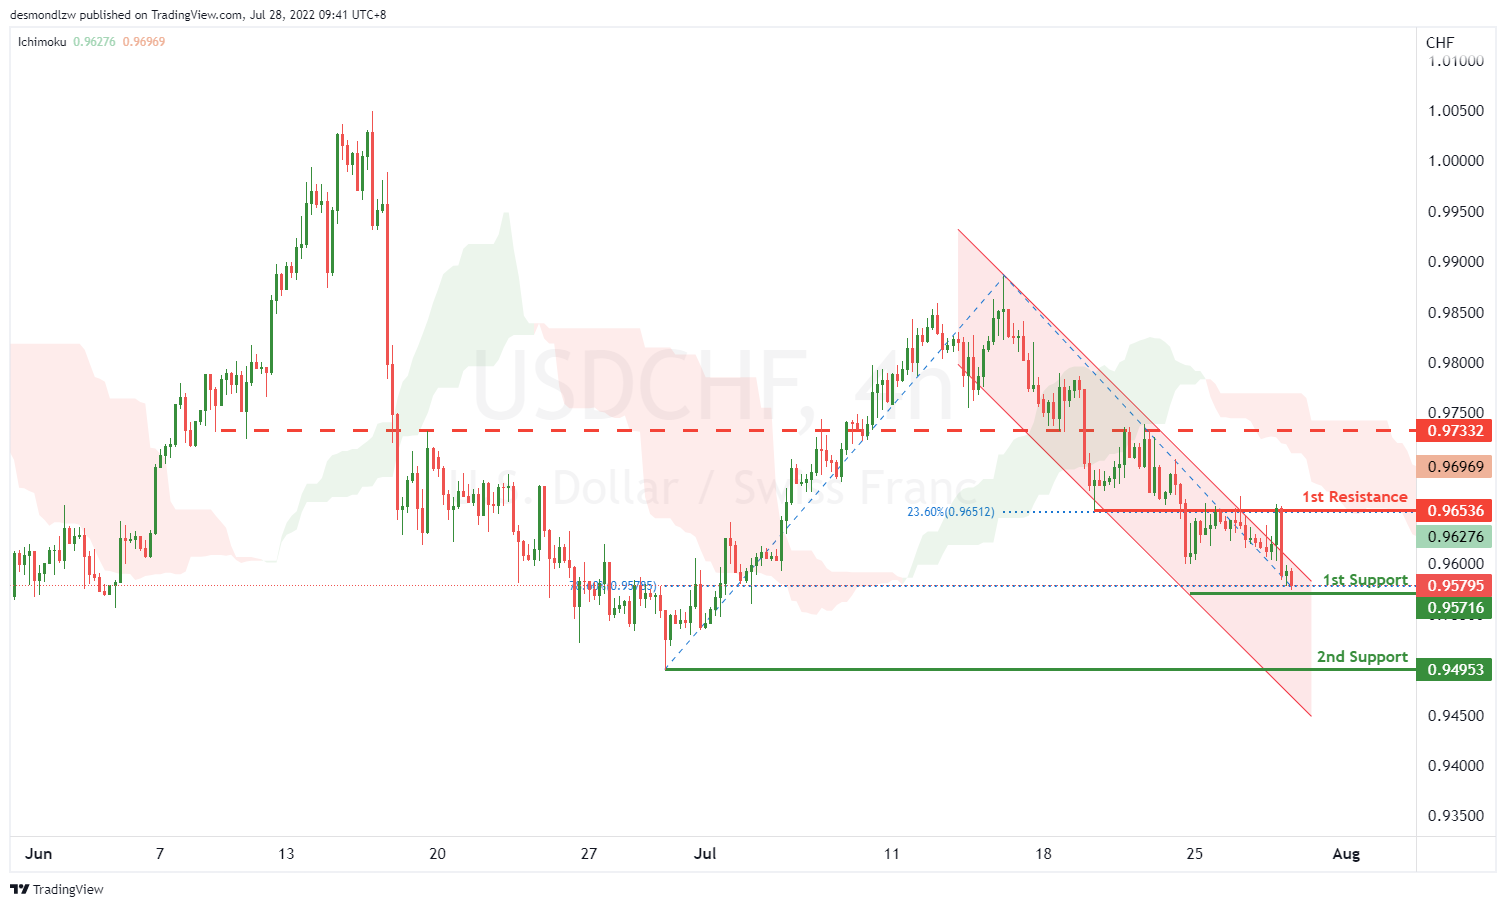
USD/CHF:
On the H4, with price moving along the descending channel, we have a bearish bias that price might drop from our 1st support at 0.95716, which is in line with 78.6% fibonacci retracement to the the 2nd support at 0.94953, which is in line with the swing low. Alternatively, price may bounce off from the 1st support and head for 1st resistance at 0.96536 where the 23.6% fibonacci retracement is. Take note the price of 0.97332 could be the 2nd resistance.
Areas of consideration
- 1st support level at 0.95716
- 2nd support level at 0.94953
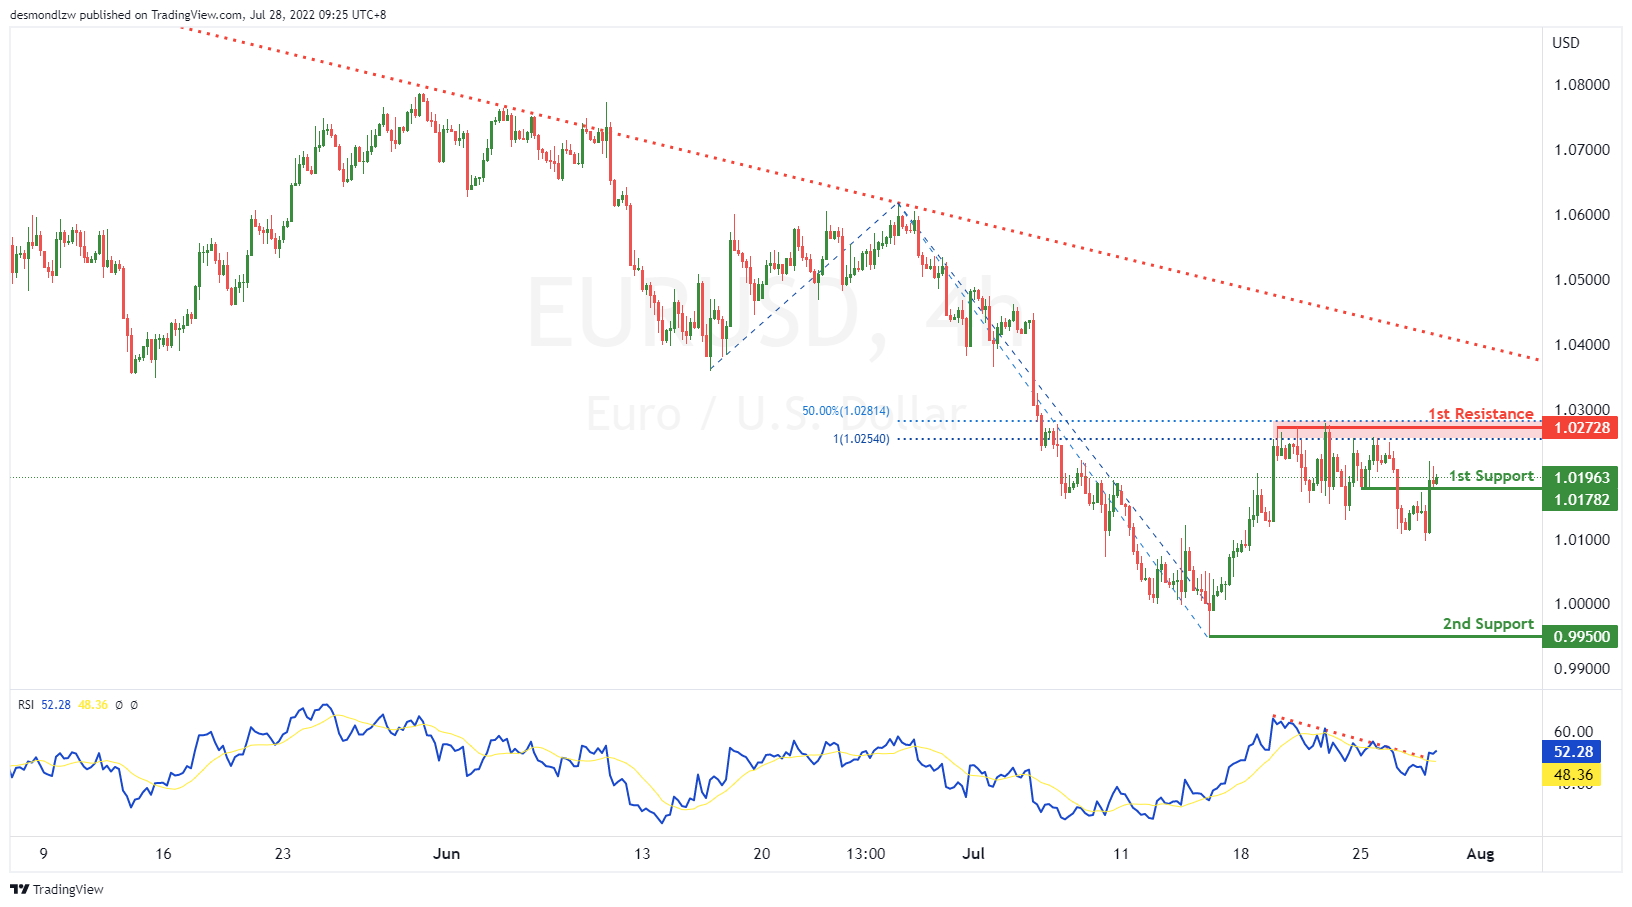
EUR/USD :
On the H4, with price bouncing off the ichimoku cloud and breaking out of the descending trend channel, we have a bullish bias that price will rise from the 1st support at 1.01782 at the pullback support to the 1st resistance at 1.02025 at the swing high in line with the 50% fibonacci retracement and 100% fibonacci projection . Alternatively, price may reverse off the 1st support and drop to the 2nd support at 1.01112 at the overlap support and swing low.
Areas of consideration :
- H4 1st resistance at 1.02025
- H4 1st support at 1.01782
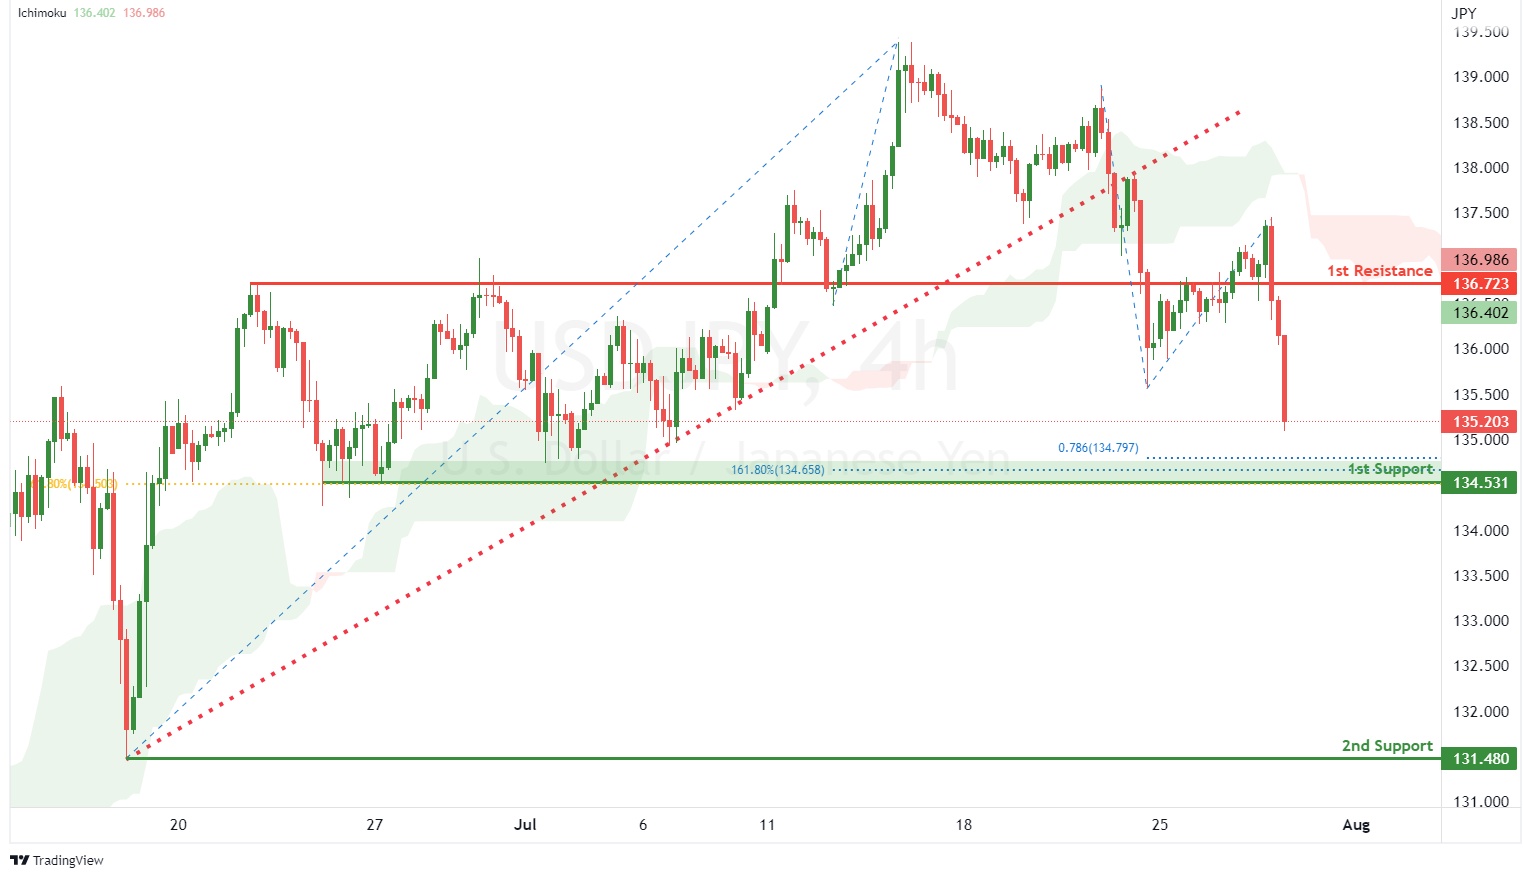
USD/JPY:
On the H4, with price broken out of the ascending trendline and moving below the ichimoku indicator, we have a bearish bias that price will drop to our 1st support at 134.531 where the swing low support, 61.8% fibonacci retracement, 78.6% fibonacci projection and 161.8% fibonacci extension are. Once there is downside confirmation of price breaking 1st support, we would expect bearish momentum to carry price to the 2nd support at 131.480 where the swing low support is. Alternatively, price could head for 1st resistance at 136.723 where the overlap resistance is.
Areas of consideration:
- H4 time frame, 1st resistance at 136.723
- H4 time frame, 1st support at 134.531
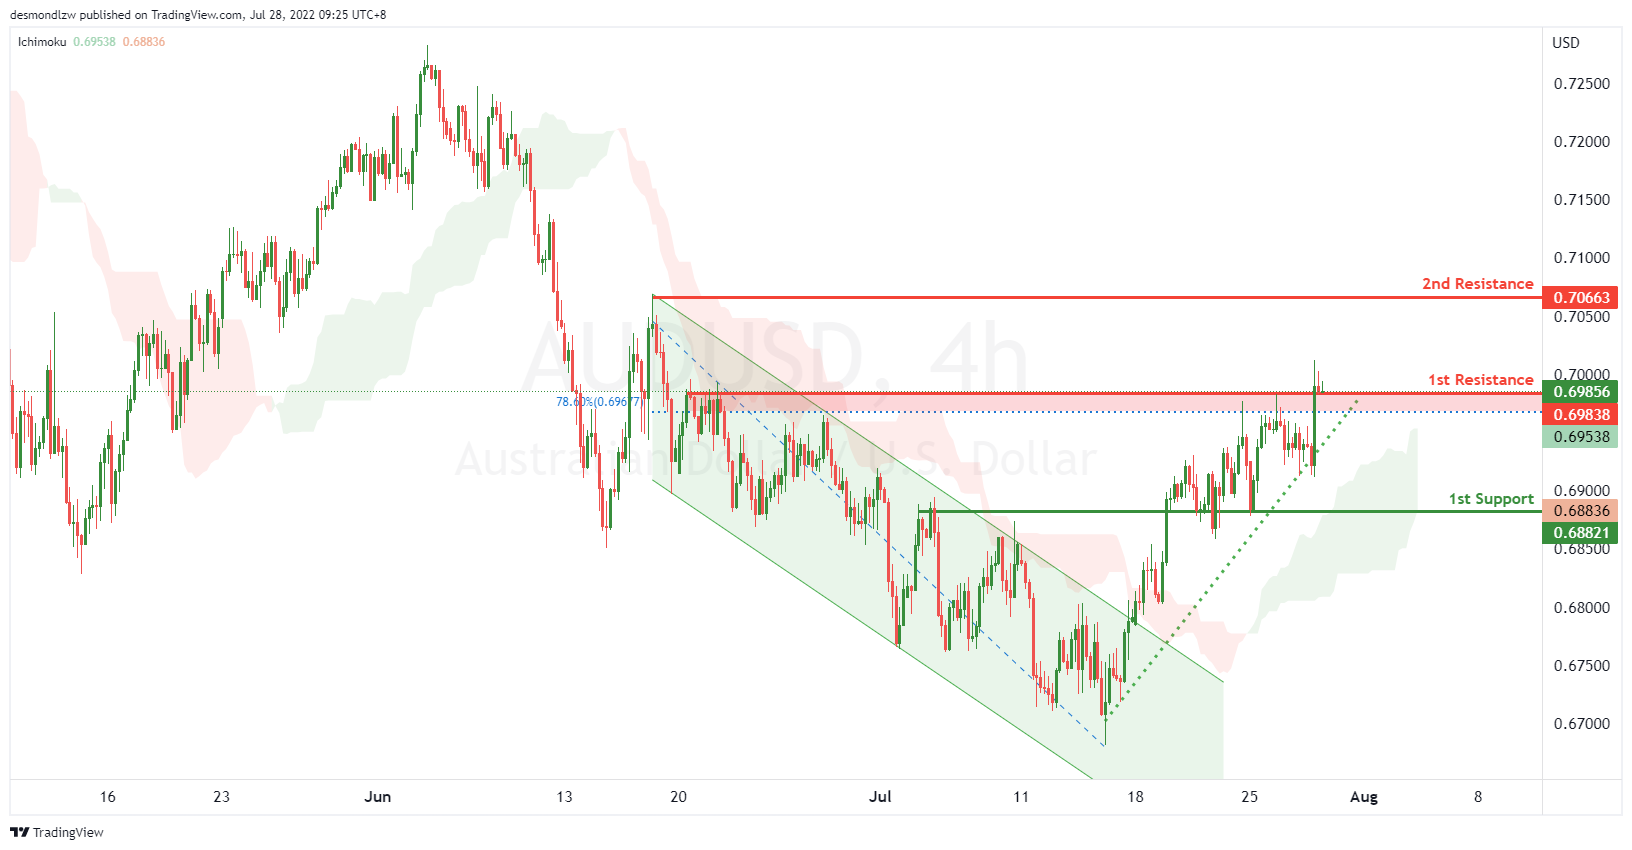
AUD/USD:
On the H4, with price moving above the ichimoku cloud and breaking out of the descending trend channel and moving in an ascending support, we have a bullish bias that price will rise from the 1st resistance at 0.69838 at the overlap resistance in line with the 78.6% fibonacci retracement to the 2nd resistance at 0.70663 at the swing high. Alternatively, price may reverse off 1st resistance and drop to the 1st support at 0.68021 at the overlap support.
Areas of consideration
- H4 1st resistance at 0.69838
- H4 1st support at 0.68021
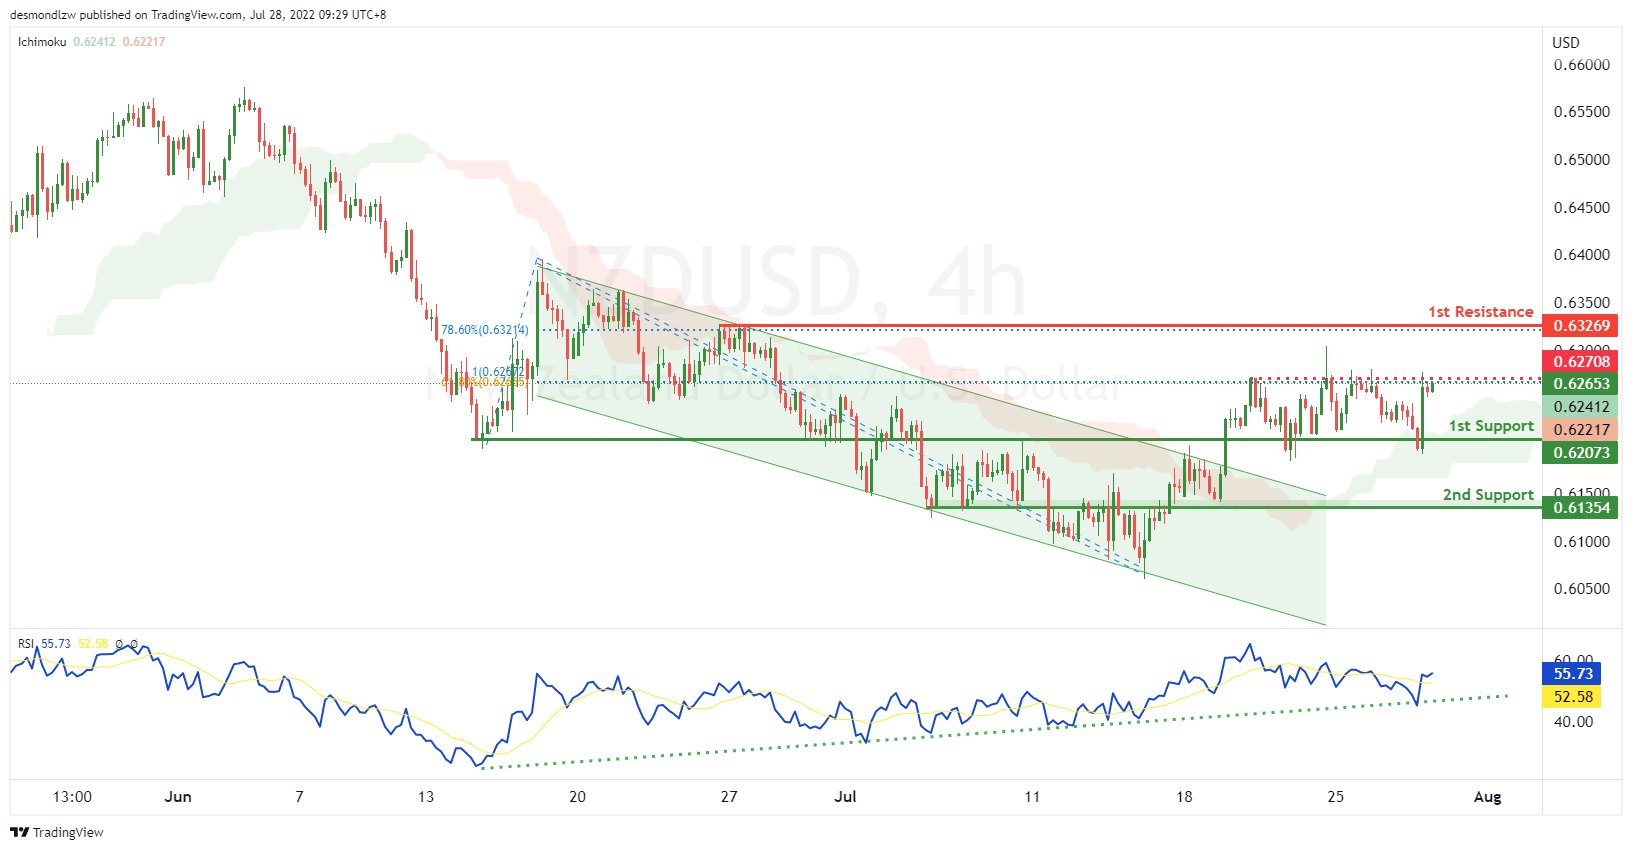
NZD/USD:
On the H4, with price breaking the descending trend channel, RSI showing an ascending trendline and moving above the ichimoku cloud, we have a bullish bias that price will rise from the 1st support at 0.62073 at the overlap support. If price breaks the intermediary resistance at 0.62708 at the swing high in line with the 61.8% fibonacci retracement and 100% fibonacci projection, we will have upside confirmation that price will rise to the 1st resistance at 0.63269 at the swing high in line with the 78.6% fibonacci retracement. Alternatively, price may break the support structure at the 1st support and drop to the 2nd support at 0.61354 at the pullback support.
Areas of consideration:
- H4 time frame, 1st support at 0.62073
- H4 time frame, 1st resistance at 0.63269
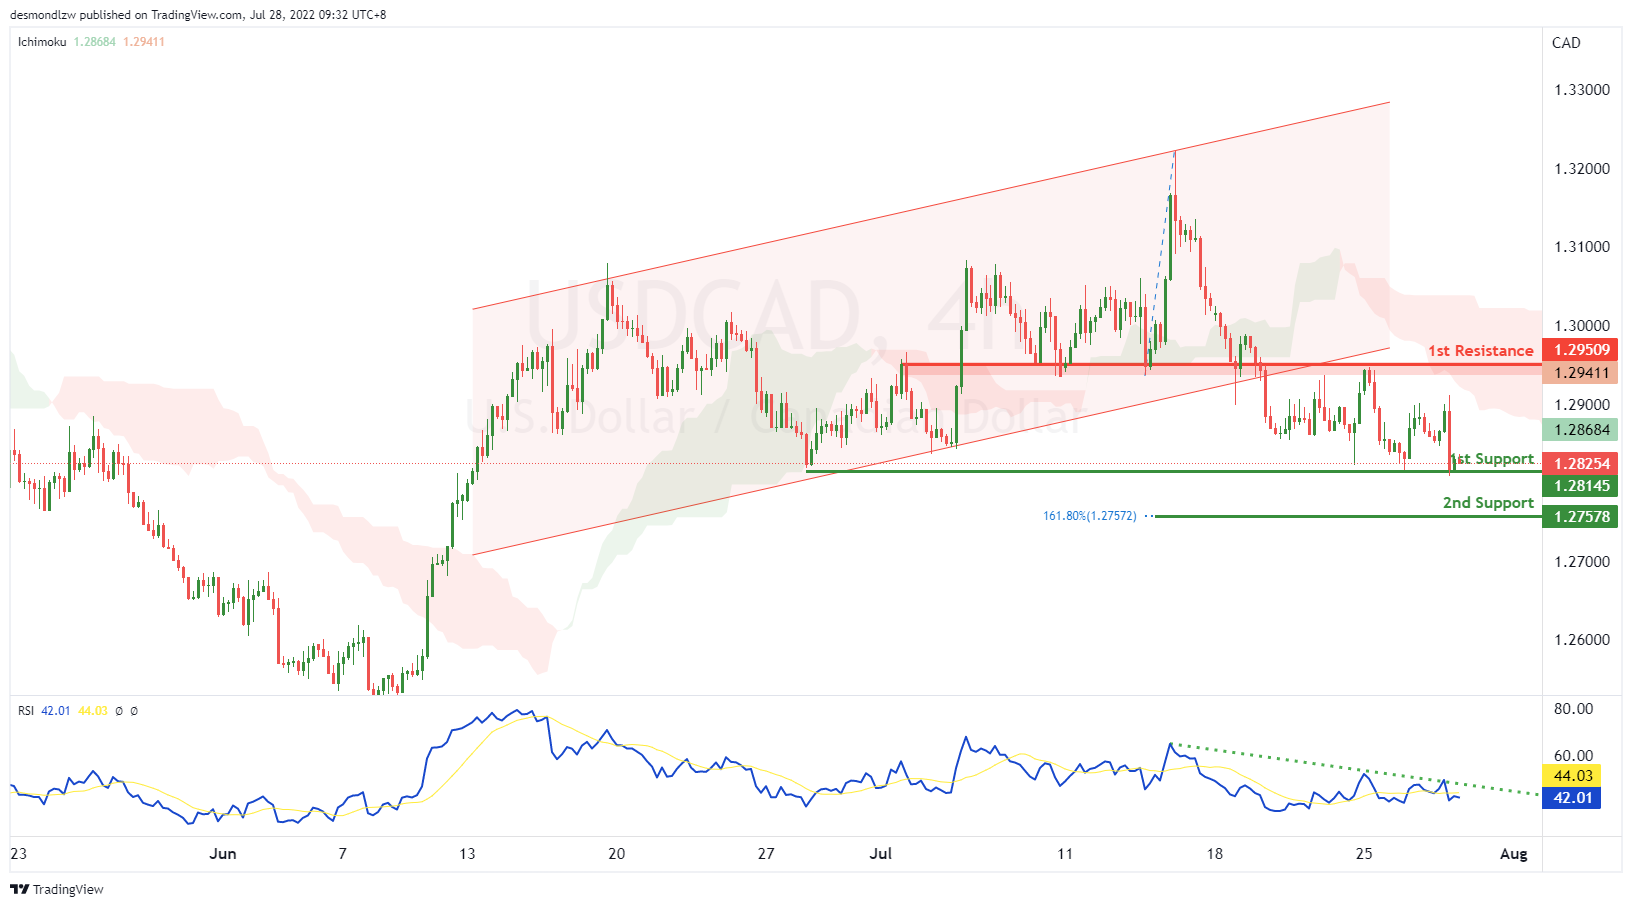
USD/CAD:
On the H4, with the price breaking the ascending channel, we have a bearish bias that the price may drop from our 1st support at 1.28145, which is in line with swing lows to our 2nd support at 1.27578, which is in line with the 161.8% fibonacci extension. Alternatively, the price may rise to the 1st resistance at 1.29509, which is in line with the overlap resistance.
Areas of consideration:
- H4 time frame, 1st support at 1.28145
- H4 time frame, 2nd support at 1.27578
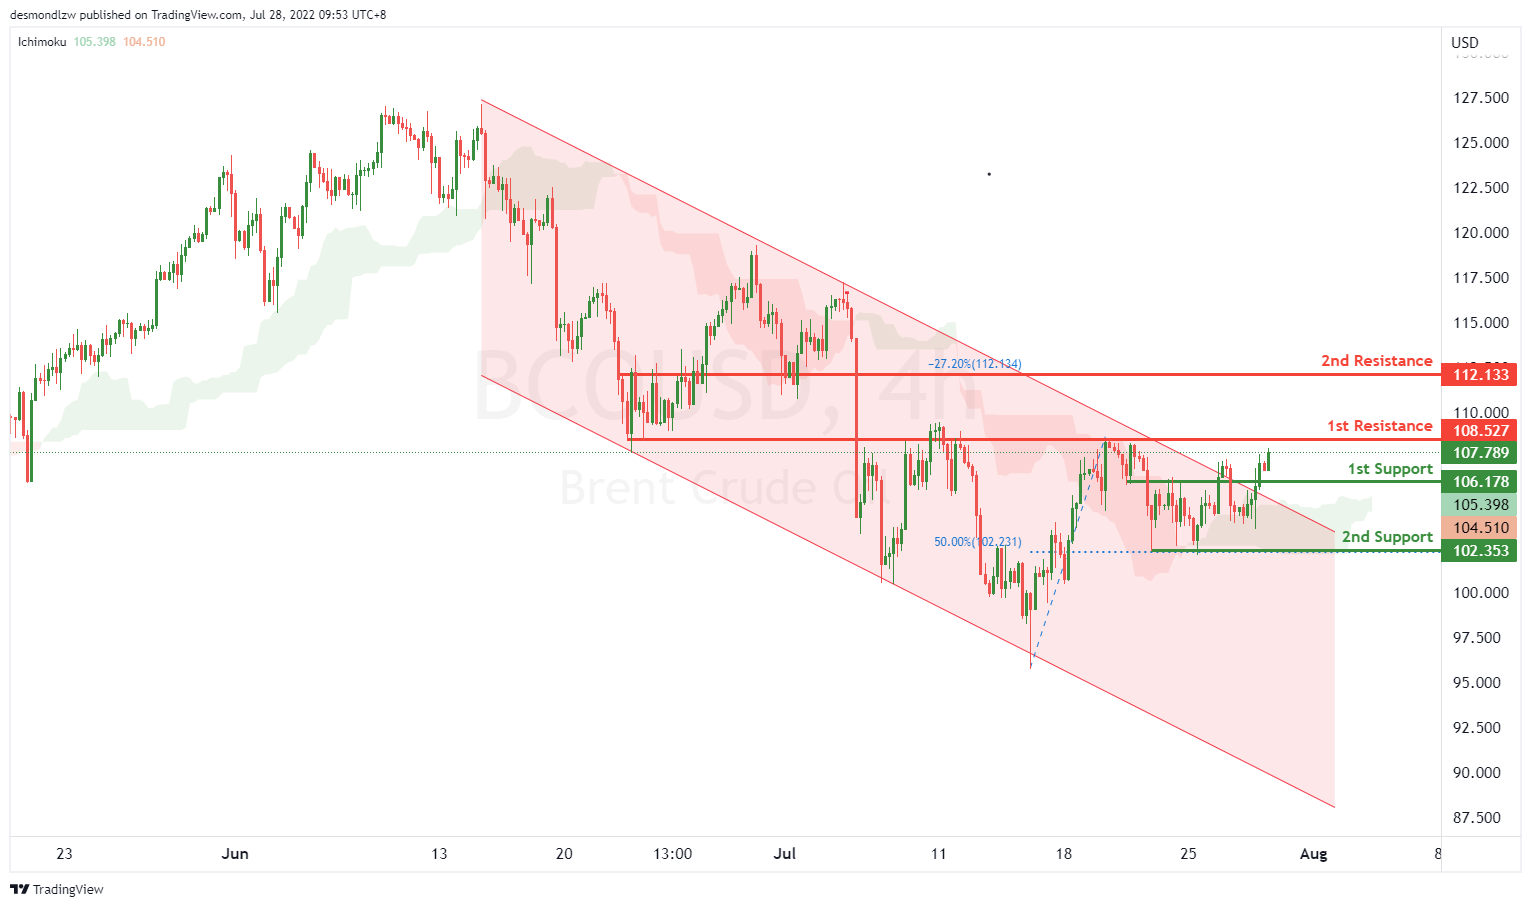
OIL:
On the H4, with price breaking the bearish channel and moving above ichimoku indicator, we have a bearish bias that price might rise from our 1st resistance at 108.527, which is in line with the overlap resistance to our 2nd resistance at 112.133, which is in line with -27.2% fibonacci expansion. Alternatively, the price may drop to 1st support at 102.353, which is in line with pullback resistance and 50% fibonacci retracement.
Areas of consideration:
- H4 time frame, 1st resistance of 108.527
- H4 time frame, 2nd resistance of 112.133
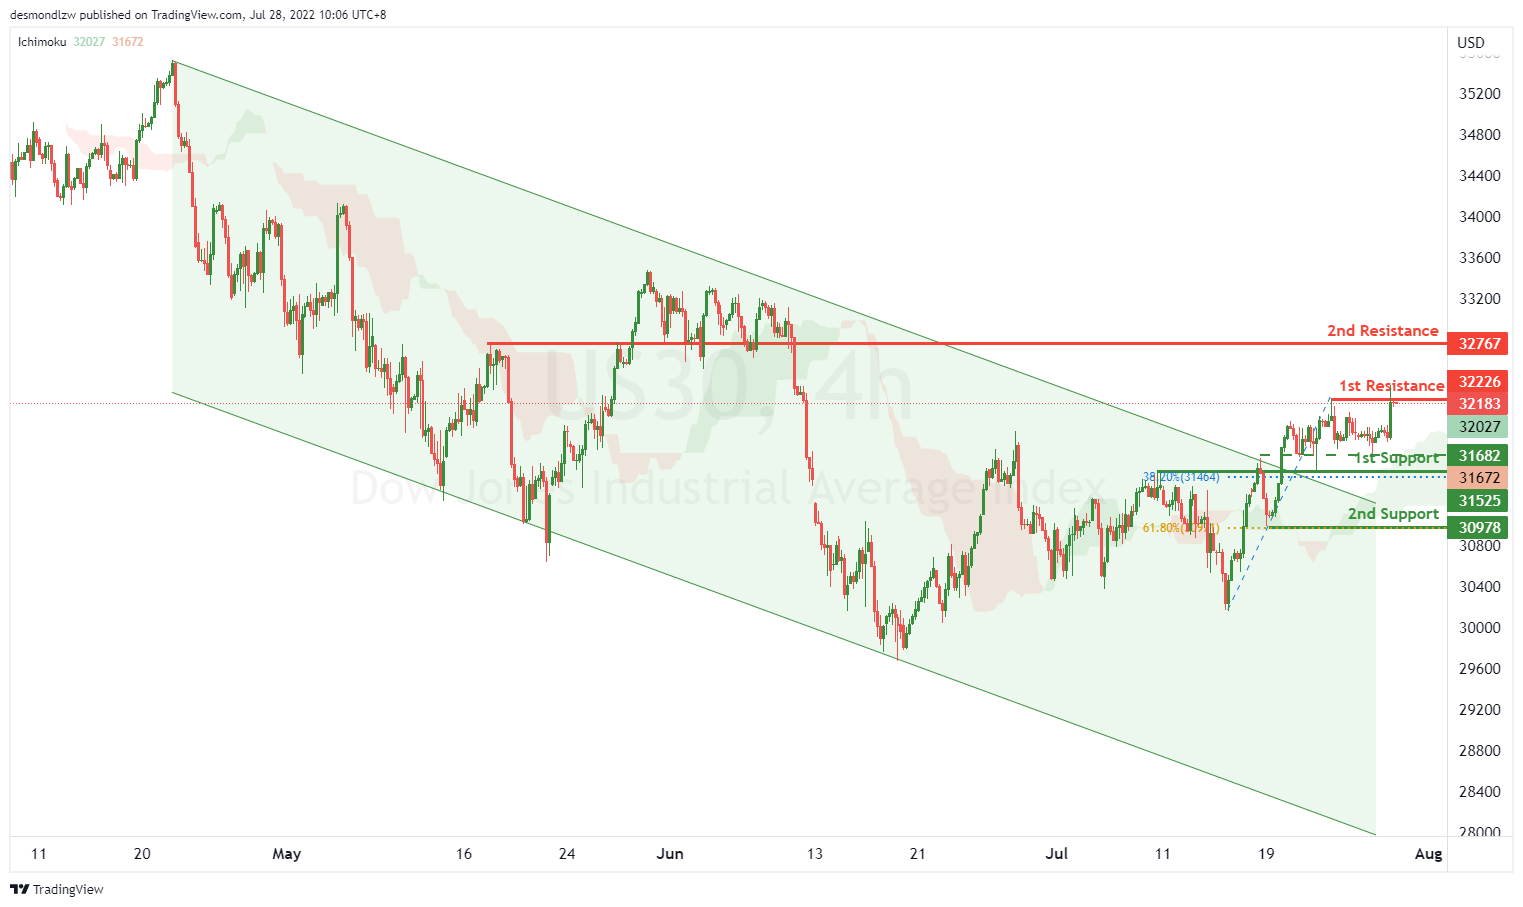
Dow Jones Industrial Average:
On the H4, with price moving with a bearish channel and having a bullish break, we have a bullish bias that price might rise from our 1st resistance at 32226, which is in line with the swing highs to our 2nd resistance at 32767, which is in line with overlap resistance. Alternatively, price may reverse off the 1st resistance and drop to the 1st support at 31525, which is in line with the overlap support and 38.2% fibonacci retracement, if the price keeps going down, it may drop to our 2nd support at 30978, which is in line with 61.8% fibonacci retracement. Take note the price is fluctuating currently and testing the support of 31682.
Areas of consideration:
- H4 time frame, 1st resistance of 32226
- H4 time frame, 2nd resistance at 32767


