
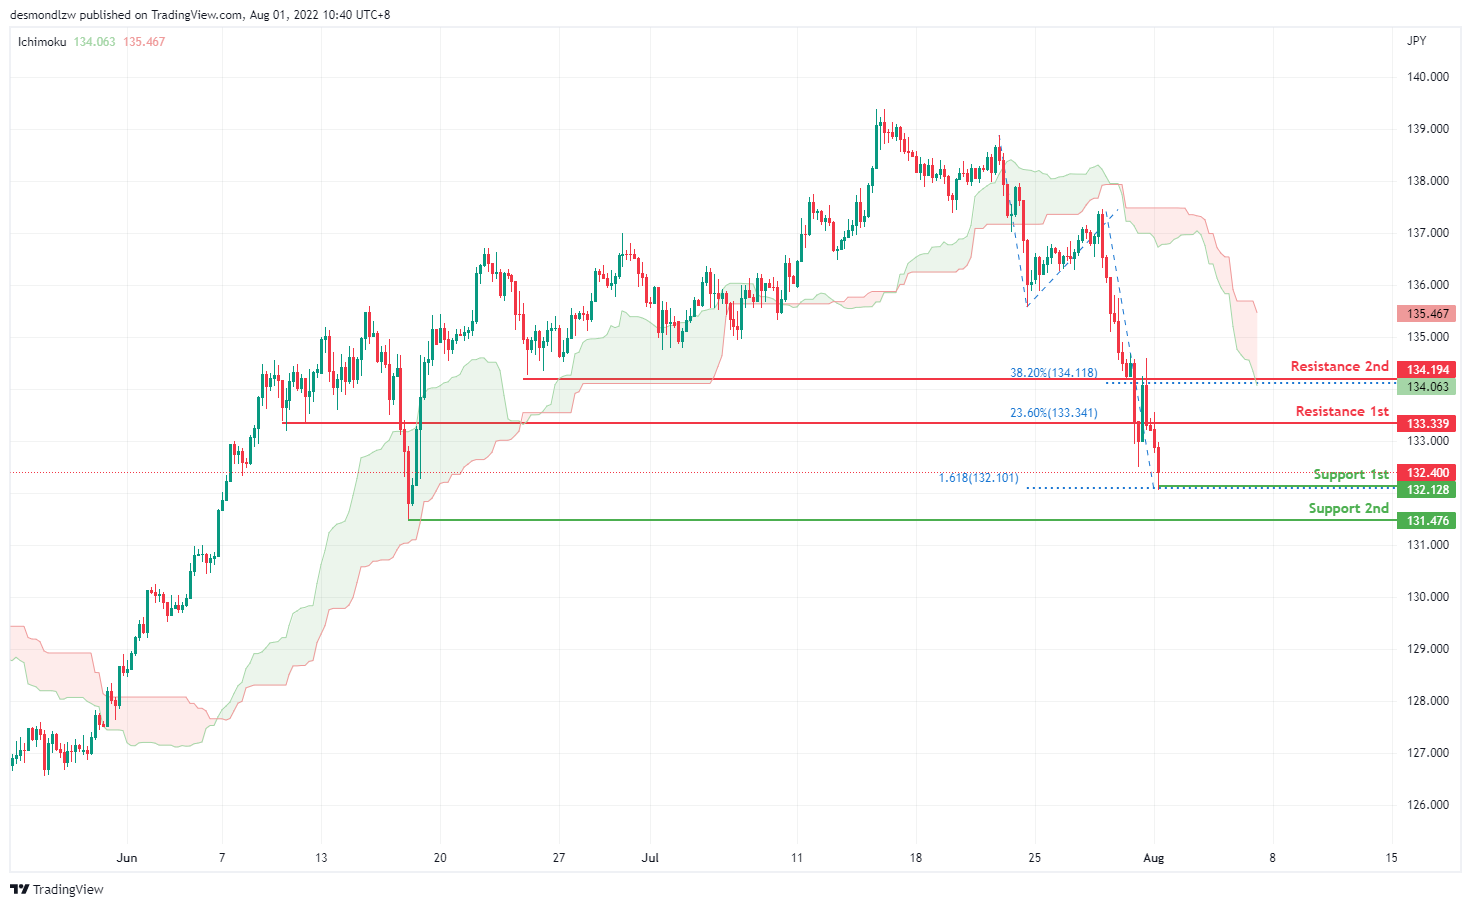
USD/JPY:
On the H4, with price broken out of the ascending trendline and moving below the Ichimoku indicator, we have a bearish bias that price will drop to our 1st support where 161.8 Fibonacci extension sits. The chart has confirmed a downside momentum and is now going to test the next key support level at 131.476. Alternatively, price could bounce back to test at its previous wing low at 133.339 which coincides with Fibonacci 23.6% retracement
Areas of consideration:
- H4 time frame, 1st resistance at 133.339
- H4 time frame, 1st support at 132.282
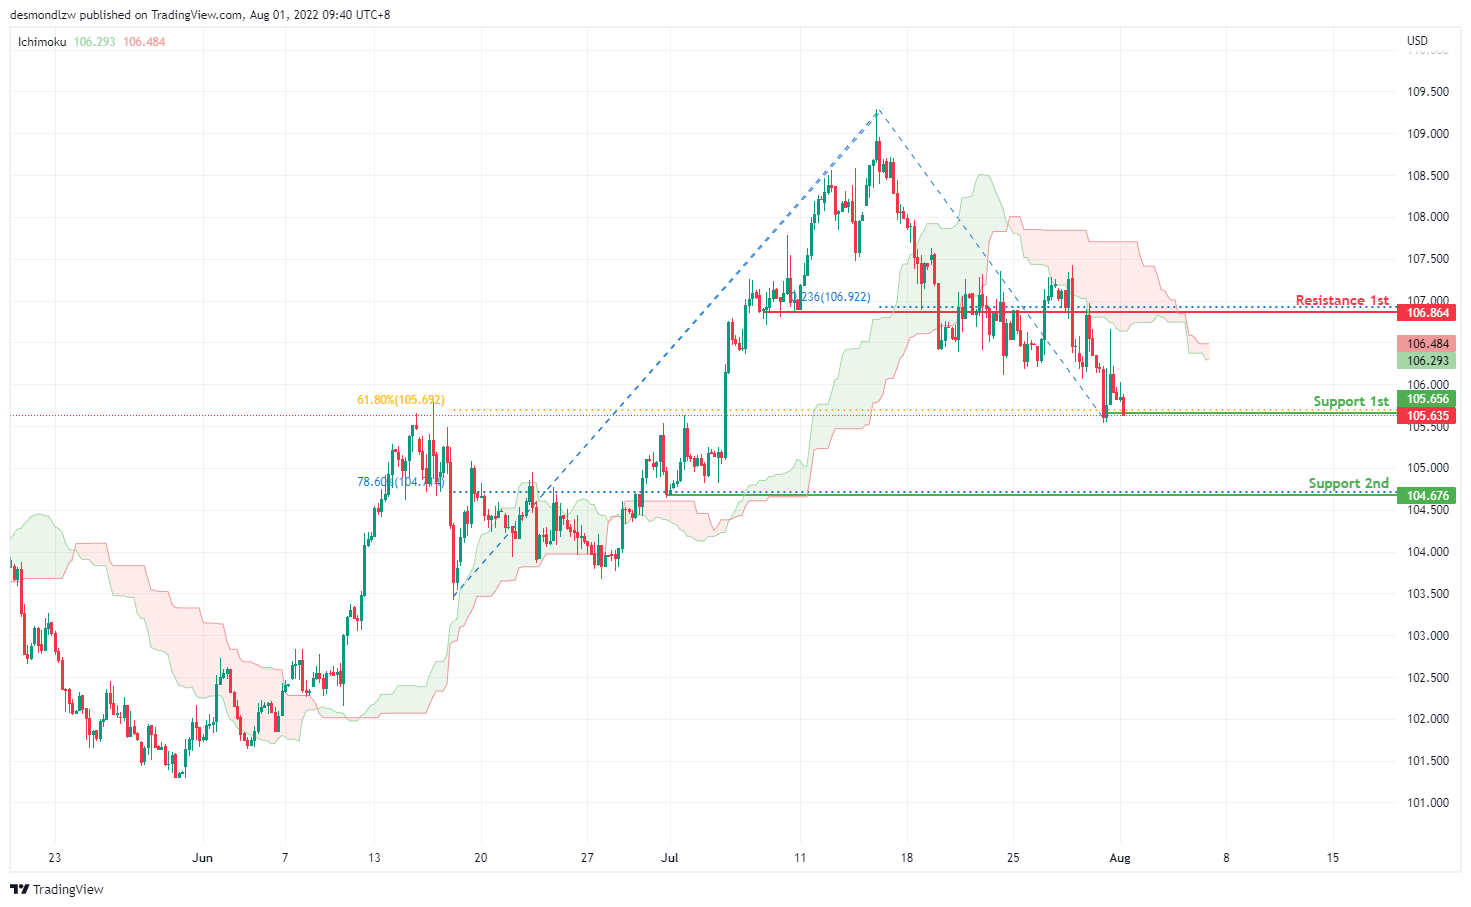
DXY:
On the H4, prices have broken the ascending trend into a bearish biased trend. Prices have been strong in its bearish momentum, still respecting the Ichimoku cloud. It is currently testing at the first support 105.657, 61.8% Fibonacci retracement. If price were to break this support level, it will pullback further to test at 78.6% Fibonacci level, 104.676. Alternatively, price could bounce back and test at the first resistance, 23.6% Fibonacci extension
Areas of consideration:
- H4 time frame, 1st resistance at 106.864
- H4 time frame, 1st support at 105.656
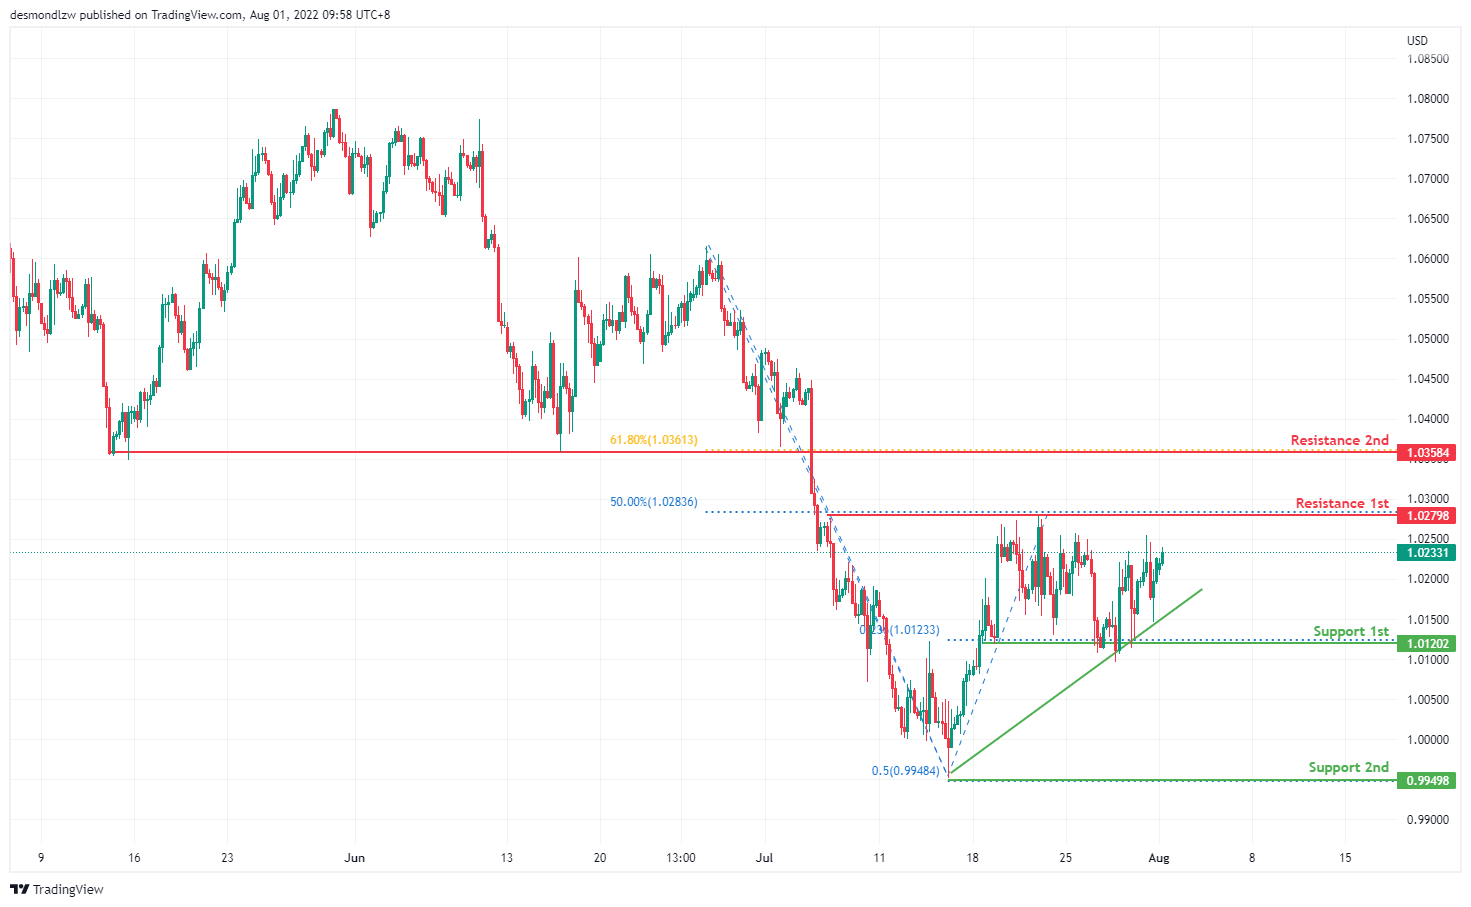
EUR/USD :
On the H4, prices have broken the bearish trend moving into a bullish biased trend. Price is now pulling back to test at the first resistance 1.027, 50% Fibonacci retracement level as it failed to break the first support at 1.012 which coincides with 23.6% Fibonacci extension. If price continues in the ascending trend, it will pullback further to test at the second resistance which is also a key swing low level. Alternatively, if prices continues with the bearish trend, it will test at the first support 1.012, subsequently the second support at 50% Fibonacci extension
Areas of consideration :
- H4 1st resistance at 1.027
- H4 1st support at 1.012
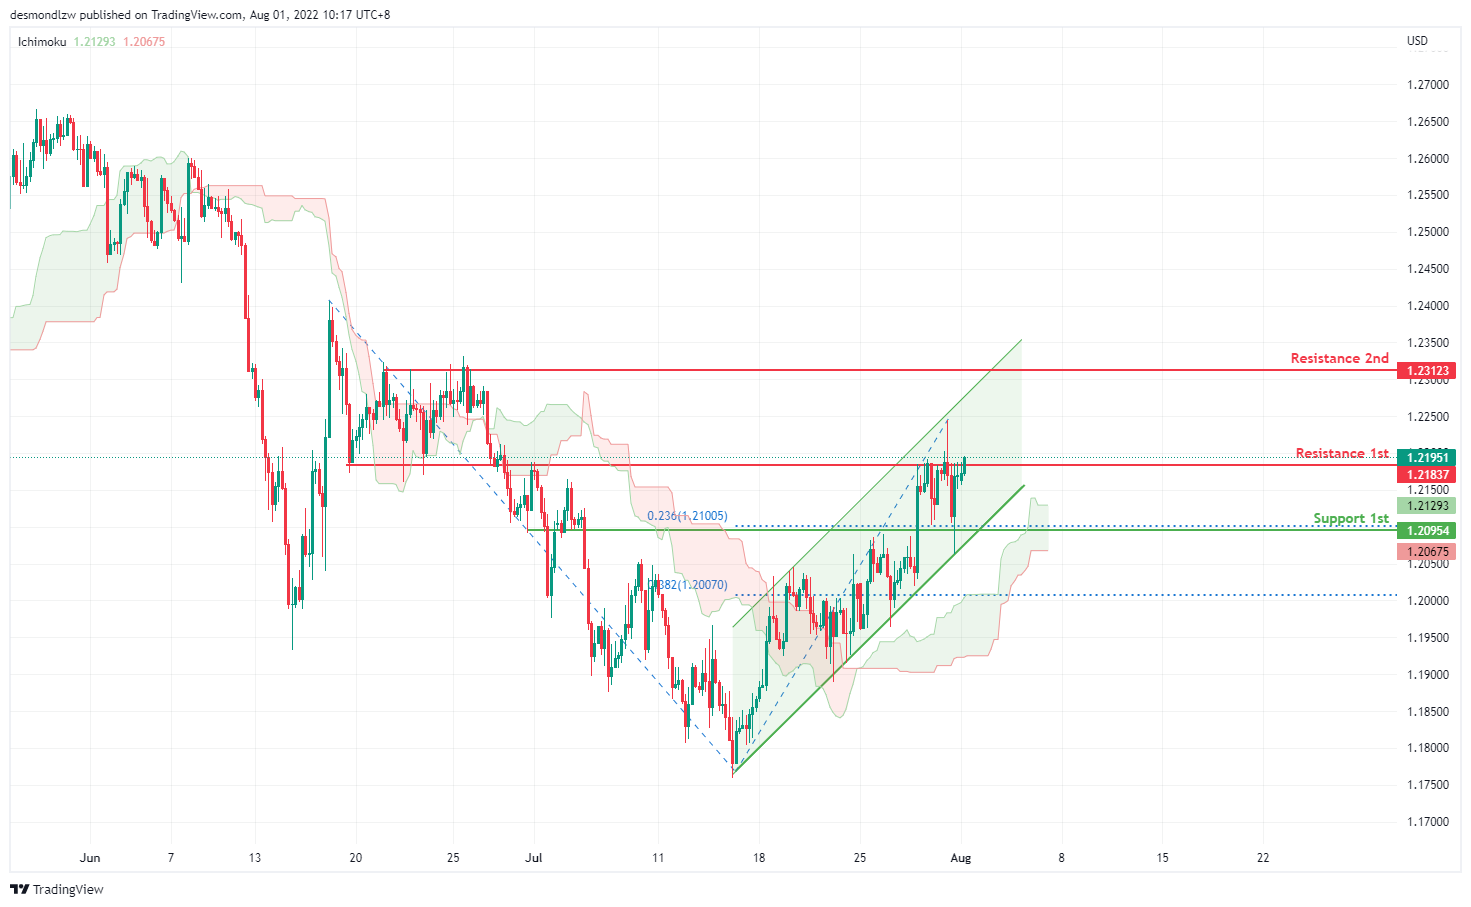
GBP/USD:
On the H4, with prices moving within an ascending channel and respecting the Ichimoku cloud, we are bullish bias. Price is now testing at the first resistance, 1.219 where the overlap support is. pullback resistance and 100% Fibonacci projection are. Once prices break the first resistance and there is upside confirmation, we would expect bullish momentum to carry price to 2nd resistance at 1.231 is. Alternatively, price could drop to 1st support at 1.209 where the 23.6% Fibonacci extension and pullback support is
Areas of consideration:
- H4 1st resistance at 1.219
- H4 1st support at 1.209
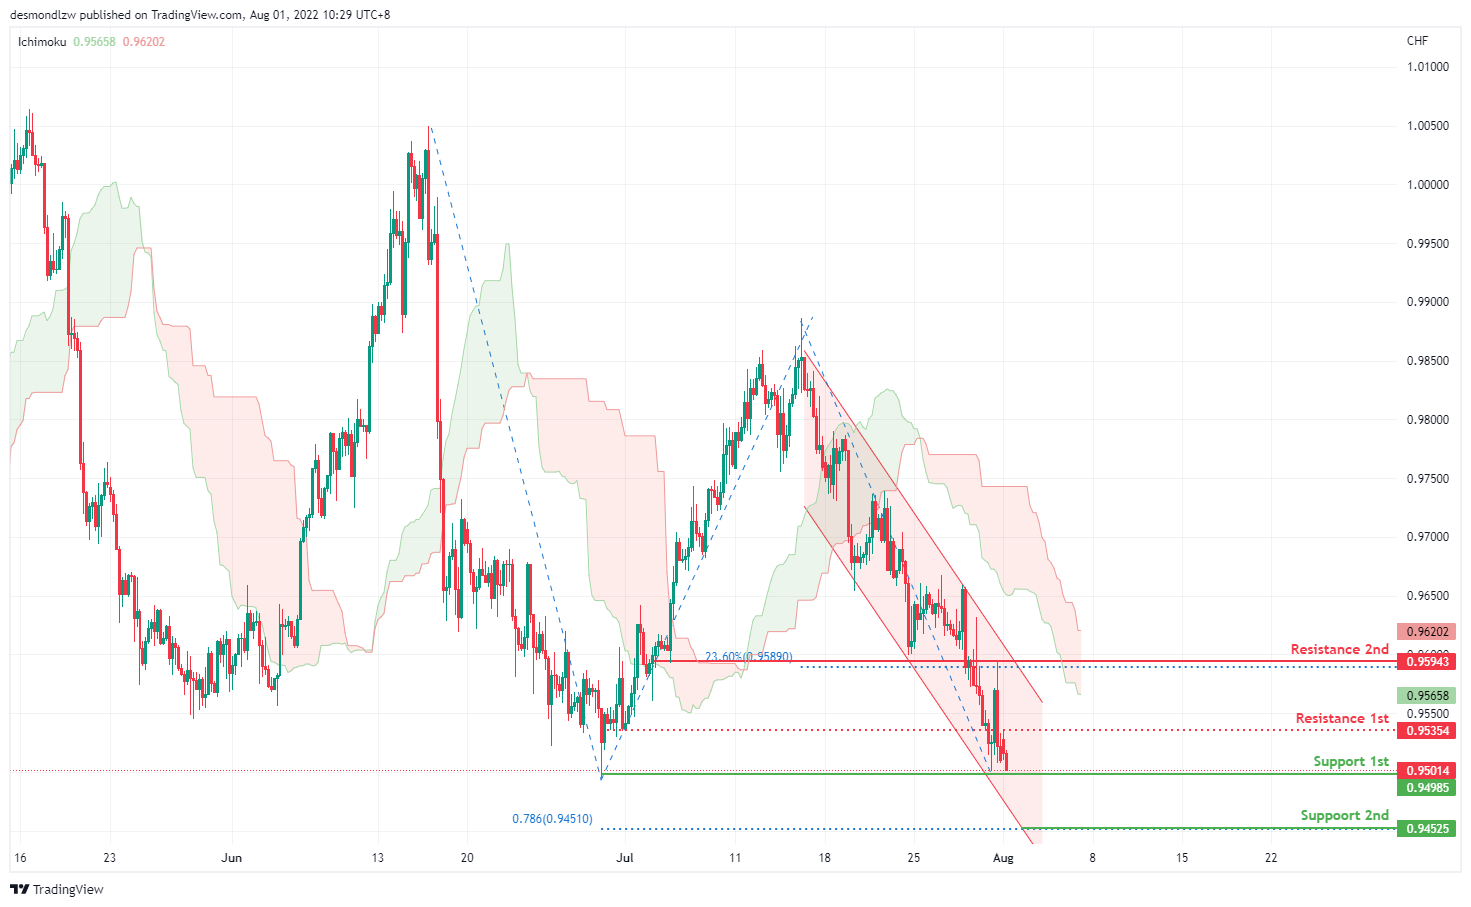
USD/CHF:
On the H4, prices are moving in a strong bearish momentum, respecting the descending channel. We have a bearish bias that price might drop to test at our first support, 0.950 which is our key support level. If price breaks the support, it will pullback further to test at 78.6% Fibonacci extension which is still respecting the channel. Alternatively, price may bounce off from the 1st support to test at the first intermediate resistance at 0.9535, subsequently testing the second resistance which is at the 23.6% Fibonacci retracement and overlap resistance.
Areas of consideration
- H4 1st resistance at 0.959
- H4 1st support at 0.950
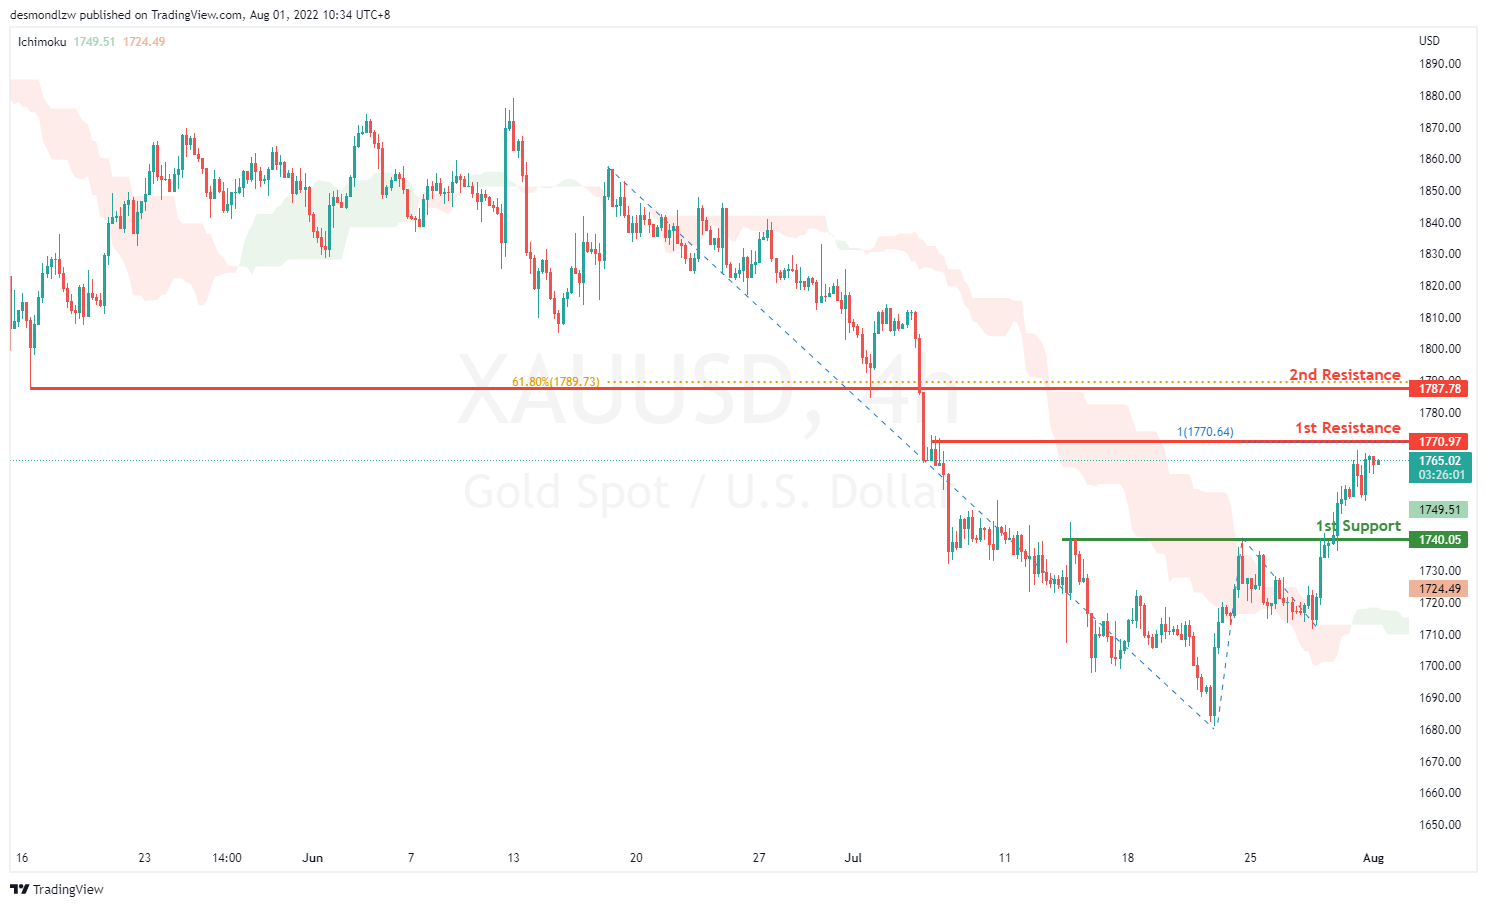
XAU/USD (GOLD):
On the H4, with prices breaking out the ichimoku indicator, we have a bullish bias that price will drop and rise from the 1st resistance at 1770.97 where the the 100% projection is to 2nd resistance at 1787.78 in line with pullback resistance and 61.8% fibonacci retracement. Alternatively, prices could break 1st resistance and drop to 1st support at 1740.05 where the multiple swing highs are.
Areas of consideration:
- H4 time frame, 1st Resistance at 1770.97
- H4 time frame, 2nd Resistance at 1787.78
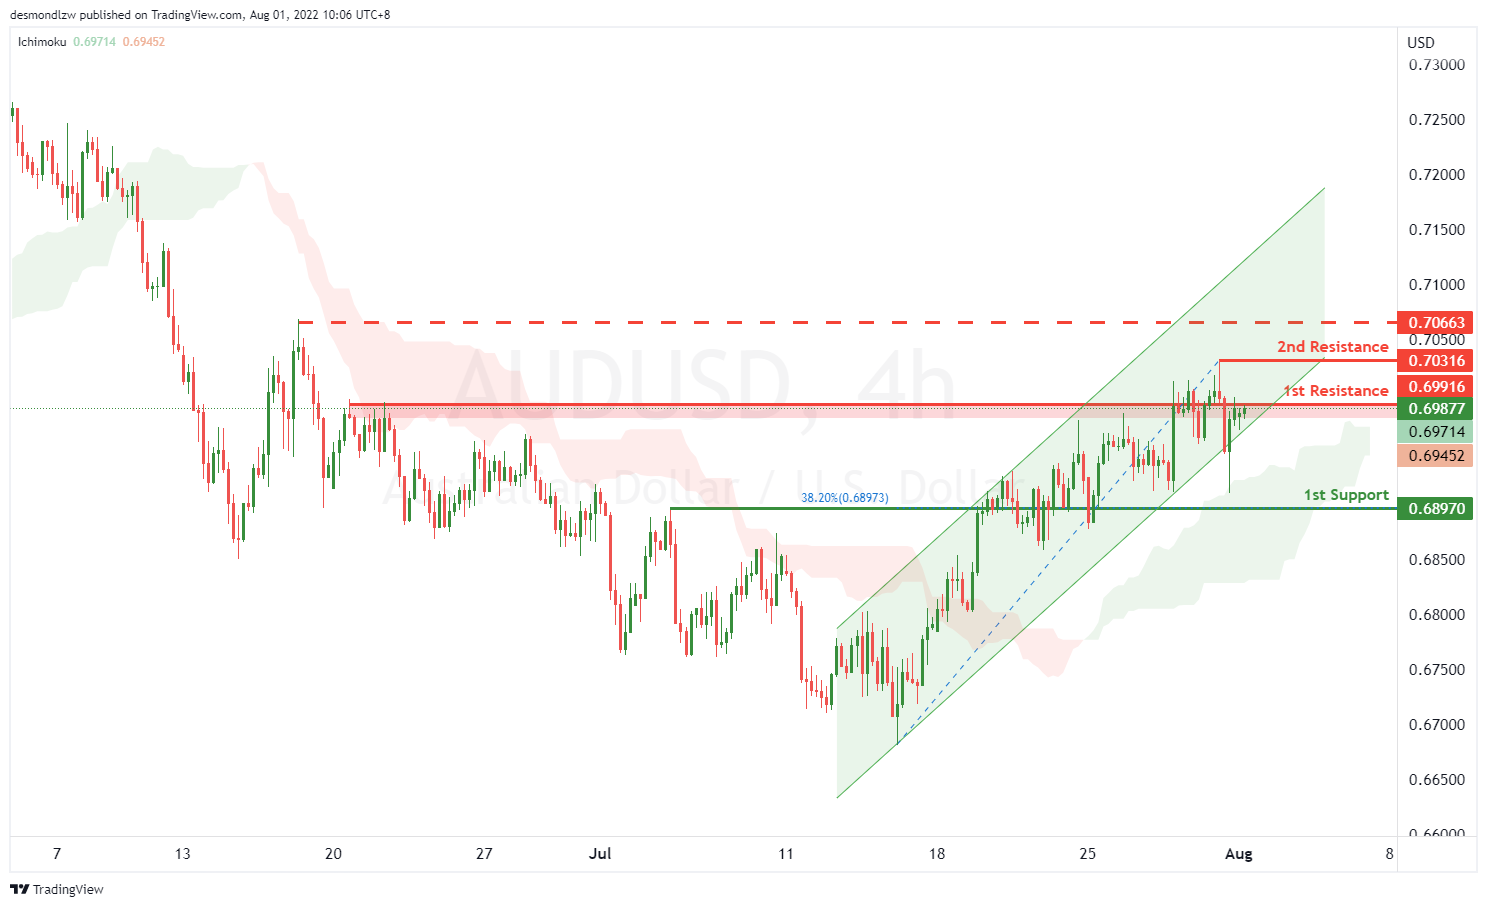
AUD/USD:
On the H4, with price moving above the ichimoku cloud and going along the ascending trend channel, we have a bullish bias that price will rise from the 1st resistance at 0.69916 to the 2nd resistance at 0.70316 at the swing high. Alternatively, price may reverse off 1st resistance and drop to the 1st support at 0.68970 at 38.2% fibonacci retracement. Take note if the price break the 1st resistance, it may rise to the resistance at 0.70663, which is in line with the swing high.
Areas of consideration
- H4 1st resistance at 0.69916
- H4 1st support at 0.70316
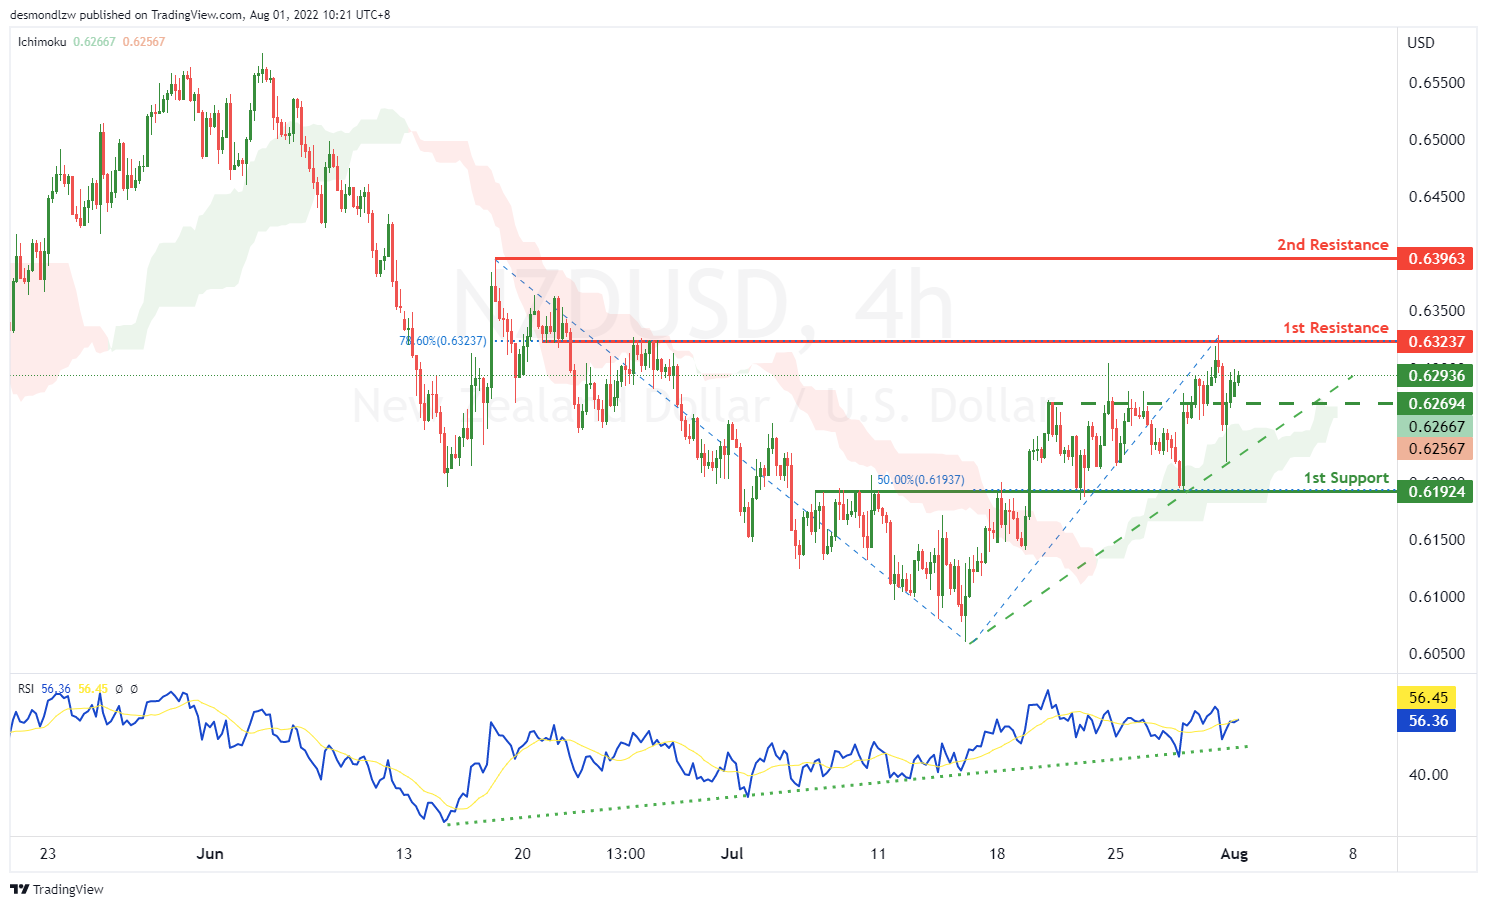
NZD/USD:
On the H4, with price going along the ascending trendline, RSI showing an ascending trendline and moving above the ichimoku cloud, we have a bullish bias that price will rise from the 1st resistance at 0.63237 at the overlap resistance in line with the 78.6% fibonacci retracement to the 2nd resistance at 0.63963 at the swing high. Alternatively, price may reverse off the 1st resistance and drop to the 2nd support at 0.61924 at the multiple swing lows and 50% fibonacci retracement. Take note the price of 0.62694 could be the intermediate support, which is in line with multiple swing highs.
Areas of consideration:
- H4 time frame, 1st resistance at 0.63237
- H4 time frame, 2nd resistance at 0.6396
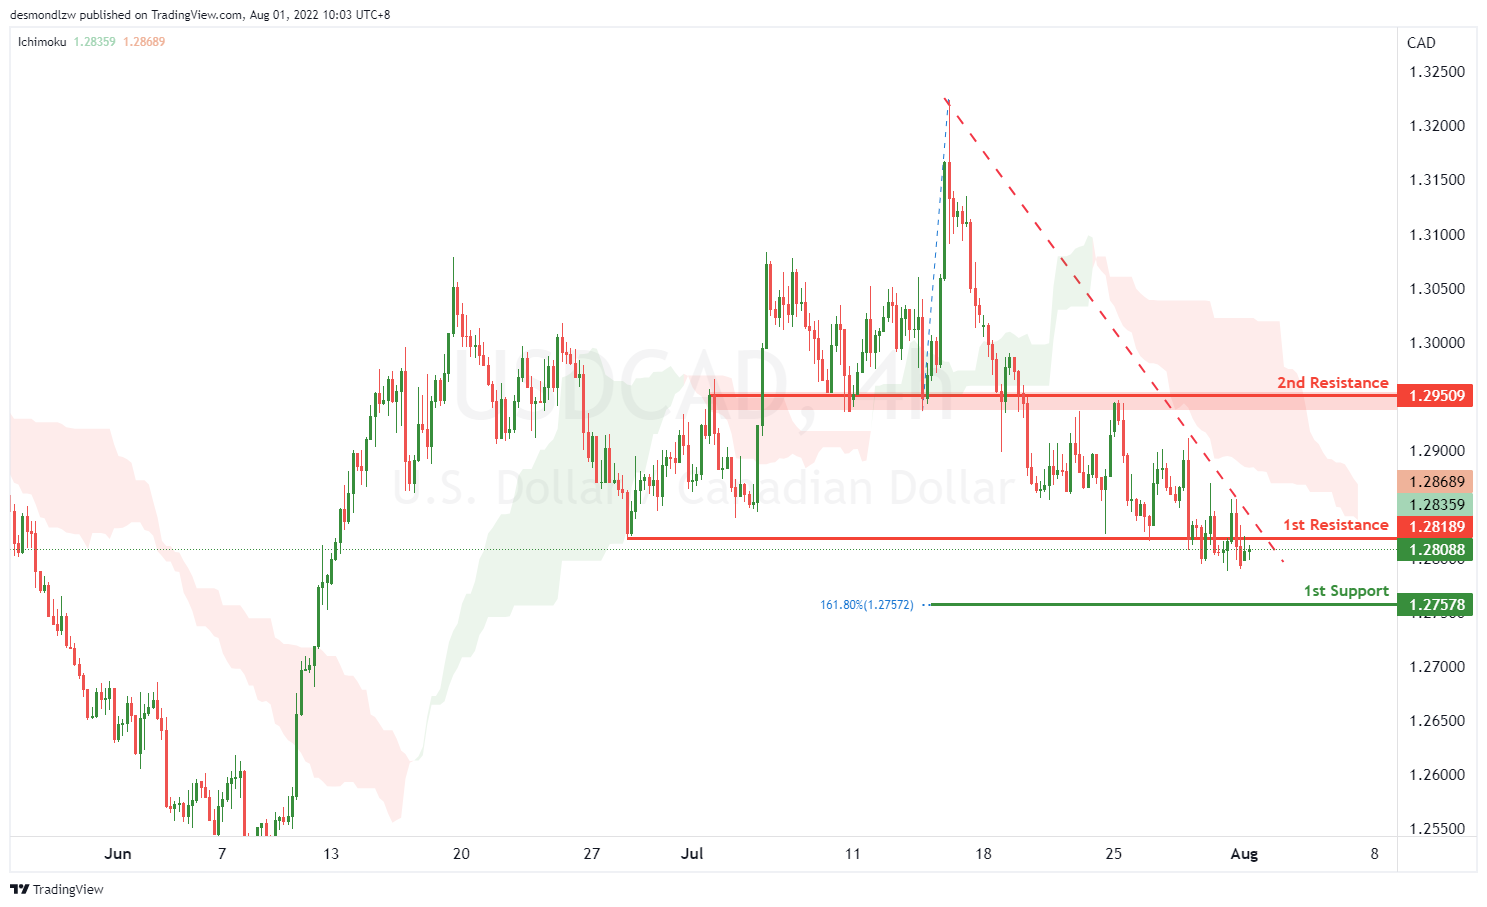
USD/CAD:
On the H4, with the price going along the descending trendline, we have a bearish bias that the price may drop from our 1st resistance at 1.28189, which is in line with swing low to our 1st support at 1.27578, which is in line with the 161.8% fibonacci extension. Alternatively, the price may rise to the 1st resistance at 1.29509, which is in line with the overlap resistance.
Areas of consideration:
- H4 time frame, 1st resistance at 1.28189
- H4 time frame, 1st support at 1.27578
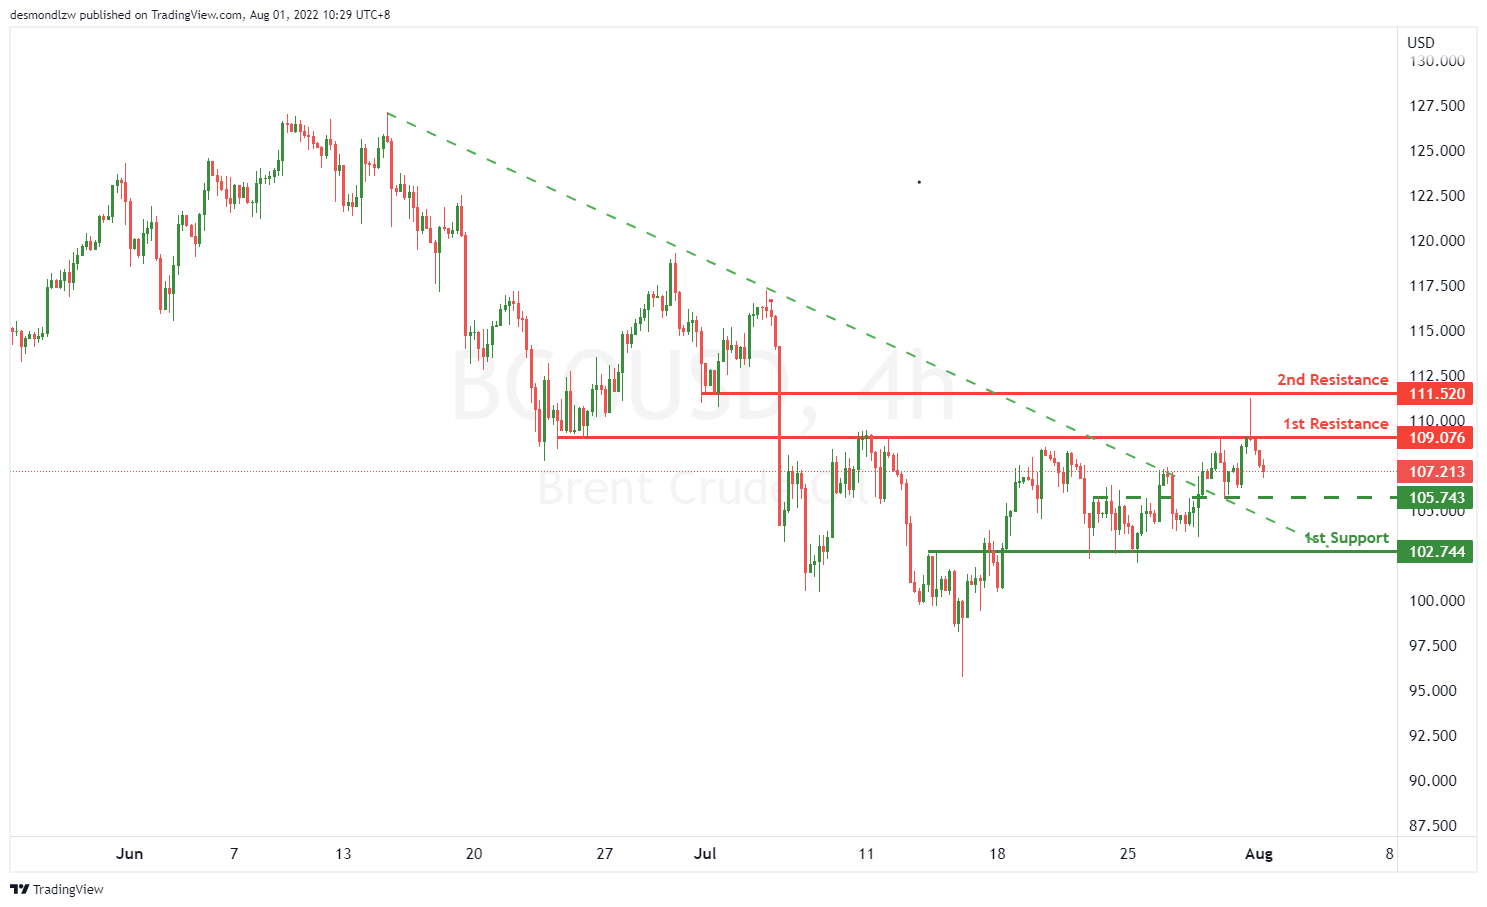
OIL:
On the H4, with price breaking the bearish trendline, we have a bullish bias that price might rise from our 1st resistance at 109.076, which is in line with the overlap resistance to our 2nd resistance at 111.520, which is in line with swing low. Alternatively, take note if the price break the intermediate support at 105.743, which is in line with multiple swing highs and lows, the price may drop to 1st support at 102.744, which is in line with overlap support.
Areas of consideration:
- H4 time frame, 1st resistance of 109.076
- H4 time frame, 2nd resistance of 111.520
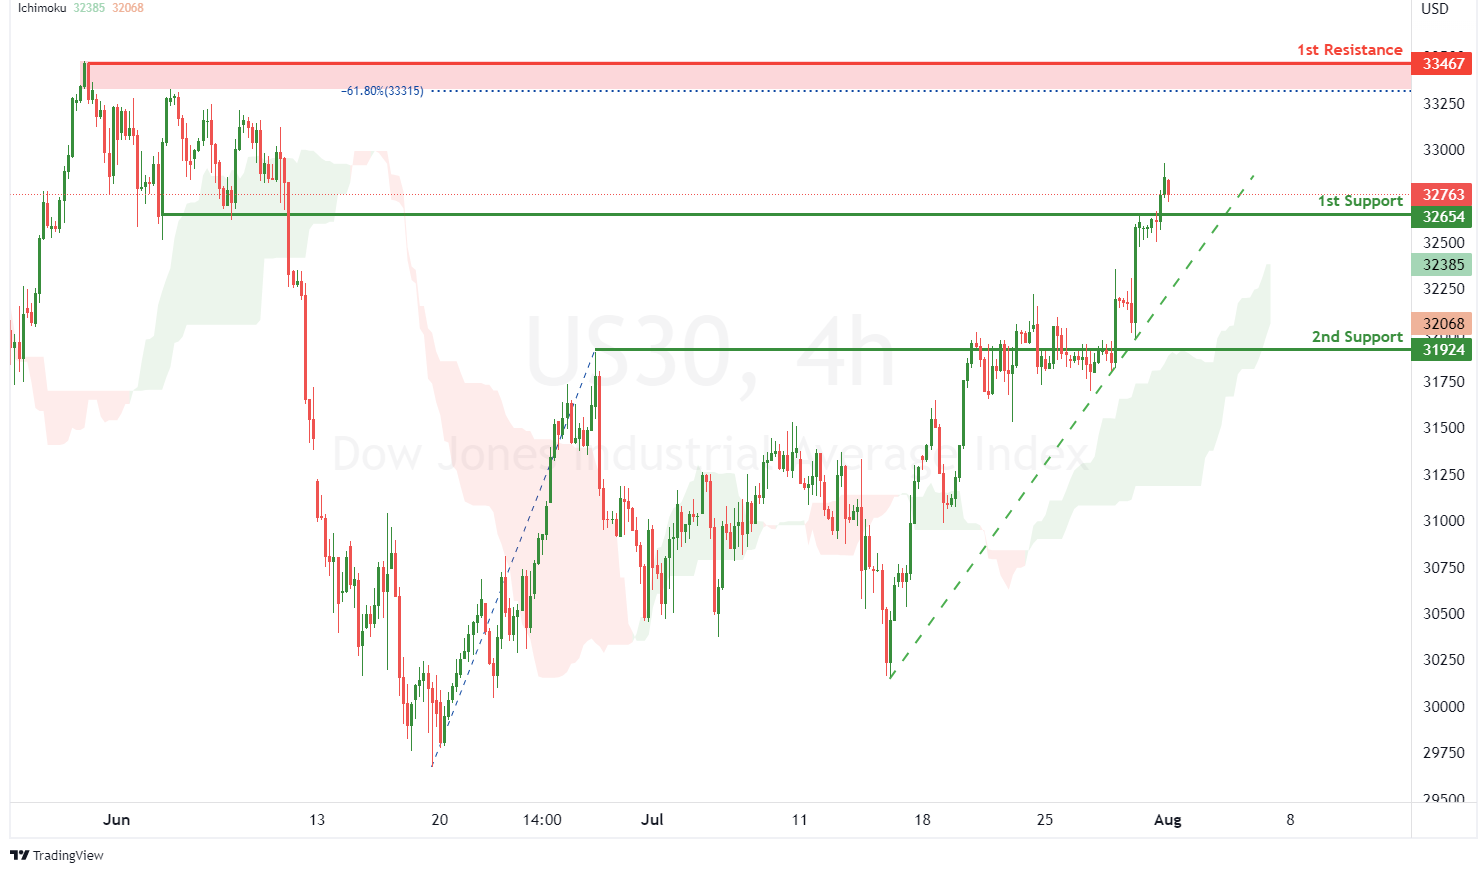
Dow Jones Industrial Average:
On the H4, with price moving along an ascending trendline and above the ichimoku indicator, we have a bullish bias that price will rise from our 1st support at 32654 where the pullback support is to the 1st resistance at 33467 where the swing high resistance and -61.8% fibonacci expansion are. Alternatively price could break 1st support structure and drop to 2nd support at 31924 where the pullback support is.
Areas of consideration:
- H4 time frame, 1st resistance of 33467
- H4 time frame, 1st support at 32654
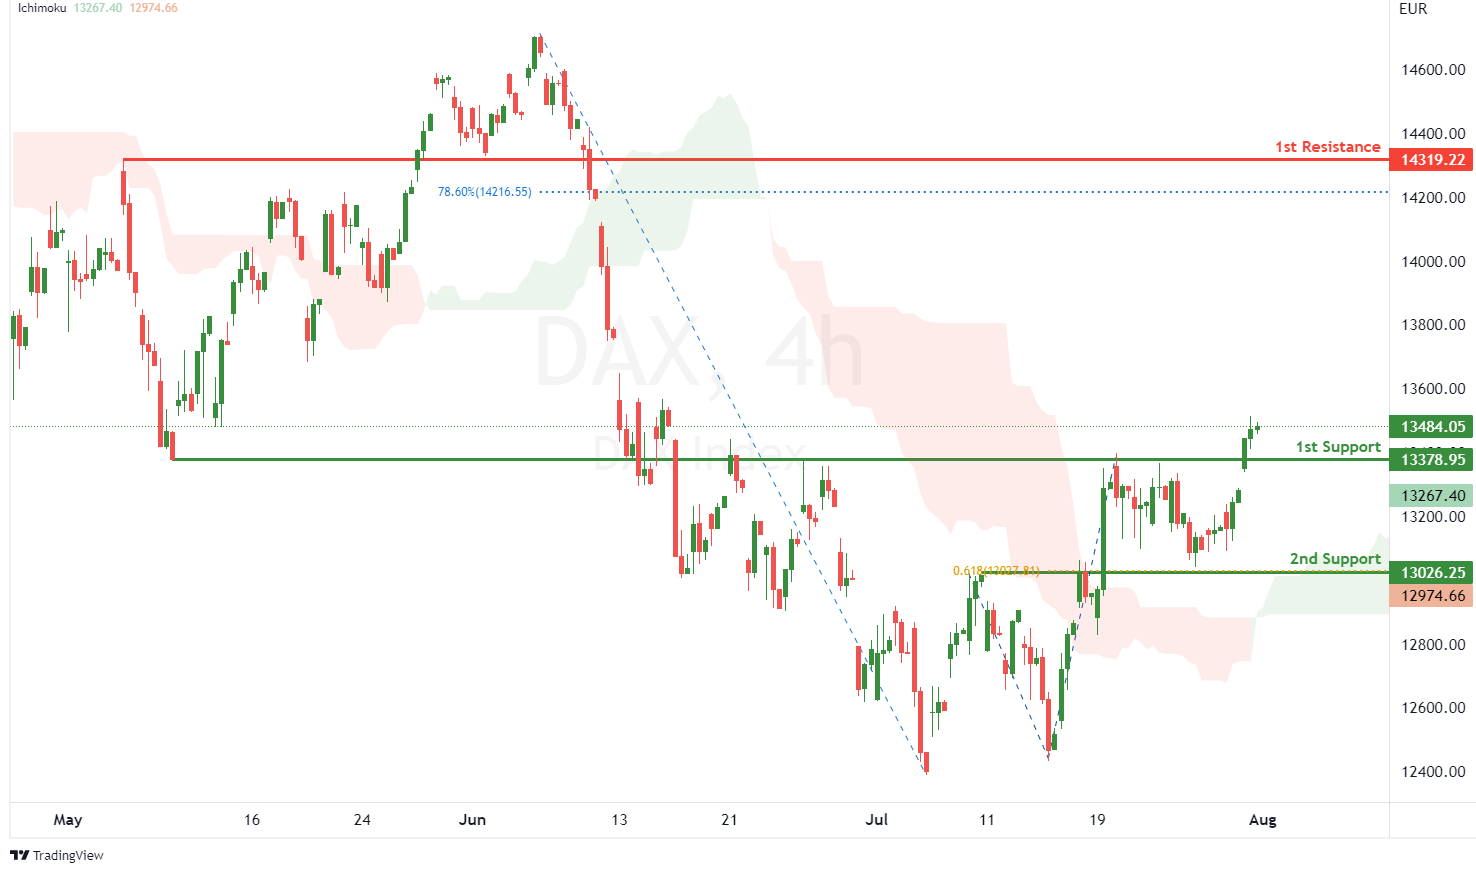
DAX:
On the H4, with price moving above the ichimoku indicator, we have a bullish bias that price will rise from 1st support at 13378.95 in line with overlap support to the 1st resistance at 14319.22 where the pullback resistance and 78.6% fibonacci retracement are. Alternatively, price could break 1st support structure and drop to 2nd support at 13026.25 where the pullback support and 61.8% fibonacci projection are.
Areas of consideration:
- H4 time frame, 1st resistance of 14319.22
- H4 time frame, 1st support at 13378.95
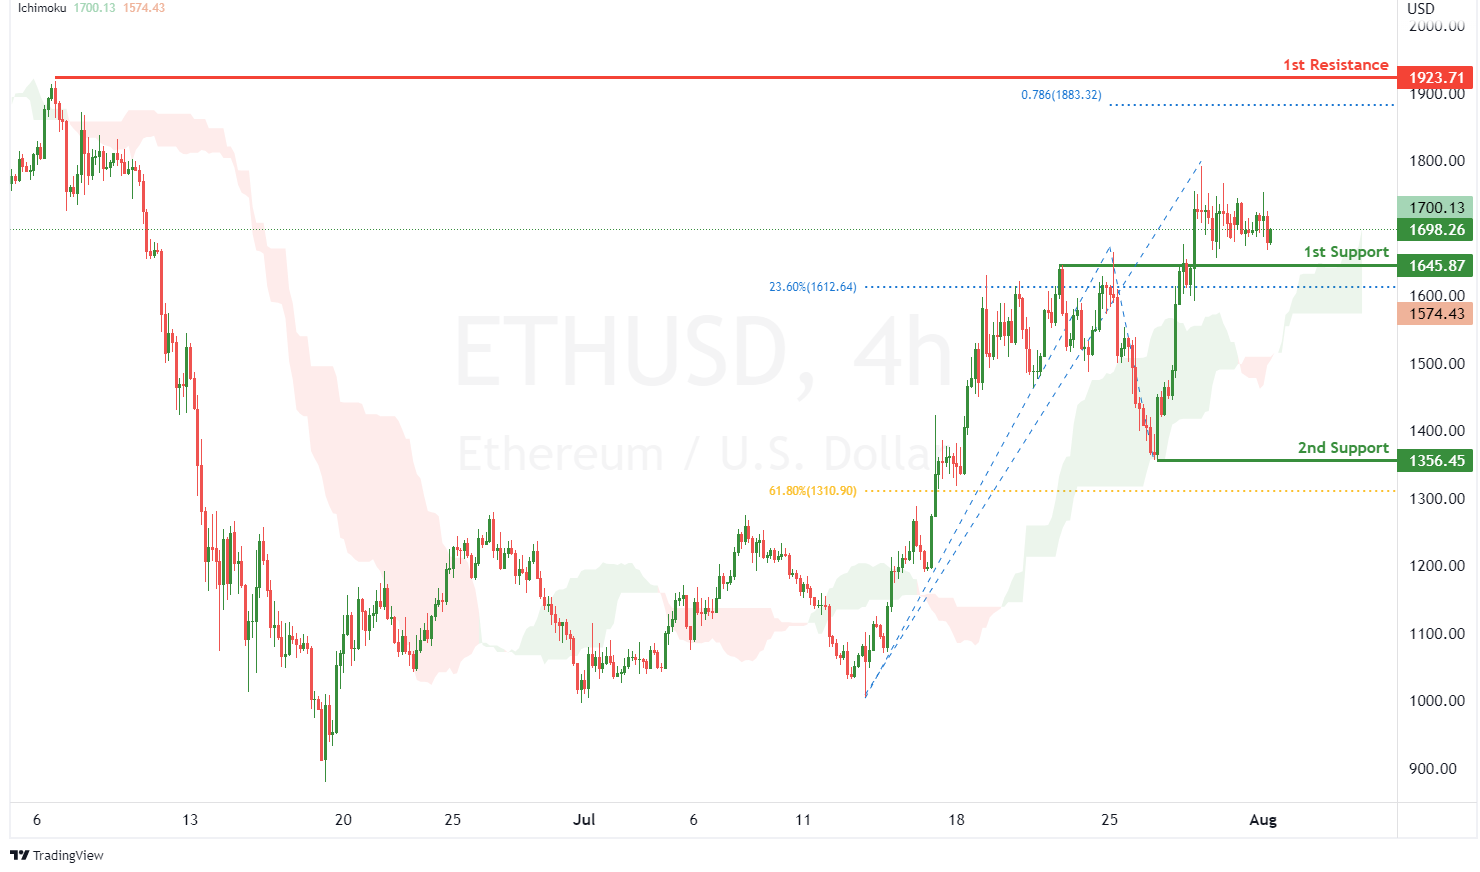
ETHUSD:
On the H4, with price moving above the ichimoku indicator, we have a bullish bias that price will rise from our 1st support at 1645.87 where the pullback support and 23.6% fibonacci retracement are to the 1st resistance at 1923.71 where the swing high resistance and 78.6% fibonacci projection are. Alternatively, price could break 1st support and drop to 2nd support at 1356.45 where the swing low support and 61.8% fibonacci retracement are.
Areas of consideration:
- H4 time frame, 1st resistance of 1923.71
- H4 time frame, 1st support at 1645.87
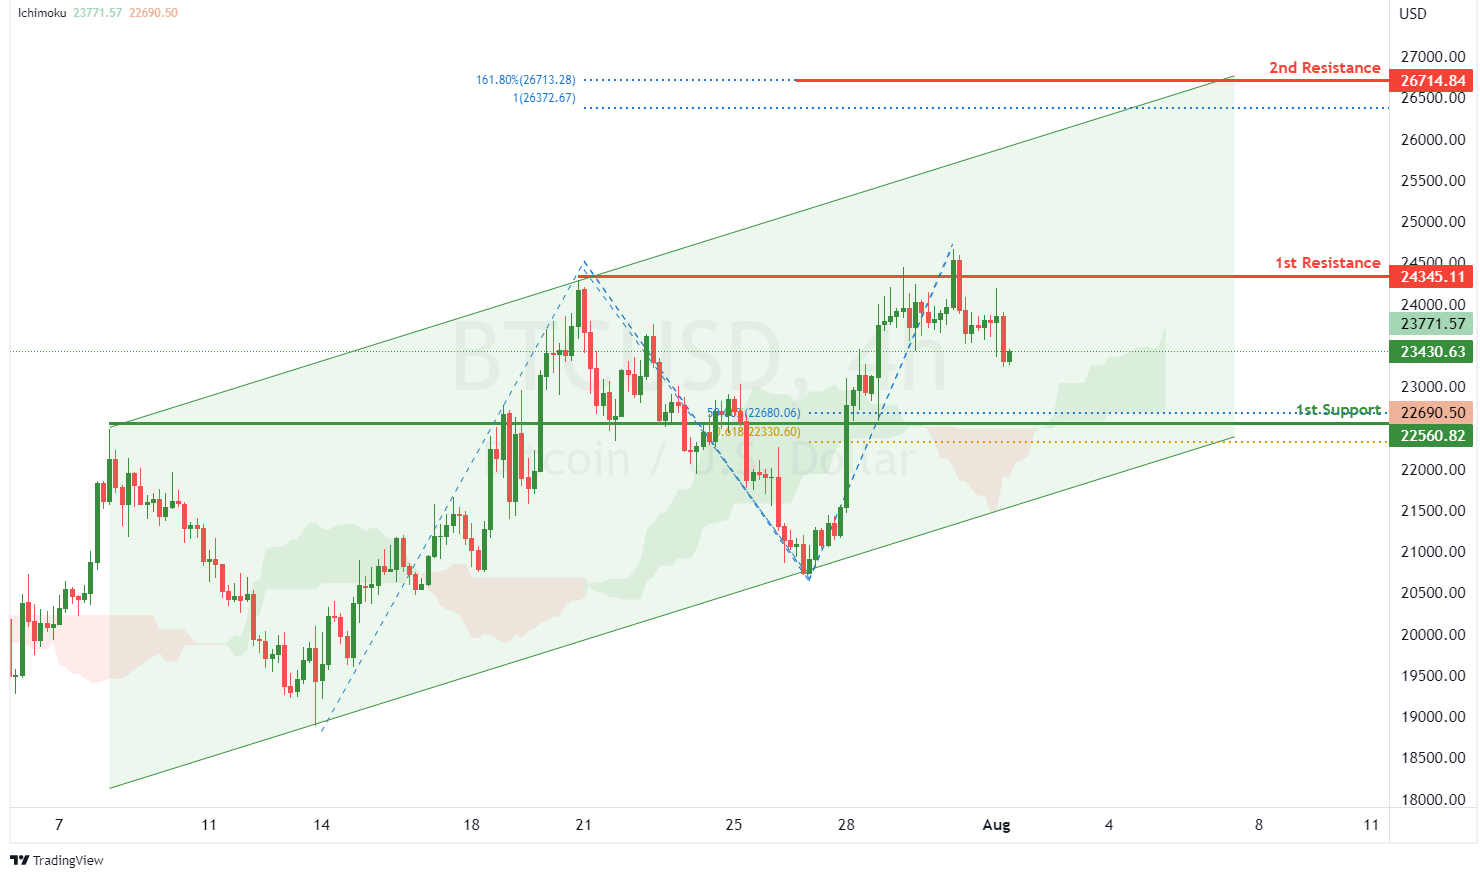
BTCUSD:
On the H4, with price moving within a bullish channel and above the ichimoku indicator, we have a bullish bias that price might rise to our 1st resistance at 24345.11 where the pullback resistance is. Once there is upside confirmation of price breaking 1st resistance structure, we would expect bullish momentum to carry price to 2nd resistance at 26714.84 where the 161.8% fibonacci extension and 100% fibonacci projection are. Alternatively, price could drop to 1st support at 22560.82 where the pullback support, 50% fibonacci retracement and 61.8% fibonacci projection are.
Areas of consideration:
- H4 time frame, 1st resistance of 24345.11
- H4 time frame, 1st support at 22560.82
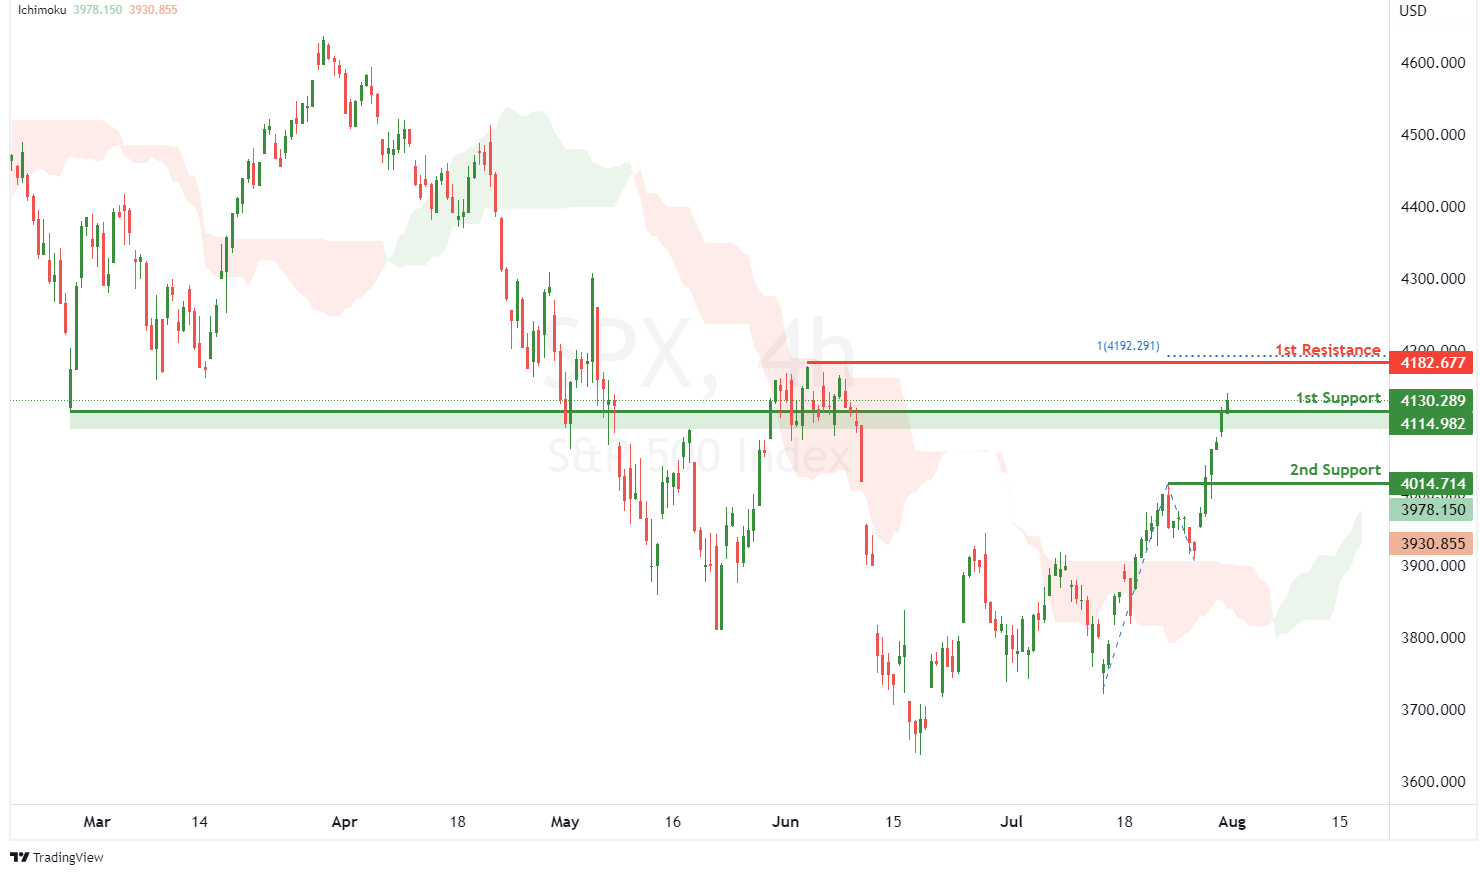
S&P 500:
On the H4, with price moving above the ichimoku indicator, we have a bullish bias that price will rise from our 1st support at 4114.982 where the pullback support is to the 1st resistance at 4182.677 where the swing high resistance and 100% fibonacci projection are. Alternatively, price could break 1st support and drop to 2nd support at 4014.714 where the pullback support is.
Areas of consideration:
- H4 time frame, 1st resistance of 4182.677
- H4 time frame, 1st support at 4114.982


