
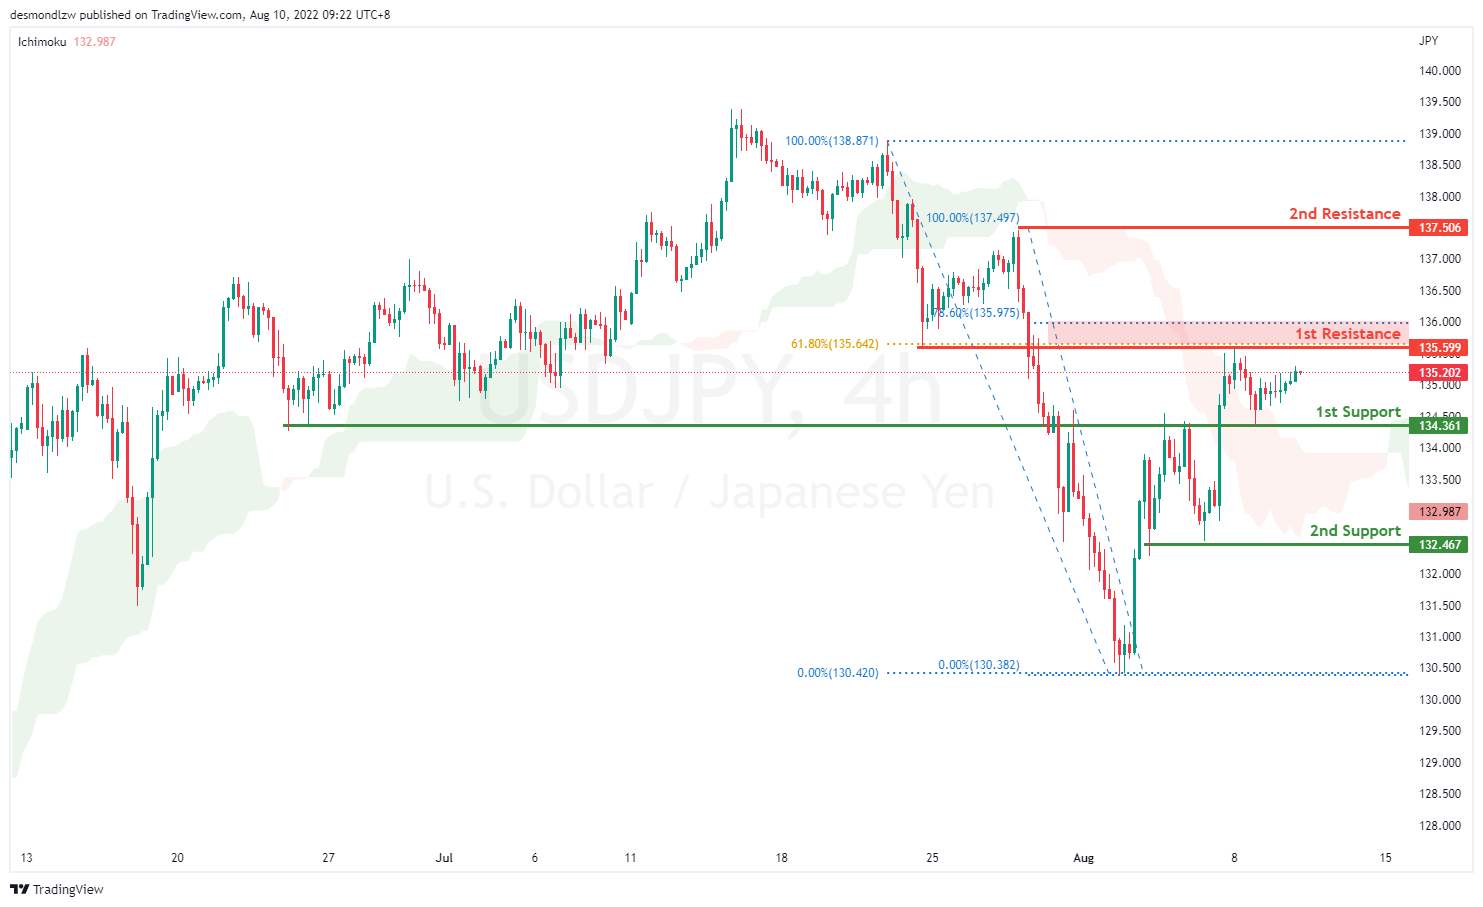
USD/JPY:
On the H4, price is still bullish biased as it fails to pull back to the first support the previous session. It is currently moving towards the first resistance at 135.599 which coincides with the 61.8% Fibonacci retracement and the previous swing low. If price breaks this level, it will move up to test at the second resistance which is the previous swing high at 137.506. Alternatively, price could pull back to test at the first support 134.361 which is the previous swing low
Areas of consideration:
- H4 time frame, 1st resistance at 135.599
- H4 time frame, 1st support at 134.361
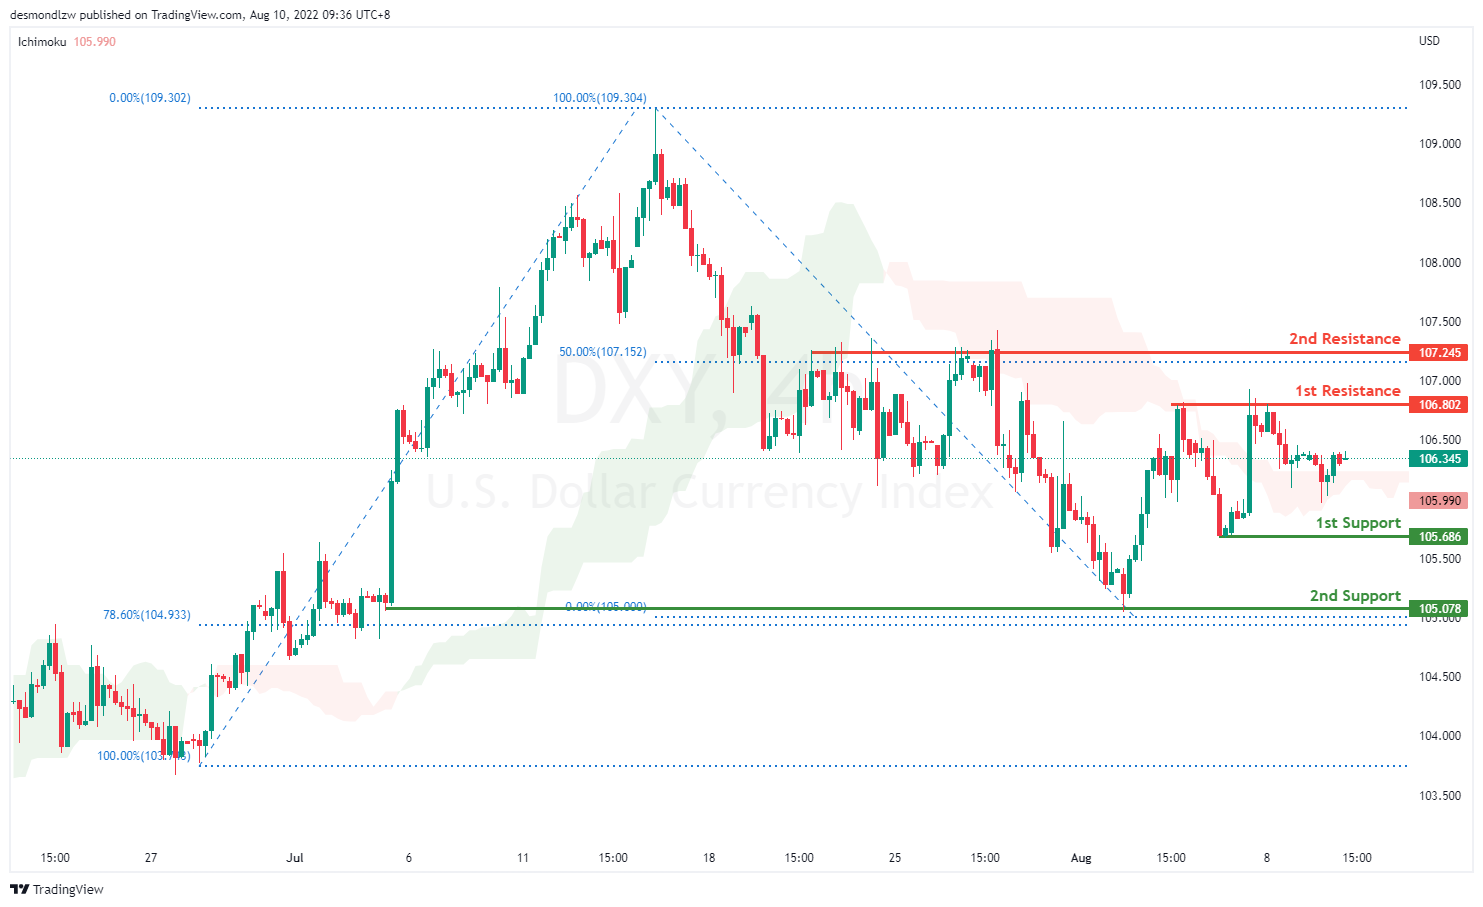
DXY:
On the H4, prices have broken the descending trend into a bullish biased trend. Prices look like it’s going to test at the first resistance 106.802 where the previous swing high sits. If prices break the first resistance it will confirm a bullish momentum and prices will continue to move in an ascending trend towards the second resistance at 107.245 where the 50% fibonacci retracement sits. If prices rejects the first resistance and continues in the descending trend, it will test at the first support 105.686 and then the second support at previous swing low 105.078
Areas of consideration:
- H4 time frame, 1st resistance at 106.802
- H4 time frame, 1st support at 105.686
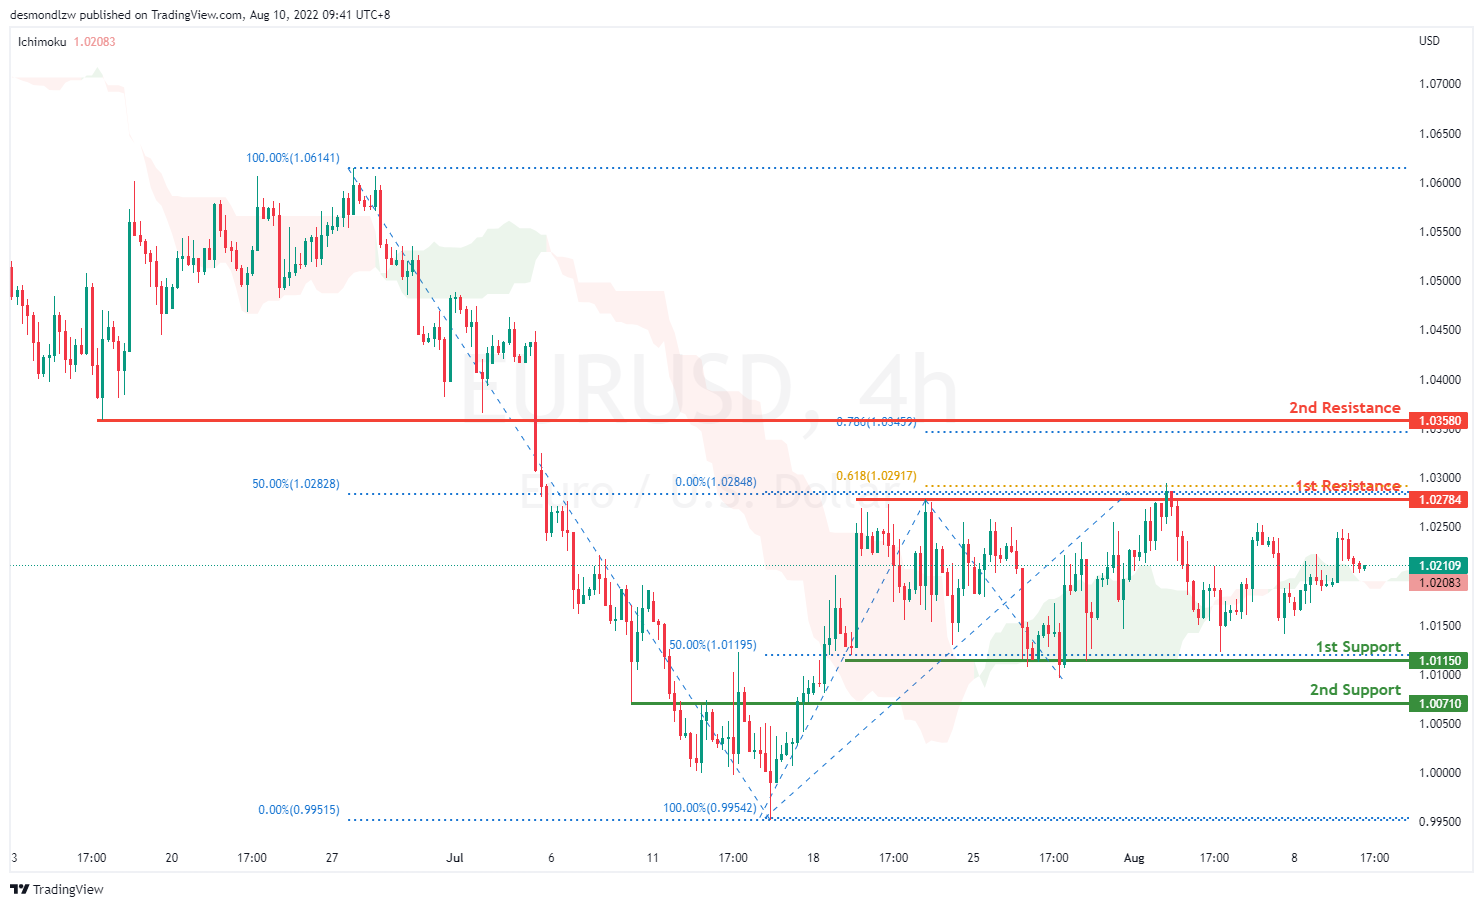
EUR/USD :
On the H4, prices have broken the bearish trend moving into a slightly bullish biased trend. Price is ranging and it seems like it’s going back to test the first resistance at 1.02784 where the 61.8% fibonacci projection and 50% retracement sits. If prices break the first resistance, it will pull back further to test at the second resistance at 1.035. Alternatively, price might test the 1st support at 1.011
Areas of consideration :
- H4 1st resistance at 1.027
- H4 1st support at 1.011
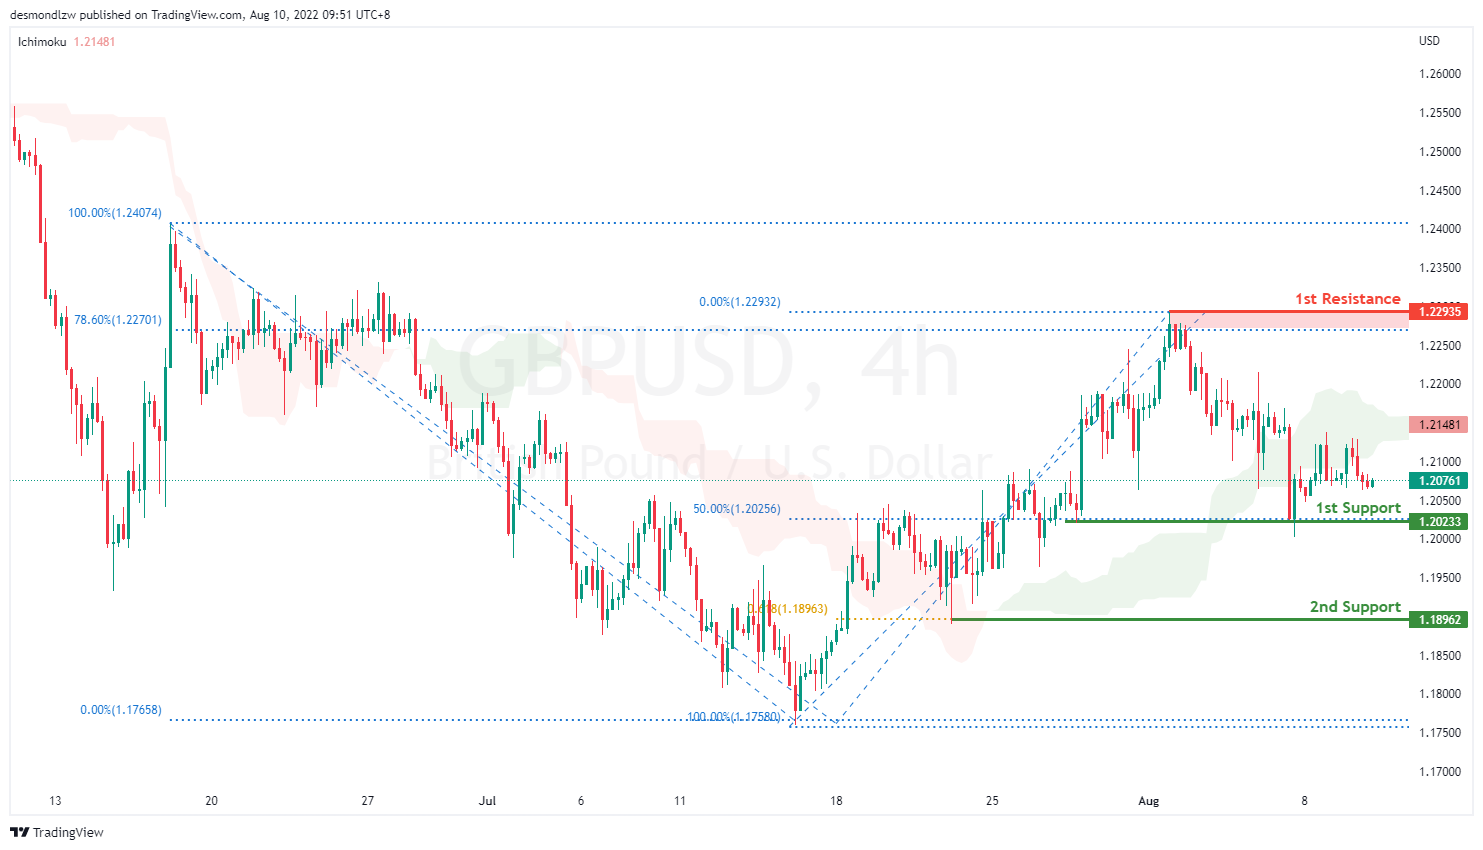
GBP/USD:
On the H4, with prices breaking the ascending channel we are now slightly bearish biased. Price is now moving toward the first support at 1.202 which coincides with 50% Fibonacci retracement. If price break supports and confirms downside trend, we would expect downside momentum to carry price to 2nd support at 1.189 61.8% Fibonacci projection. Alternatively, price could bounce back to test at 78.6% Fibonacci retracement at 1.229
Areas of consideration:
- H4 1st resistance at 1.229
- H4 1st support at 1.202
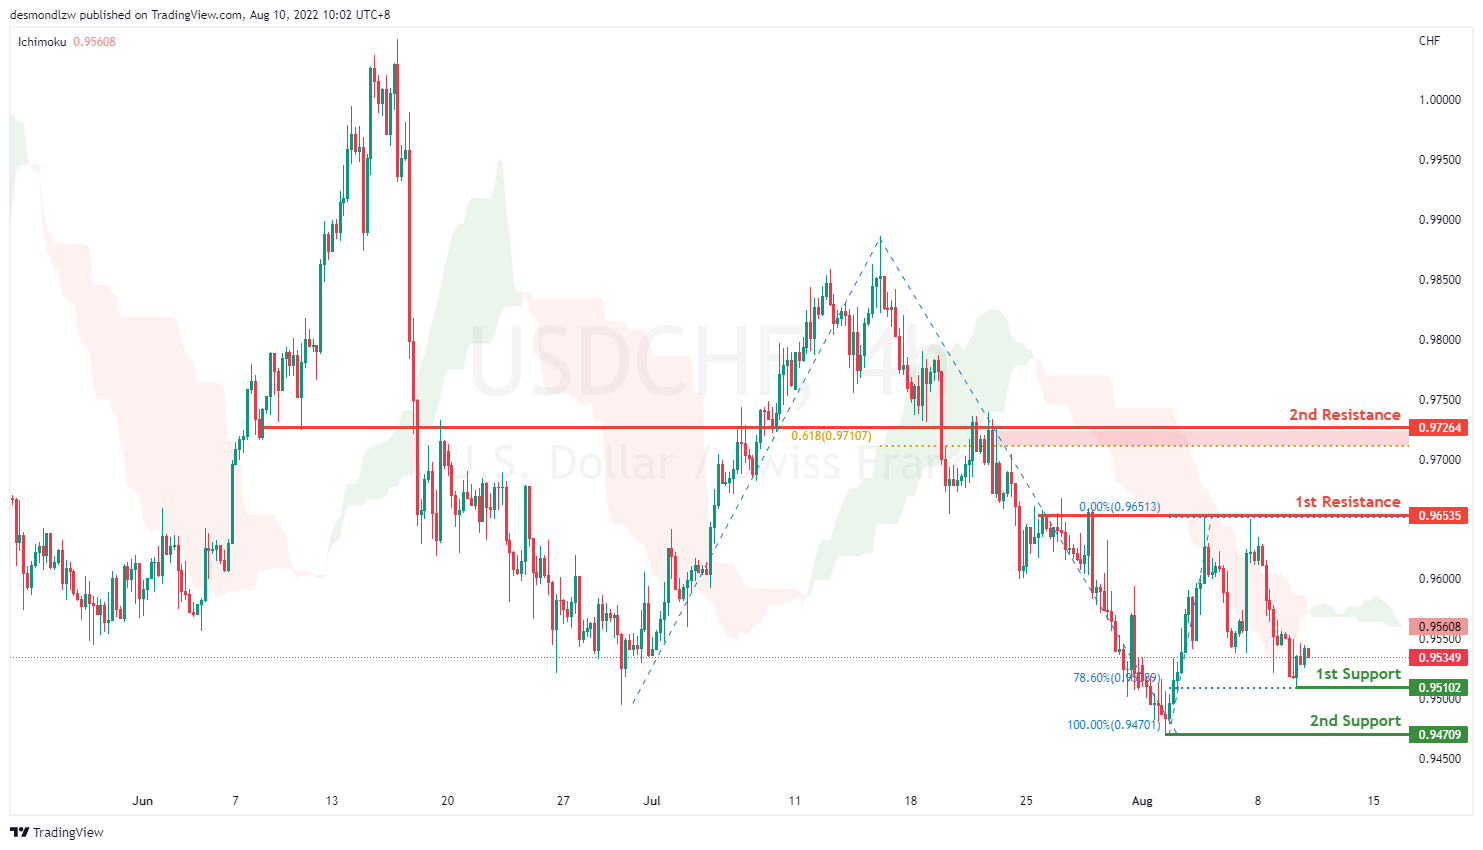
USD/CHF:
On the H4, prices have signalled a slightly bearish momentum as it rejected the 1st resistance at 0.965 which is also the precious swing highs. Prices are moving toward the first support at 0.951 where the 78.6% fibonacci retracement sits. If price continues with the downward momentum, it will bring price to the previous swing low at 0.947. 50% Fibonacci retracement to test at the 1st support 0.955 23.6% fibonacci retracement. If prices break this key level, it will pull back further to test at the second support at 0.947. Alternatively price could test 1st resistance 0.963 subsequently the second resistance at 0.972 where the 61.8% fibonacci projection and previous swing low levels sit
Areas of consideration
- H4 1st resistance at 0.963
- H4 1st support at 0.951
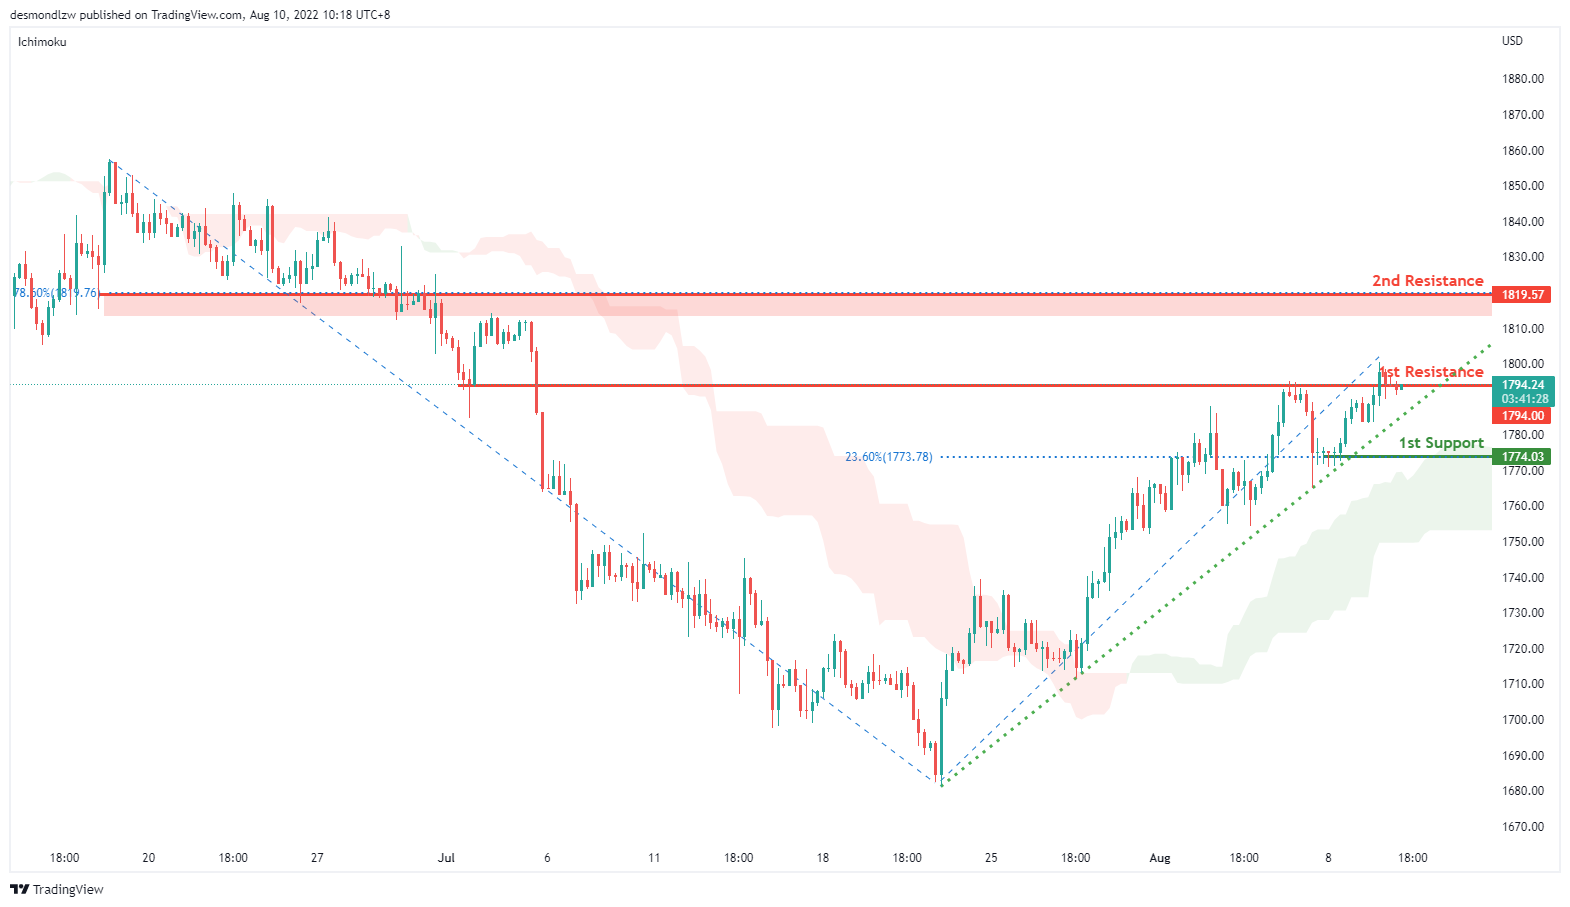
XAU/USD (GOLD):
On the H4, with prices moving along the ascending trendline and above the ichimoku cloud, we have a bullish bias that the price may rise from the 1st resistance at 1794.00, which is in line with the overlap support to the 2nd resistance at 1819.57, which is in line with the 78.6% fibonacci retracement. Alternatively, prices may drop to 1st support at 1774.03,which is in line with the pullback support.
Areas of consideration:
- H4 time frame, 1st resistance at 1794.00
- H4 time frame, 2nd resistance at 1819.57
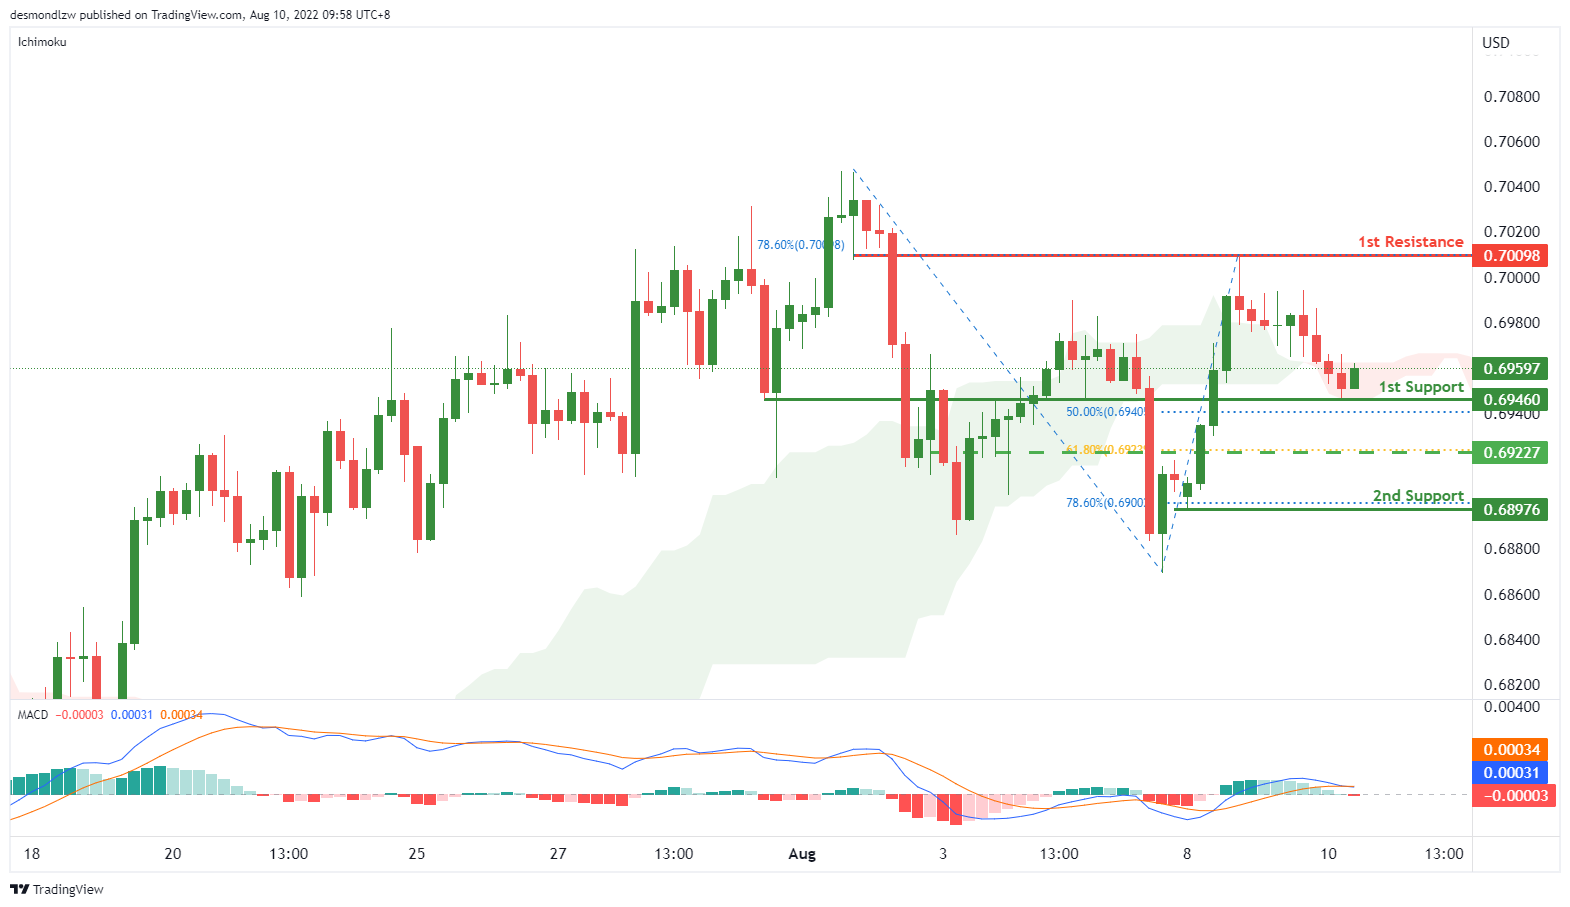
AUD/USD:
On the H4, with the DIF line is breaking below the signal line in MACD, we have a bearish bias that price may drop from the 1st support at 0.69460, where the swing low and 50% fibonacci retracement are to the 2nd support at 0.68976 where the 78.6% fibonacci retracement is. Alternatively, price may rise to the 1st resistance at 0.70098 which is in line with 78.6% fibonacci retracement and swing high. Take note the 0.69227 could be our intermediate support, which is in line with 61.8% fibonacci retracement.
Areas of consideration
- H4 1st support at 0.69460
- H4 2nd support at0.68976
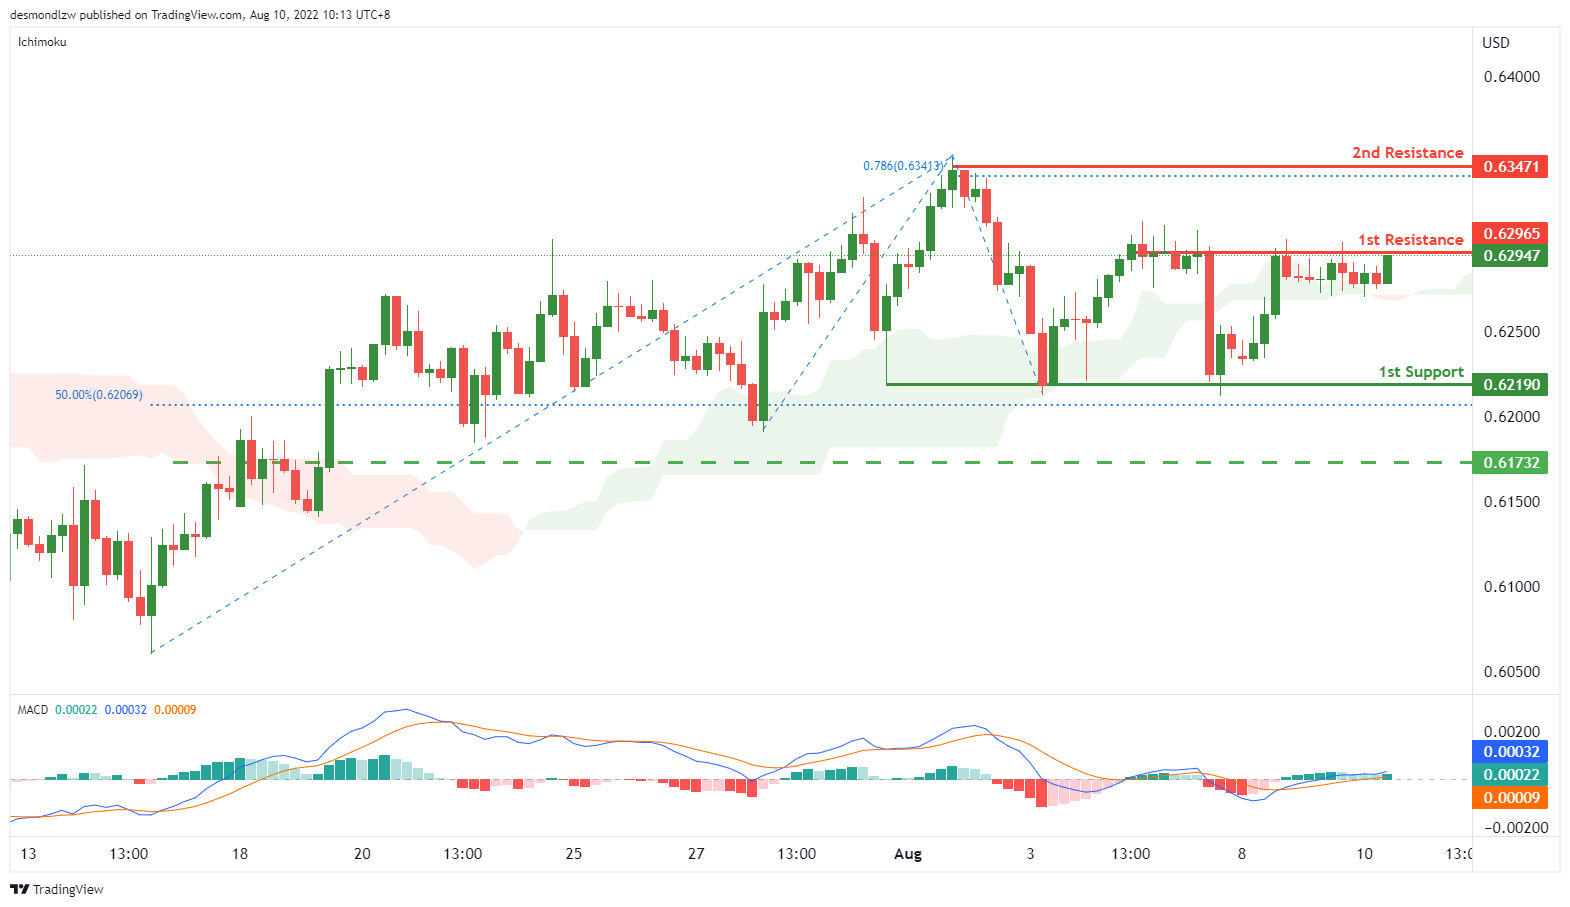
NZD/USD:
On the H4, with price moving above the ichimoku cloud and the histogram is above zero axis, we have a bullish bias that price may rise from the 1st resistance at 0.62965 where overlap resistance is to the 2nd resistance at 0.63471 where 78.6% fibonacci projection is. Alternatively, price may reverse off the 1st resistance and drop to 1st support at 0.62190 where the swing low support is.
Areas of consideration:
- H4 time frame, 1st resistance at 0.62965
- H4 time frame,2nd resistance at 0.63471
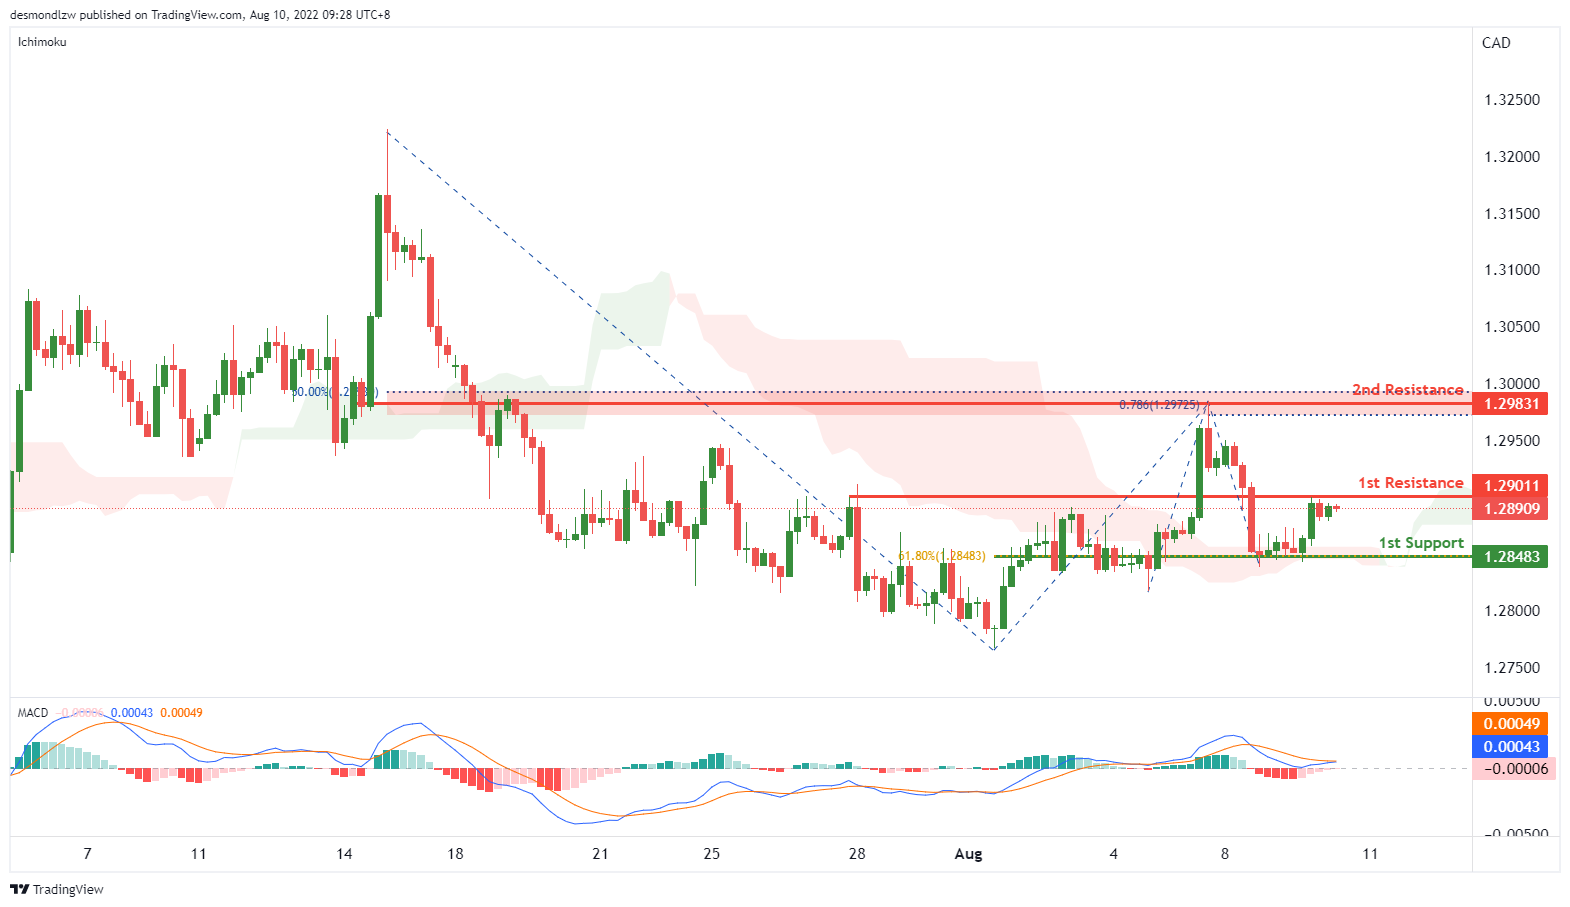
USD/CAD:
On the H4, with the price going above ichimoku cloud, and DIF is breaking the signal line in MACD, we have a bullish bias that the price may rise from our 1st resistance at 1.29011, which is in line with previous swing high to our 2nd resistance at 1.29831, which is in line with the 78.6% fibonacci projection and 50% fibonacci retracement. Alternatively, the price may drop to the 1st support at 1.28483, which is in line with 61.8% fibonacci retracement and pullback support.
Areas of consideration:
- H4 time frame, 1st resistance at 1.29011
- H4 time frame, 2nd resistance at 1.29831
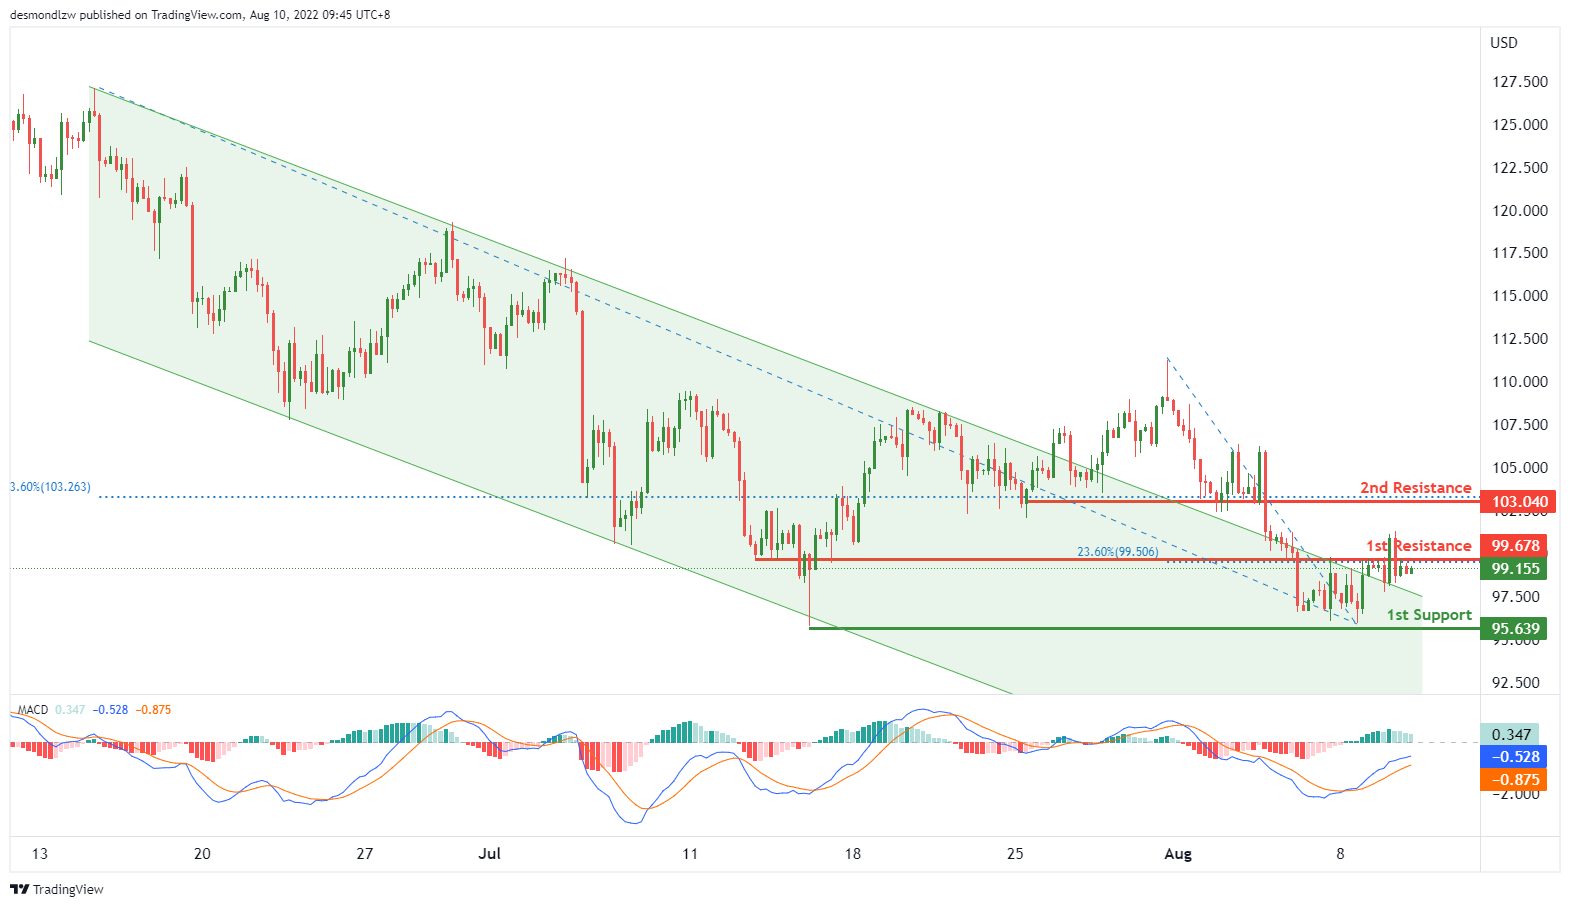
OIL:
On the H4, with price braking the descending trendline, and the histogram of MACD is above zero axis, we have a bullish bias that the price may rise from our 1st resistance at 99.678, which is in line with the 23.6% fibonacci retracement to the 2nd resistance at 103.040, which is in line with the 23.6% fibonacci retracement and overlap resistance. Otherwise, the price may drop to our 1st support at 95.639, where the swing low support is.
Areas of consideration:
- H4 time frame, 1st resistance at 99.678
- H4 time frame, 2nd resistance at 103.04
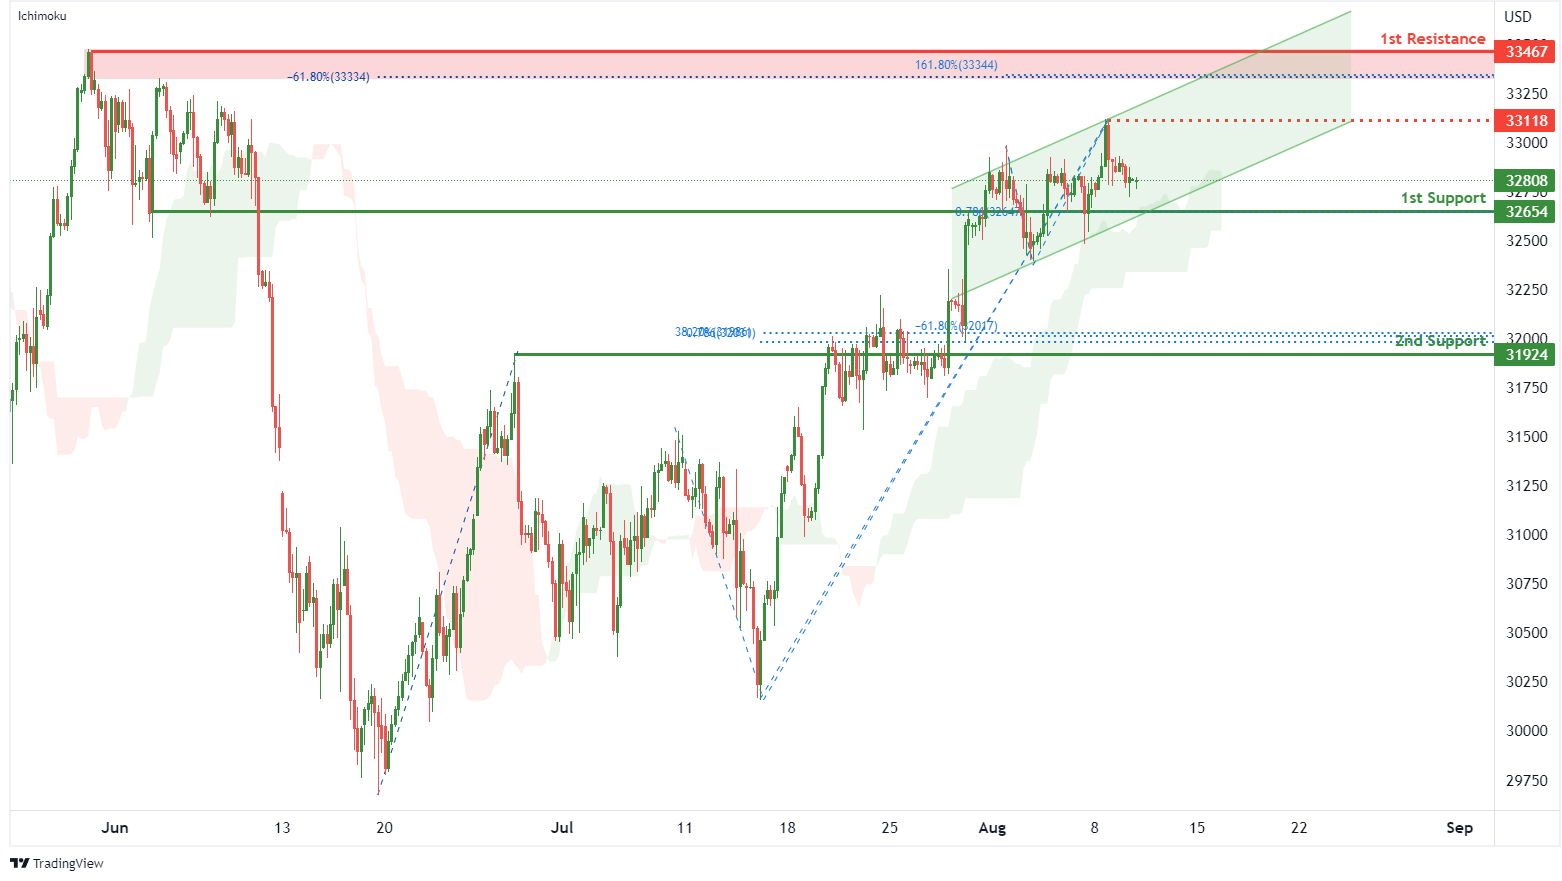
Dow Jones Industrial Average:
On the H4, with price moving above the ichimoku indicator and within an ascending channel, we have a bullish bias that price will rise from the 1st support at 32654 where the pullback support and 78.6% fibonacci projection are to the 1st resistance at 33467 where the swing high resistance, 161.8% fibonacci extension and -61.8% fibonacci expansion are. Take note of intermediate resistance at 33118 where the swing high resistance is. Alternatively, price could break 1st support structure and drop to 2nd support at 31924 where the pullback support, -61.8% fibonacci expansion, 38.2% fibonacci retracement and 78.6% fibonacci projection are.
Areas of consideration:
- H4 time frame, 1st resistance of 33467
- H4 time frame, 1st support at 32654
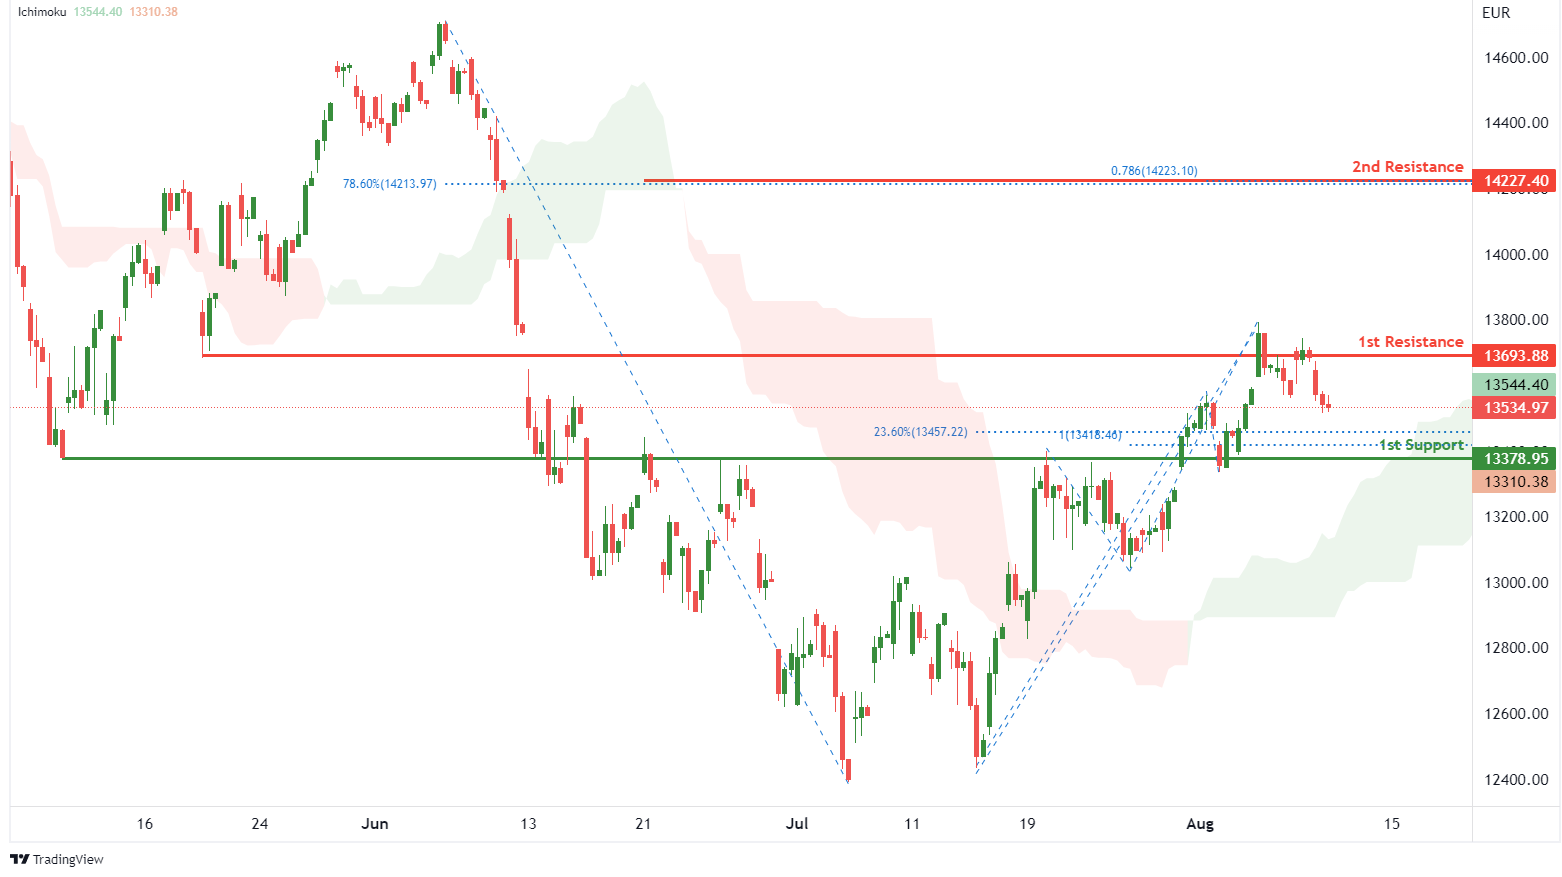
DAX:
On the H4, with price moving above the ichimoku indicator, we have a bullish bias that price will rise to 1st resistance at 13693.88 where the pullback resistance is. Once there is upside confirmation of price breaking 1st resistance structure, we would expect bullish momentum to carry price to 2nd resistance at 14227.40 in line with 78.6% fibonacci projection and 78.6% fibonacci retracement. Alternatively, price could drop to 1st support at 13378.95 where the overlap support, 100% fibonacci projection and 23.6% fibonacci retracement are.
Areas of consideration:
- H4 time frame, 1st resistance of 13693.88
- H4 time frame, 1st support at 13378.95
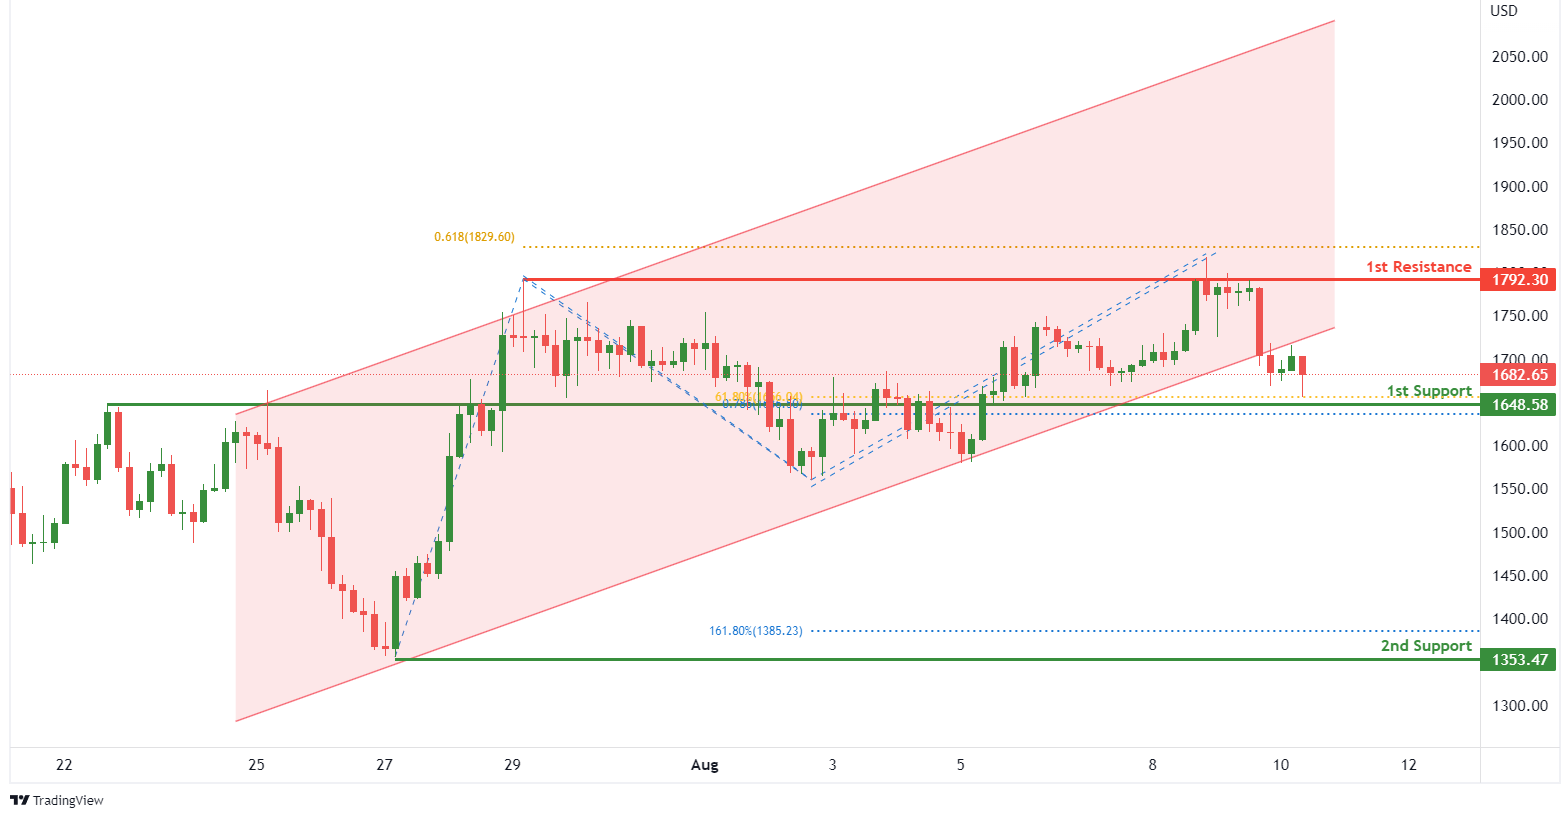
ETHUSD:
On the H4, with price breaking out of an ascending channel, we have a bearish bias that price will drop to 1st support at 1648.58 where the overlap support, 61.8% fibonacci retracement and 78.6% fibonacci projection are. Once there is downside confirmation that price has broken the 1st support structure, we would expect bearish momentum to carry price to 2nd support at 1353.47 where the swing low support and 161.8% fibonacci extension are. Alternatively,price could rise to 1st resistance at 1792.30 where the swing high resistance and 61.8% fibonacci projection are.
Areas of consideration:
- H4 time frame, 1st resistance of 1792.30
- H4 time frame, 1st support at 1648.58
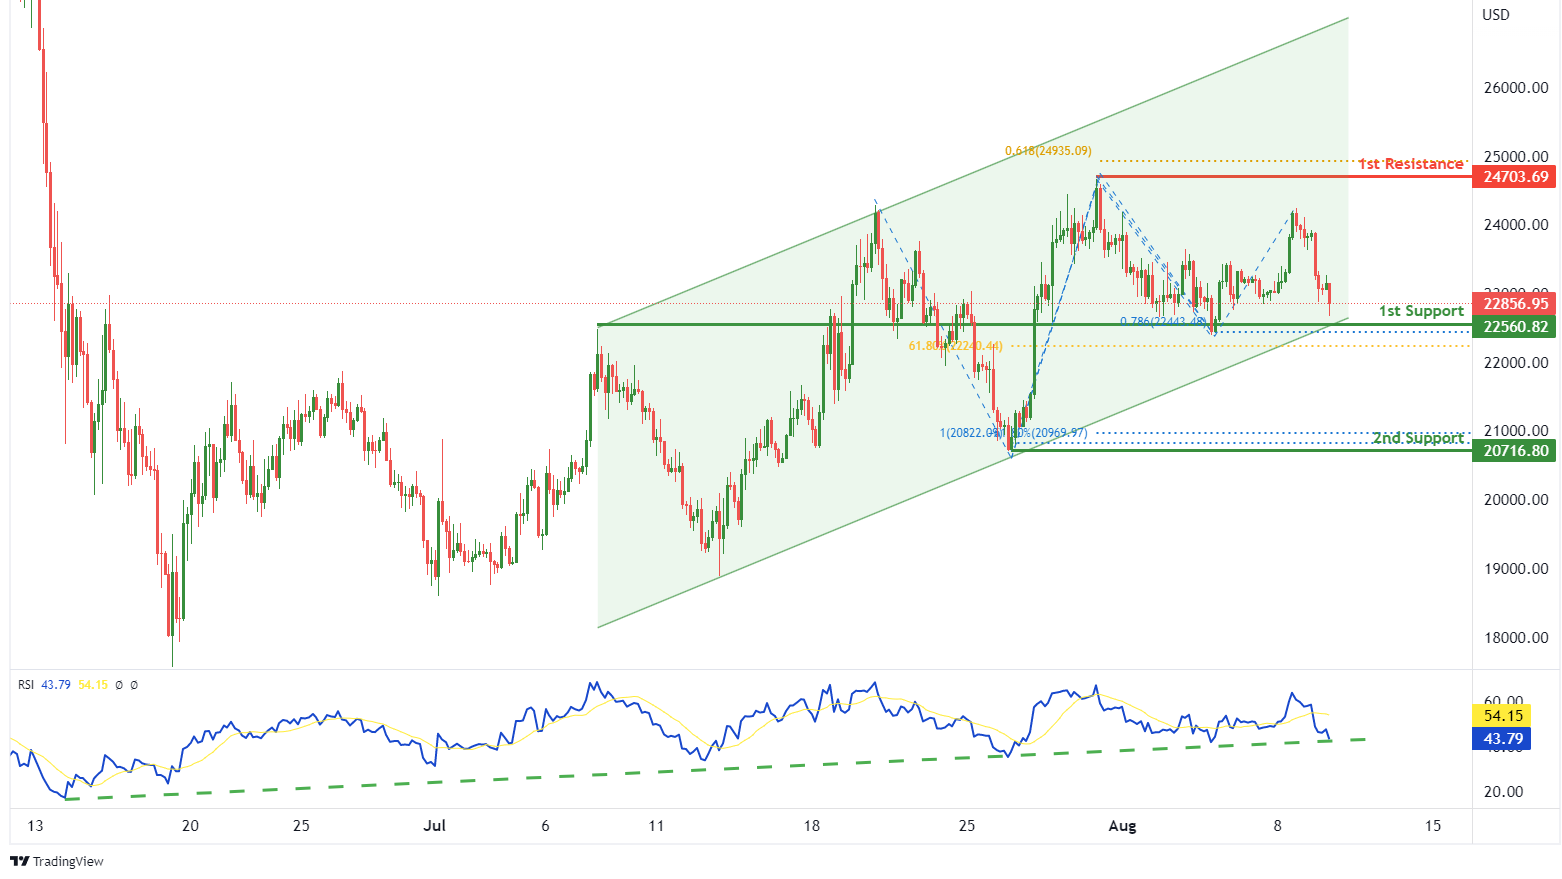
BTCUSD:
On the H4, with price moving within a bullish channel and RSI moving along an ascending trendline, we have a bullish bias that price will rise from our 1st support at 22560.82 where the pullback support, 61.8% fibonacci retracement and 78.6% fibonacci projection are to the 1st resistance at 24703.69 where the swing high resistance and 61.8% fibonacci projection are. Alternatively, price could break 1st support structure and drop to 2nd support at 20716.80 where the swing low support, -61.8% fibonacci expansion and 100% fibonacci projection are.
Areas of consideration:
- H4 time frame, 1st resistance of 24703.69
- H4 time frame, 1st support at 22560.82
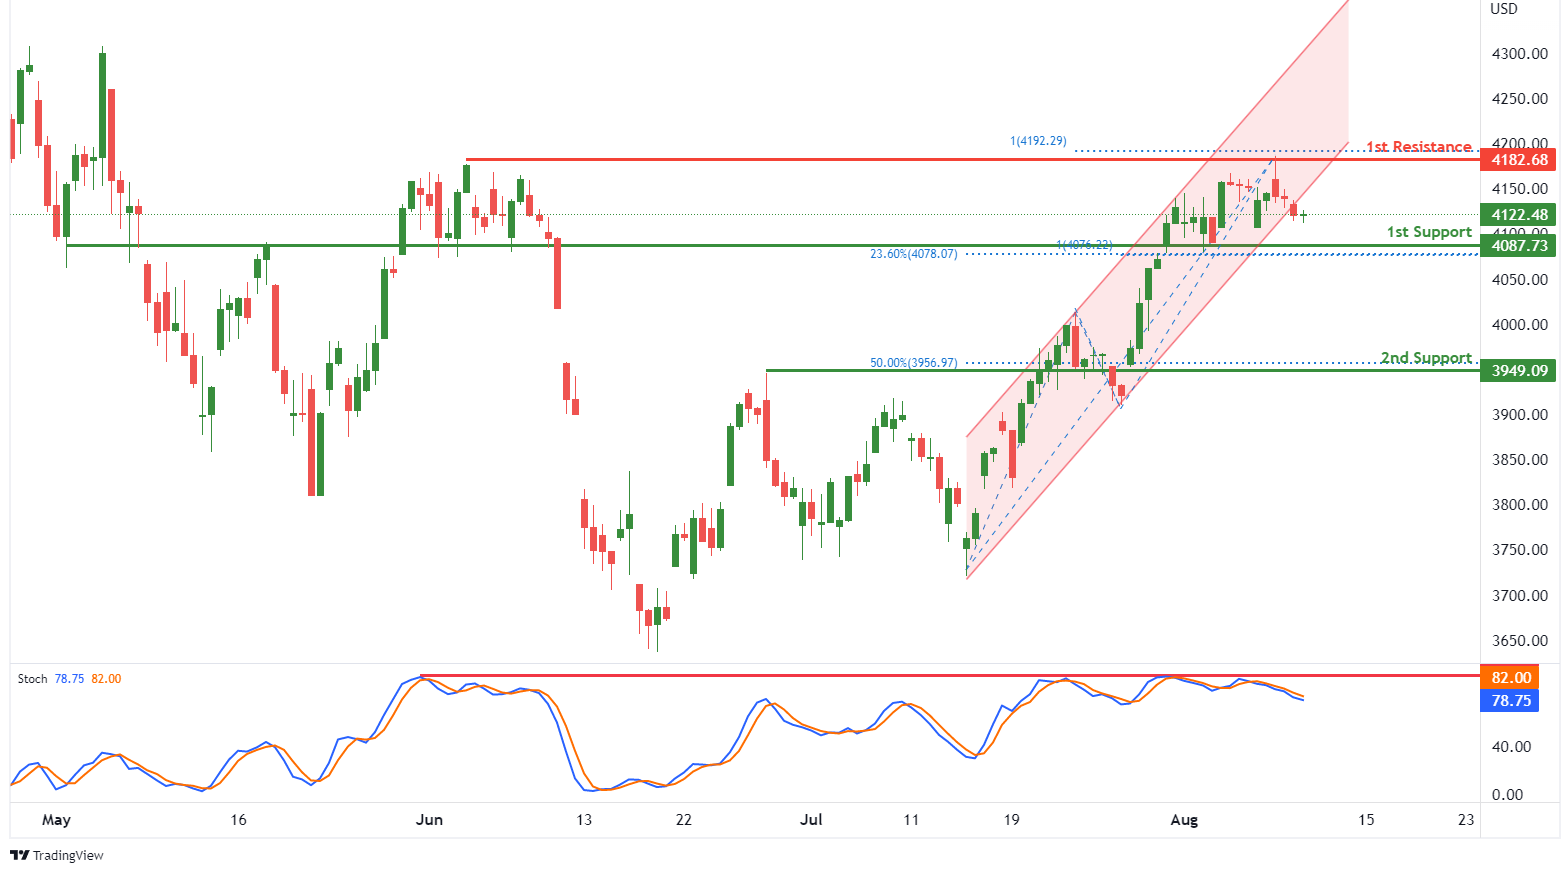
S&P 500:
On the H4, with price breaking out of the ascending channel and reversing off the stochastic resistance, we have a bearish bias that price will drop to our 1st support at 4087.73 where the overlap support, 23.6% fibonacci retracement and 100% fibonacci projection are. Once there is downside confirmation that price has broken the 1st support structure, we would expect bearish momentum to carry price to 2nd support at 3949.09 where the pullback support and 50% fibonacci retracement is. Alternatively, price could rise to 1st resistance at 4182.68 where the swing high resistance and 100% fibonacci projection are.
Areas of consideration:
- H4 time frame, 1st resistance of 4182.68
- H4 time frame, 1st support at 4087.73


