
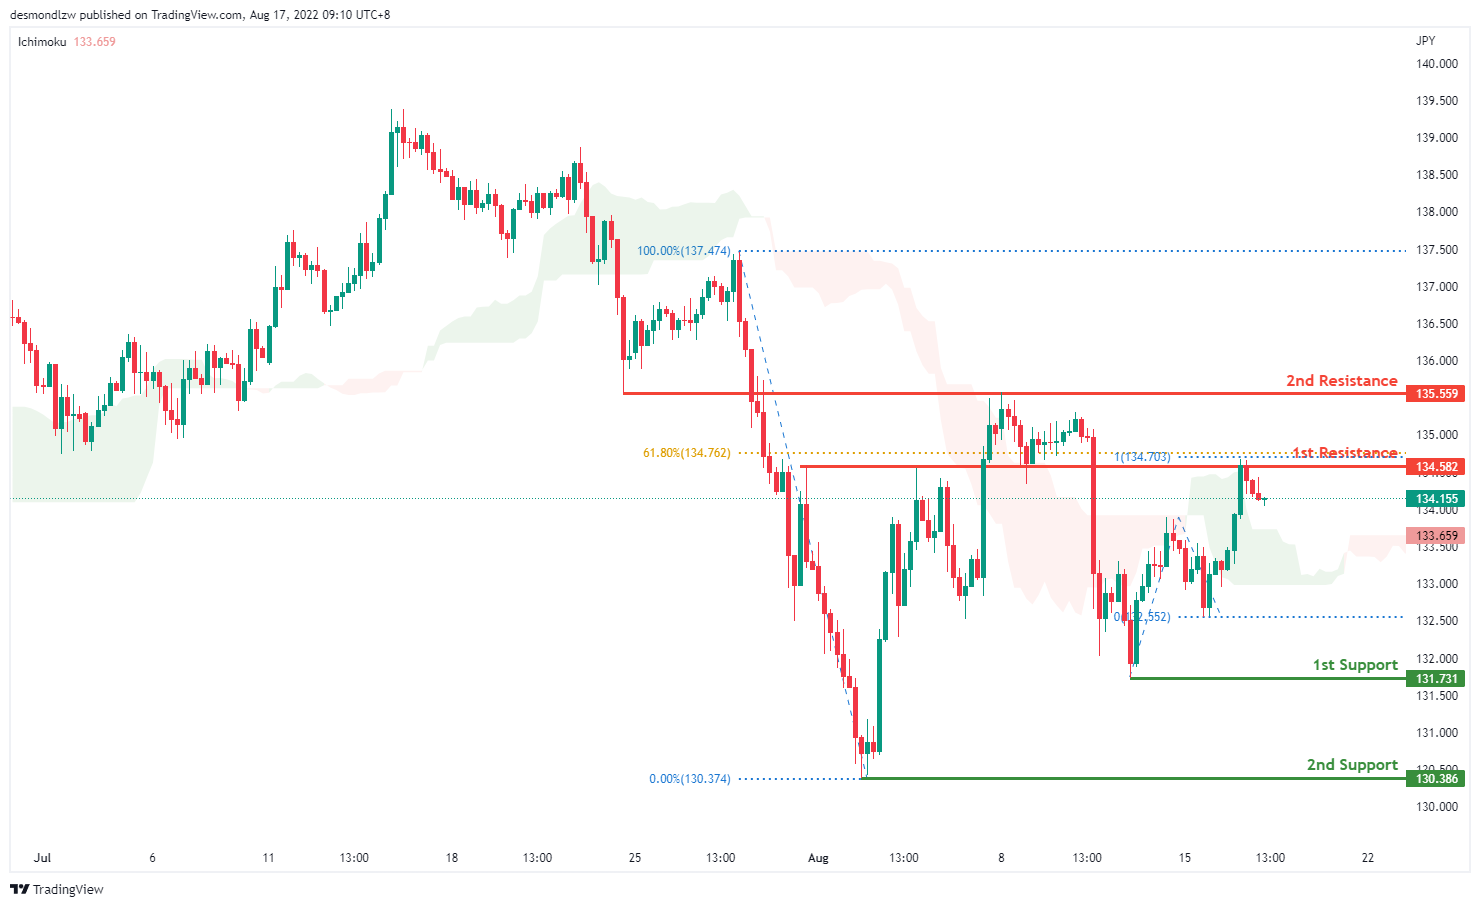
USD/JPY:
On the H4 chart, prices seem to have pulled back a little but the overall trend is still bearish biased. Price has broken the intermediate resistance at 133.908 which is the 50% Fibonacci retracement and is now testing the first resistance at 134.582 where the previous swing high. 61.8% fibonacci retracement and 100% projection sits.If the bearish momentum continues it will pull back to test the first support at 131.731
Areas of consideration:
- H4 time frame, 1st resistance at 134.582
- H4 time frame, 1st support at 131.731
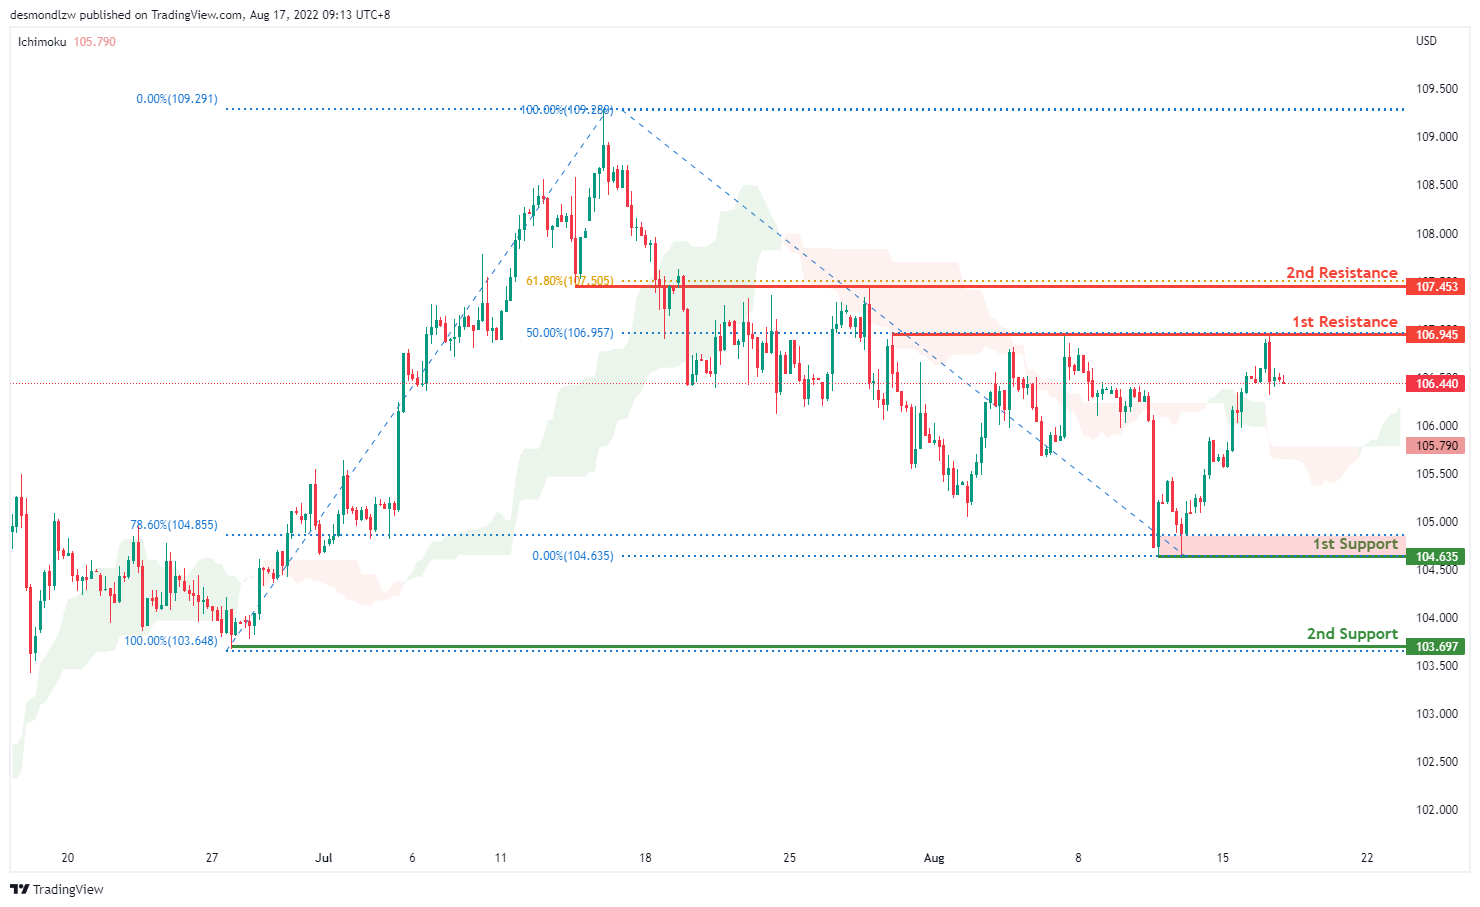
DXY:
On the H4, prices seem to be moving in an ascending trend and is in a bullish momentum. Prices has tested the first resistance at 106.945 where the 50% Fibonacci retracement and the previous swing high sits. If price continues with bullish momentum, it will test the second resistance at 107.453 where the 61.8% fibonacci retracement sits. If fails to break the first resistance, it will pull back to test the first support at 104.635 where the 78.6% retracement is and subsequently the second support at 103.697 which is the previous swing low
Areas of consideration:
- H4 time frame, 1st resistance at 106.945
- H4 time frame, 1st support at 104.635
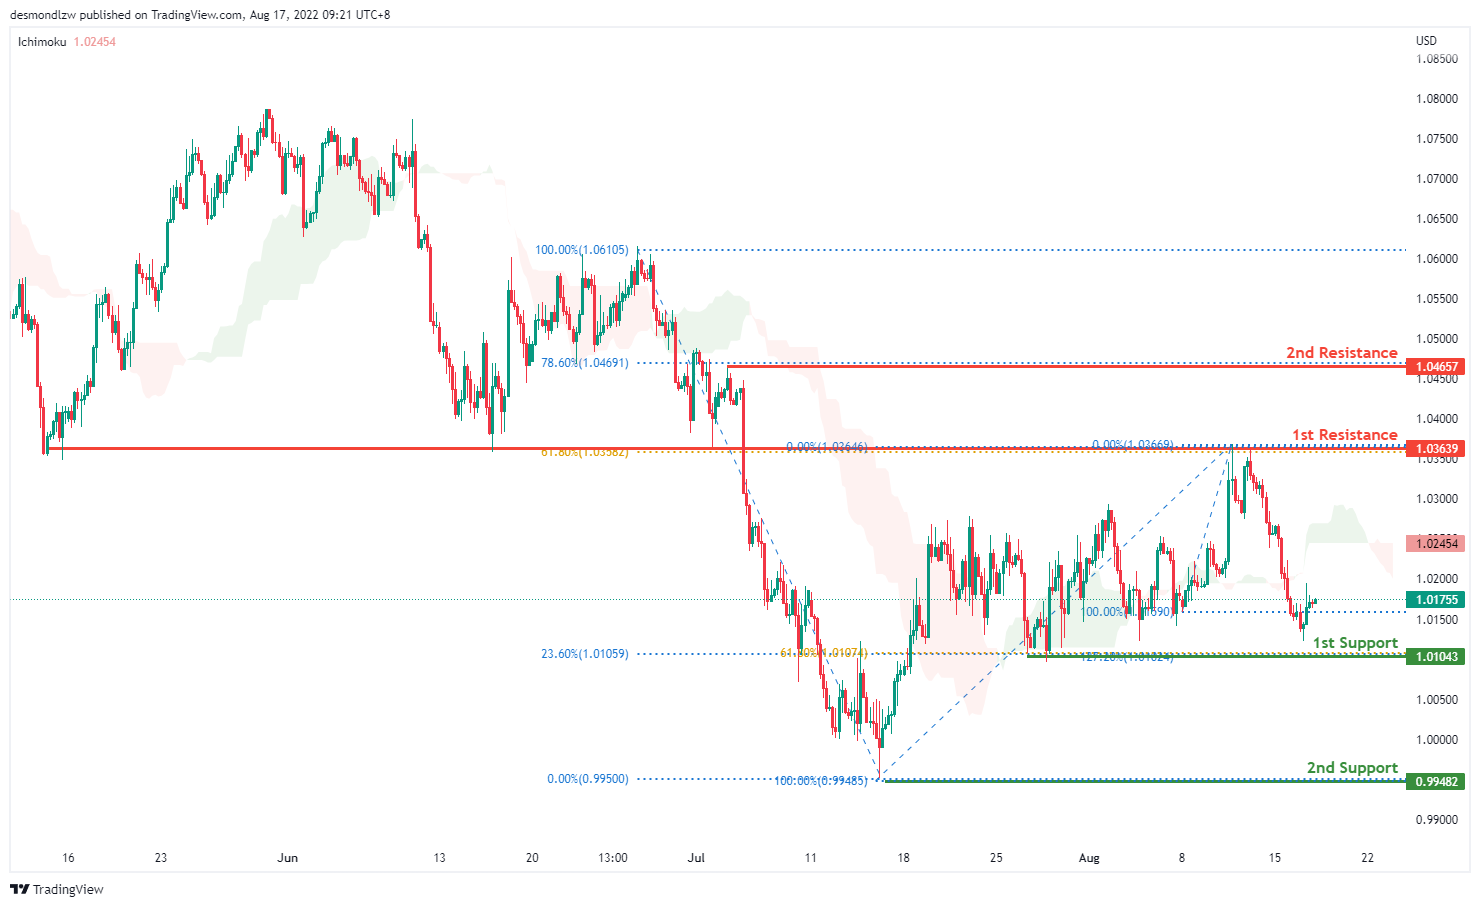
EUR/USD :
On the H4, prices have broken the ascending trend and are below the ichimoku indicator, we are bearish bias. Prices are pulling back to test the first support at 1.0104 where the 61.8% Fibonacci retracement and 127.2% extension sits. If prices continue in the bearish momentum, it will test the second support at 0.9952. Alternatively price could go back to test the first resistance at 1.0363 where the 61.8% Fibonacci retracement sits and then the second resistance at 1.0465
Areas of consideration :
- H4 1st resistance at 1.0363
- H4 1st support at 1.0104
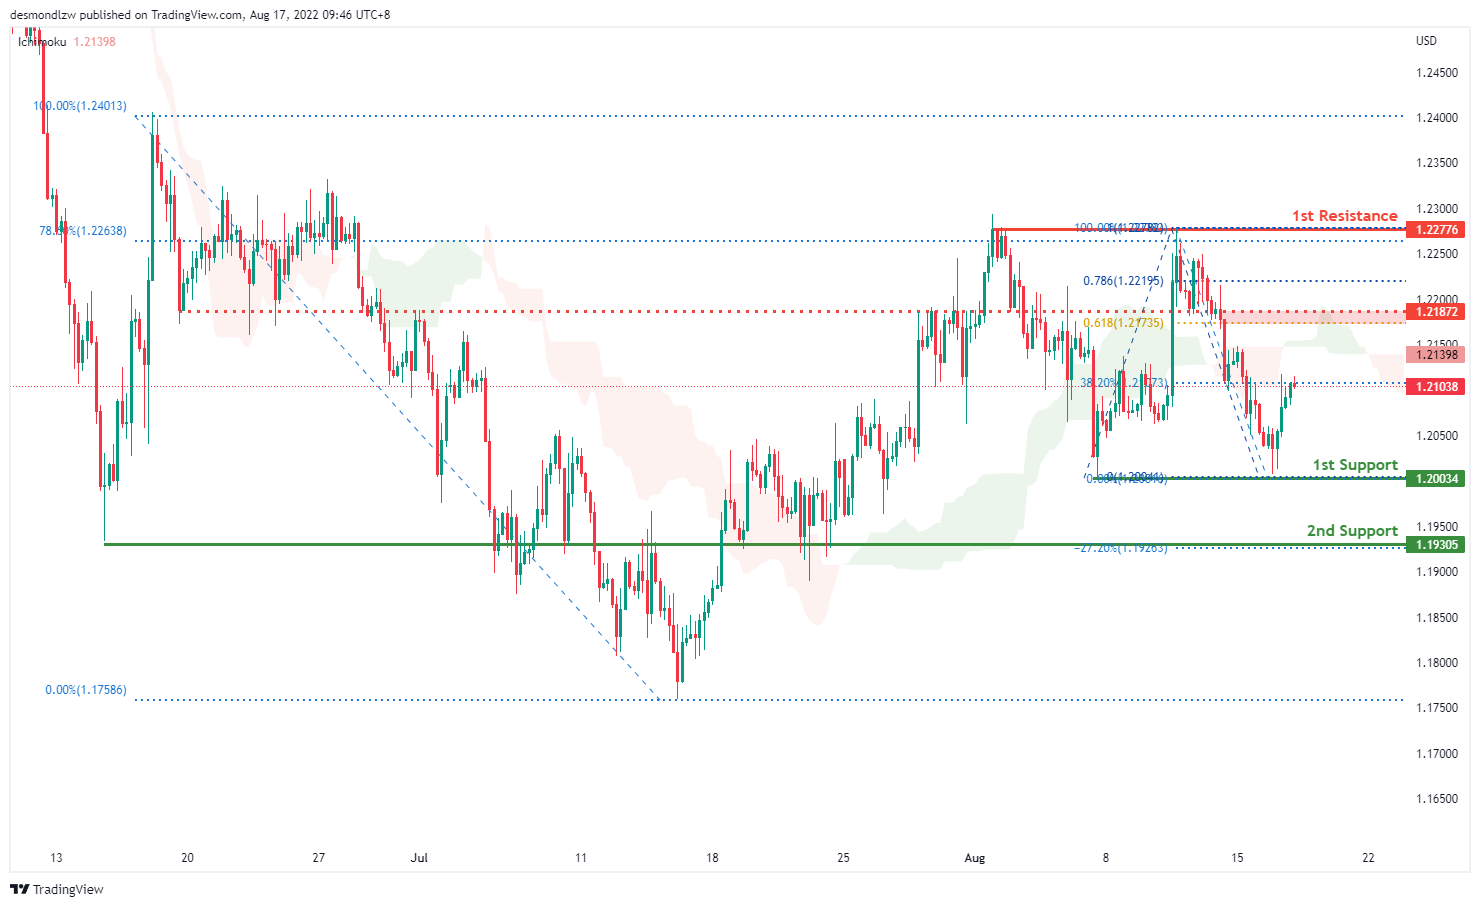
GBP/USD:
On the H4, prices seem to be in a bearish momentum. It is currently testing the 38.2% Fibonacci retracement and if the bearish momentum continues, it will pull prices to our first support 1.2003 where our swing low sits. If prices pull back further it will test the second support at 1.1930 where our 27.2% Fibonacci expansion sits. Alternatively price could hit our intermediate resistance at 1.2187 around the 61.8% projection and the first resistance at 1.2277 where the 78.6% Fibonacci retracement sits
Areas of consideration:
- H4 1st resistance at 1.2277
- H4 1st support at 1.2003
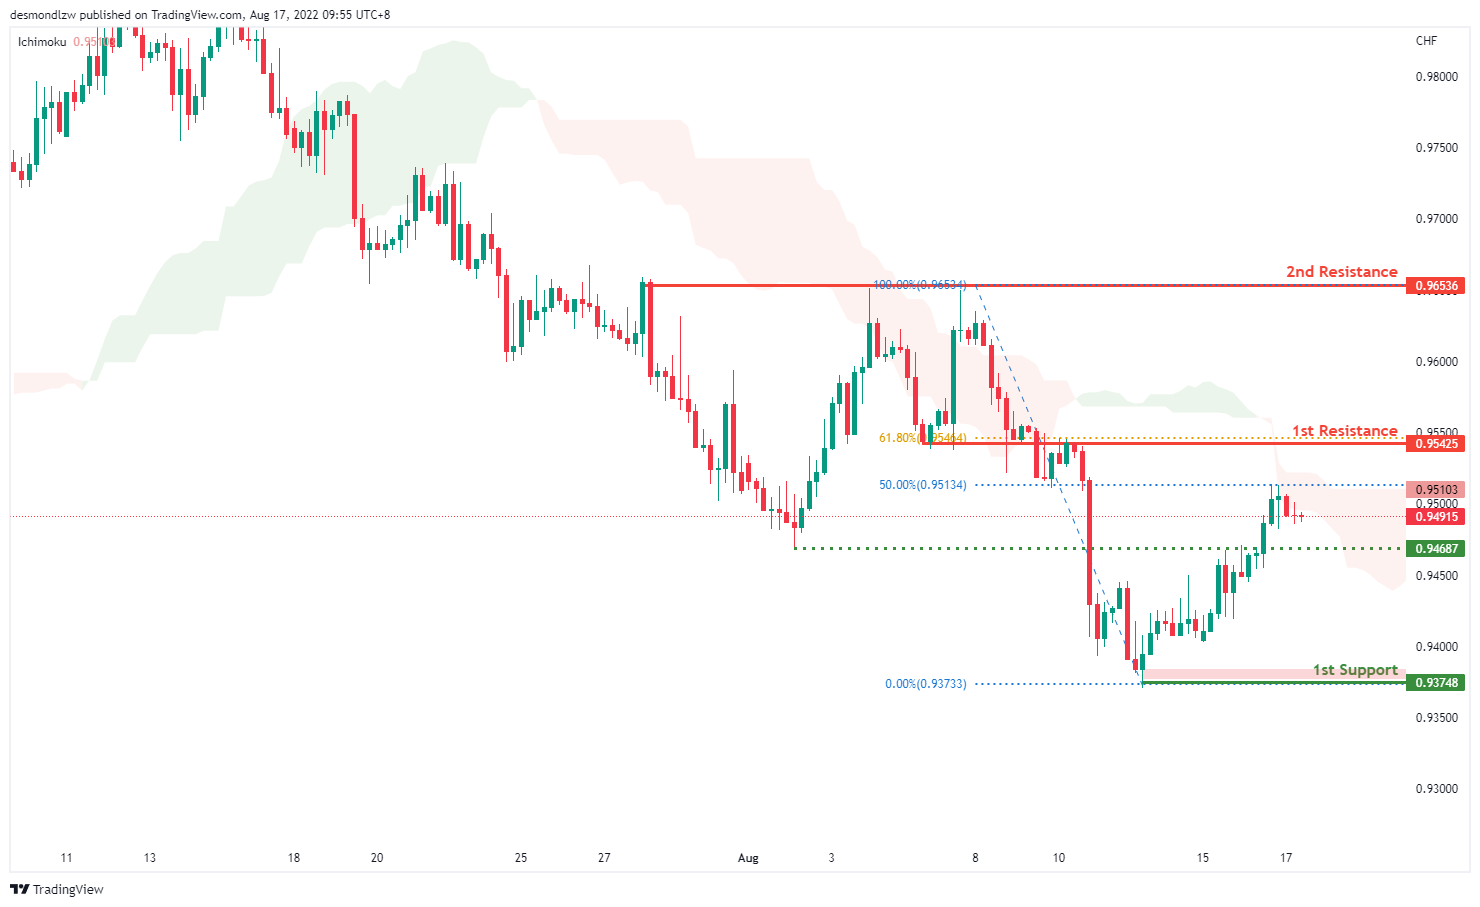
USD/CHF:
On the H4, with prices moving below the ichimoku cloud hence we have a bearish bias that the price will continue with the bearish momentum. Price is now testing at the 50% Fibonacci projection and it may rise to test the first resistance at 0.9542 where the 61.8% retracement sits. If bearish momentum continues, it should pull back to test at the intermediate support at 0.9468 where the previous swing low is then the first support at 0.9374
Areas of consideration
- H4 1st support at 0.937
- H4 1st resistance at 0.954
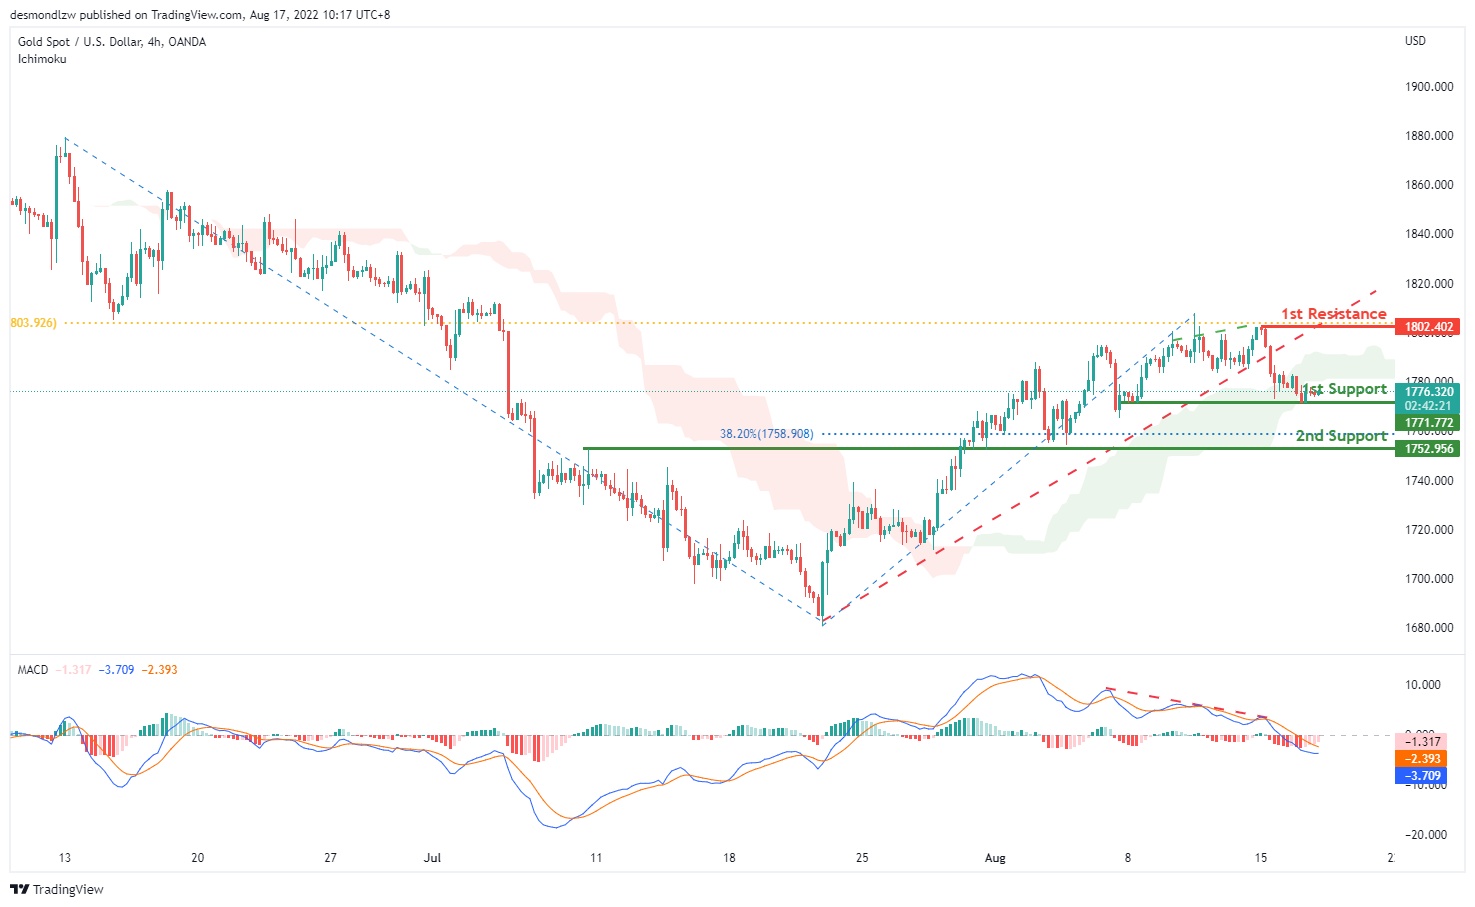
XAU/USD (GOLD):
On the H4, with prices breaking the ascending channel and there is a bearish divergence of price and MACD, we have a bearish bias that the price may drop from the 1st support at 1771.772, which is in line with the pullback support to the 2nd support at 1752.956, which is in line with the pullback support and 38.2% fibonacci retracement. Alternatively, the price may rise to the 1st resistance at 1802.402, which is in line with the 61.8% fibonacci retracement and swing high.
Areas of consideration:
- H4 time frame, 1st support at 1771.772
- H4 time frame, 2nd support at 1752.956
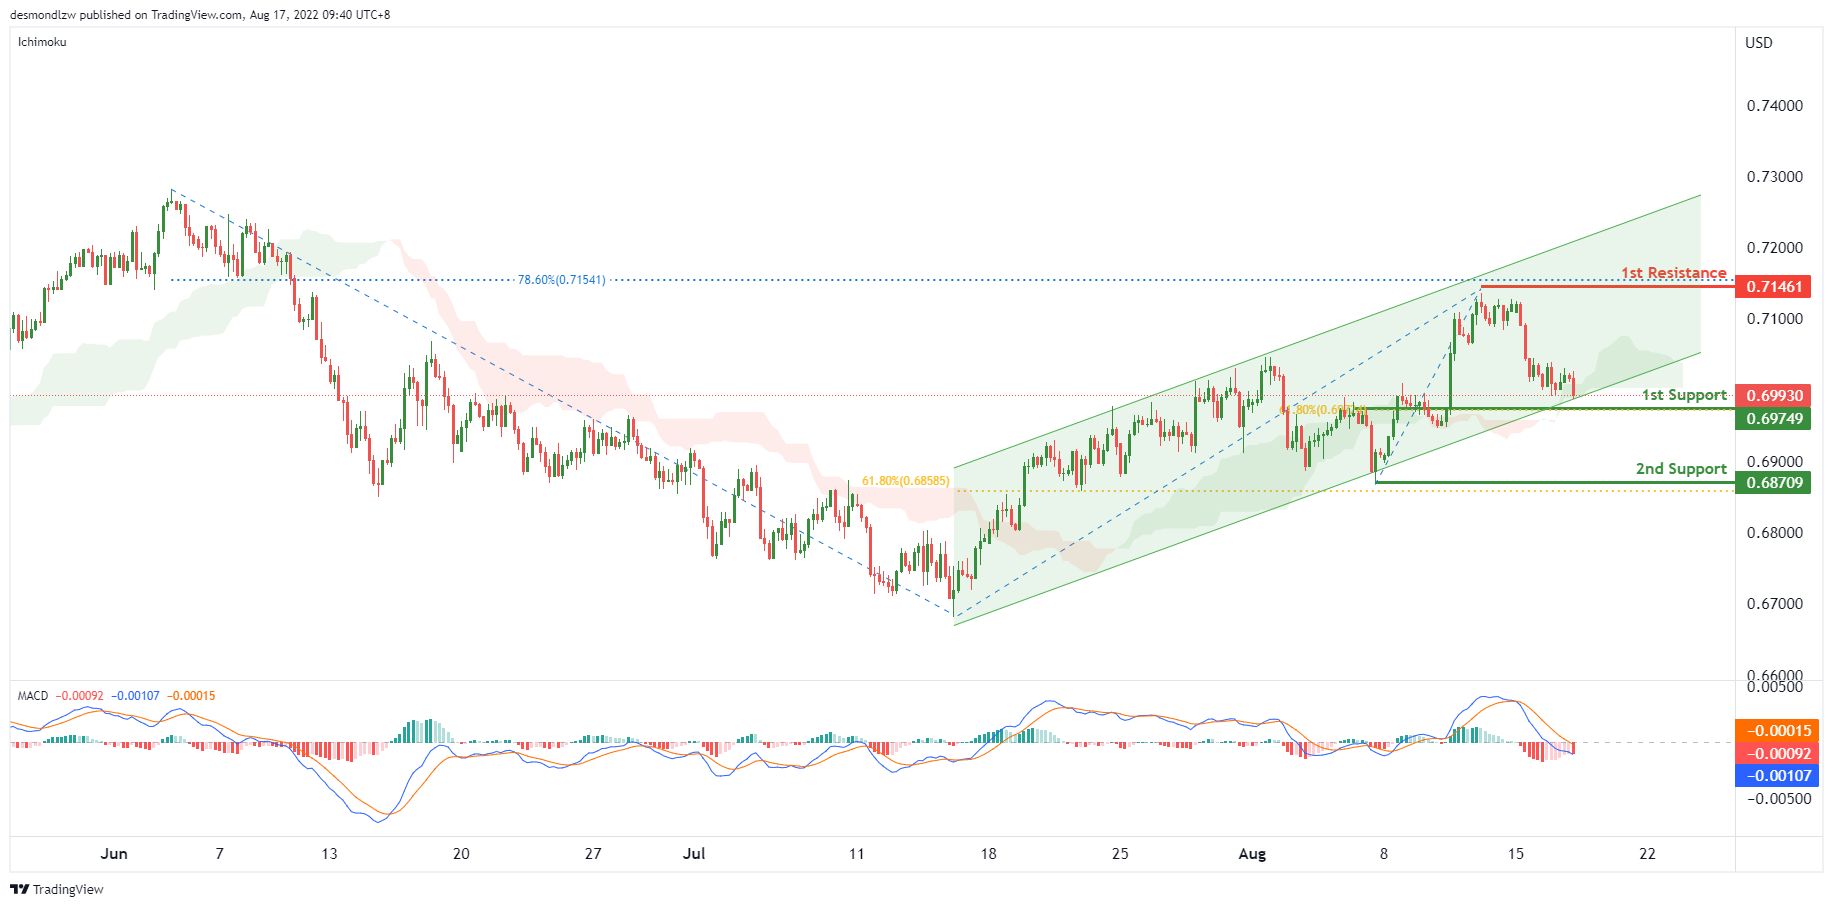
AUD/USD:
On the H4, with the MACD indicators are under zero, the price almost breaking the ascending channel and crossing below the ichimoku cloud, we have a bearish bias that price may drop from the 1st support at 0.69749, where the 61.80% fibonacci retracement and pullback resistance are to the 2nd support at 0.68709, which is in line with the swing low and 61.8% fibonacci retracement. Alternatively, the price may stay in the ascending channel and rise to the 1st resistance at 0.71461 which is in line with 78.6% fibonacci retracement and swing high.
Areas of consideration
- H4 1st support at 0.69749
- H4 2nd support at 0.68709
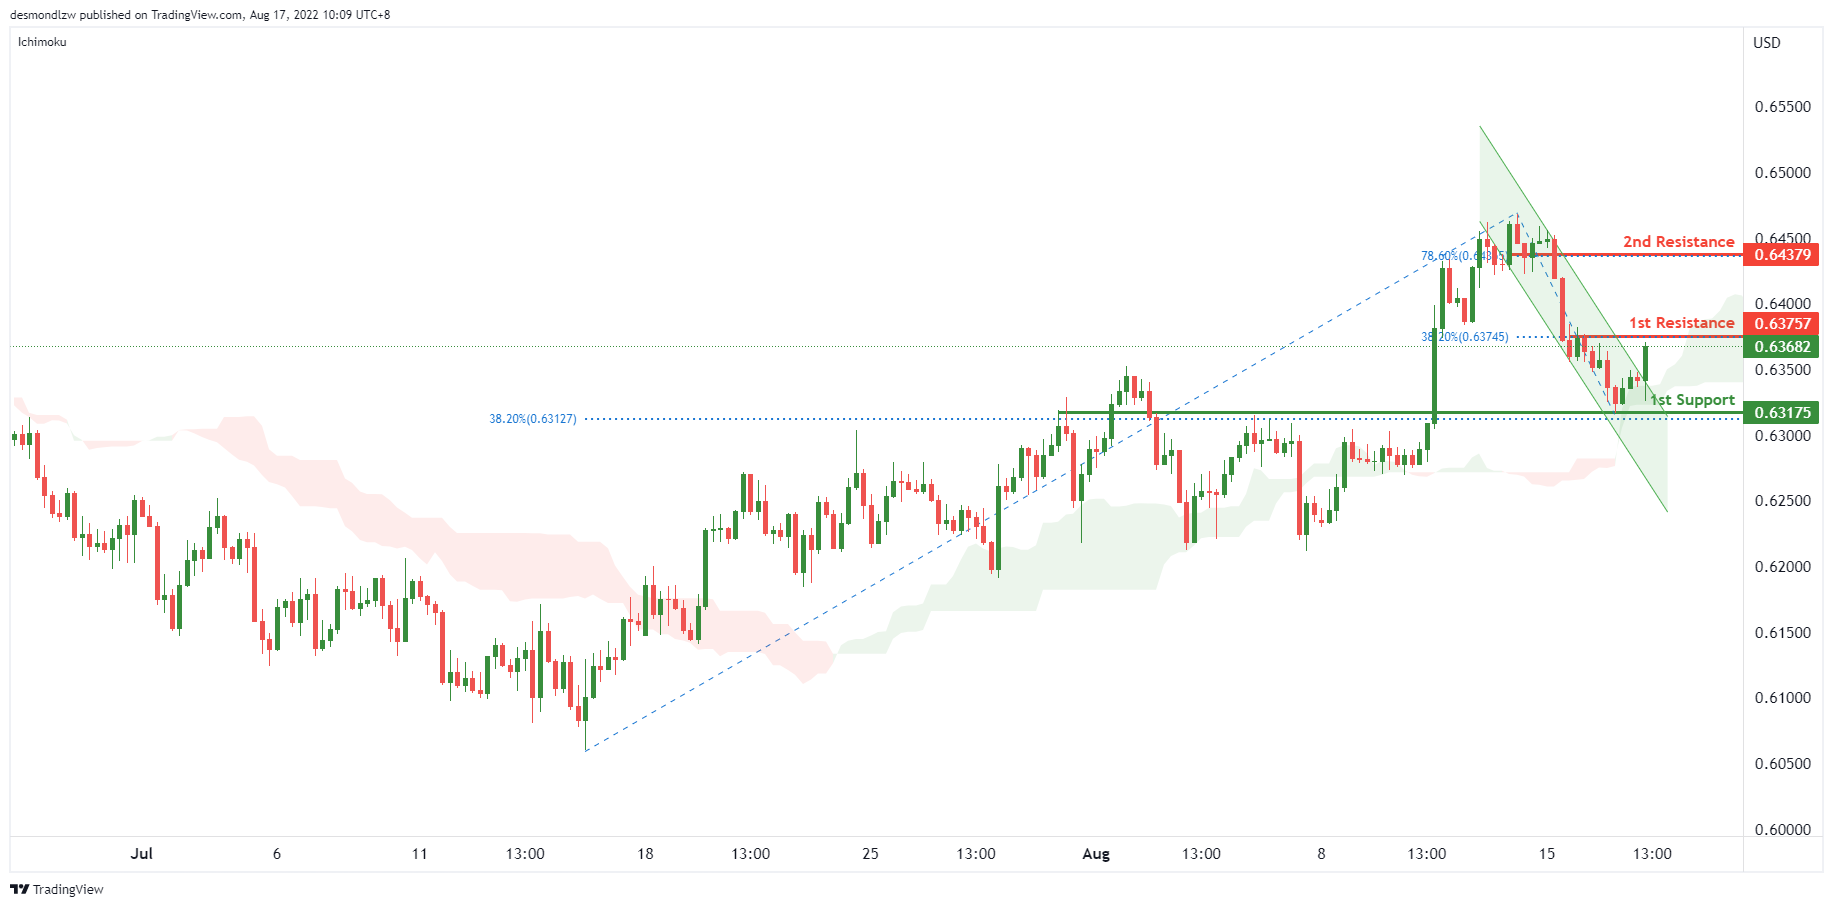
NZD/USD:
On the H4, with the price breaking the descending channel and above ichimoku cloud, we have a bullish bias that the price may rise from the 1st resistance at 0.63757, which is in line with the 38.2% fibonacci retracement to the 2nd resistance at 0.64379, which is in line with the 78.6% fibonacci retracement. Alternatively, the price may drop to the 1st support at 0.63175, where the 38.2% fibonacci retracement and pullback support is.
Areas of consideration:
- H4 time frame, 1st resistance at 0.63757
- H4 time frame, 2nd resistance at 0.64379
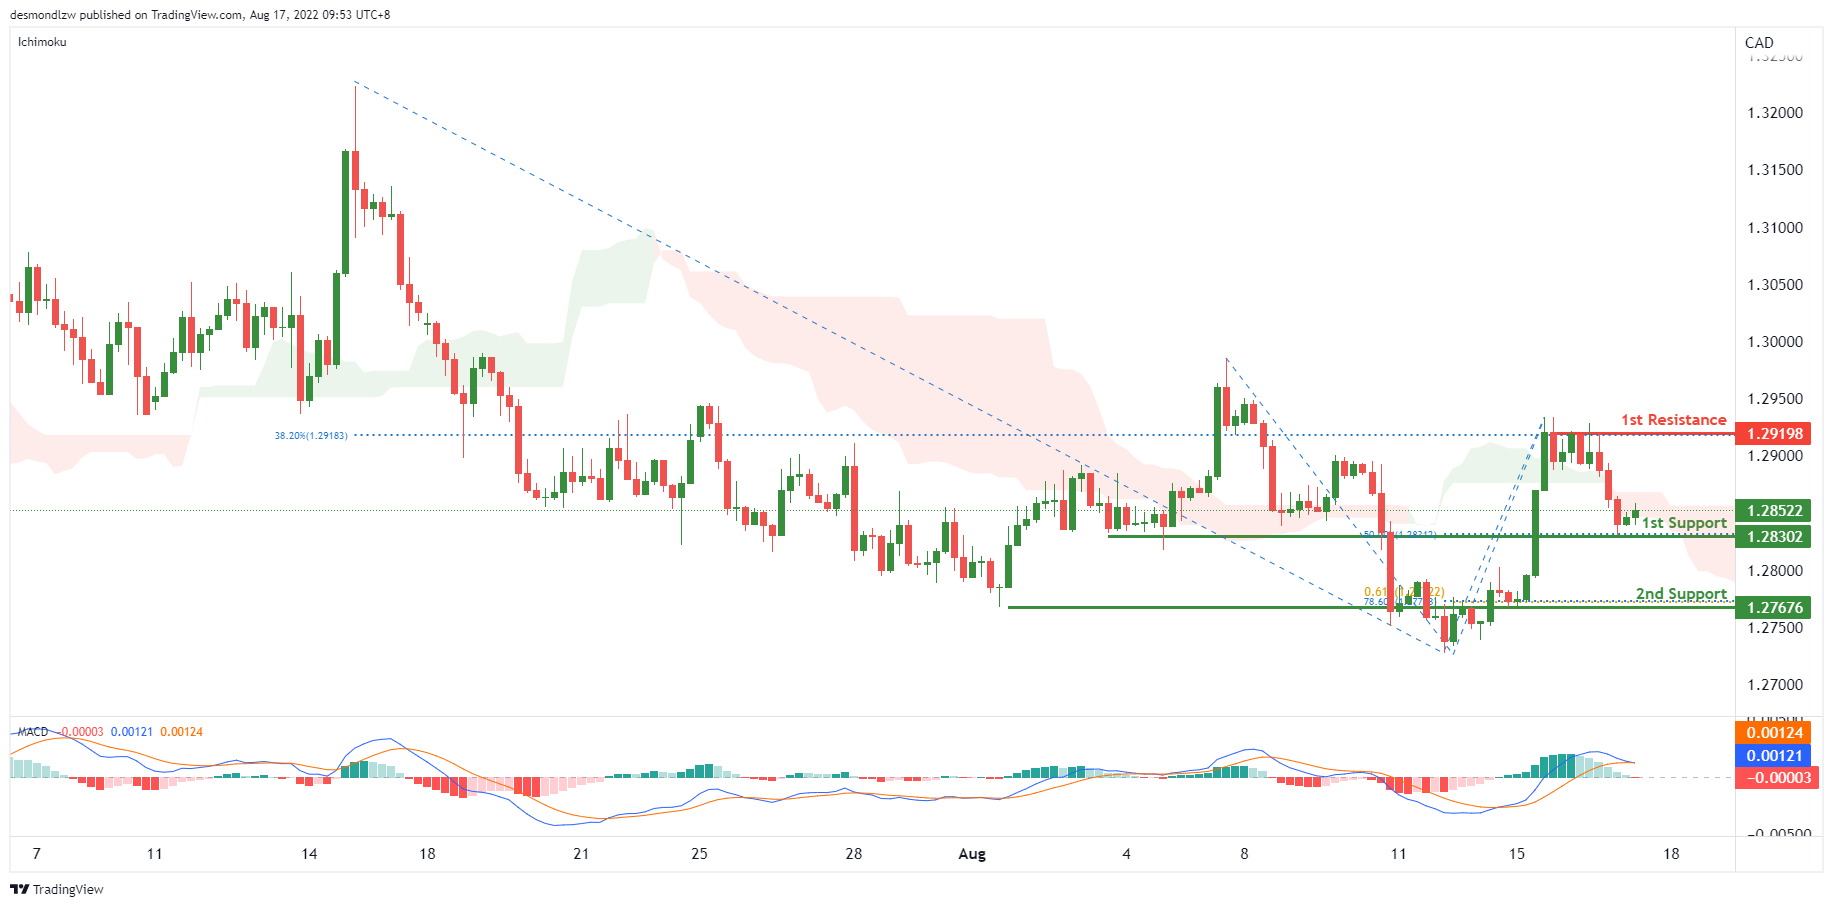
USD/CAD:
On the H4, with DIF is crossing below the signal line and the price is crossing over the ichimoku cloud, we have a bearish bias that the price may drop from the 1st support at 1.28302, which is in line with the 50% fibonacci retracement to the 2nd support at 1.27676, which is in line with the swing low, 78.6% fibonacci retracement and 61.8% fibonacci projection. Alternatively, the price may rise to the 1st resistance at 1.29198, which is in line with the 38.2% fibonacci retracement and swing high.
Areas of consideration:
- H4 time frame, 1st support at 1.28302
- H4 time frame, 2nd support at 1.27676
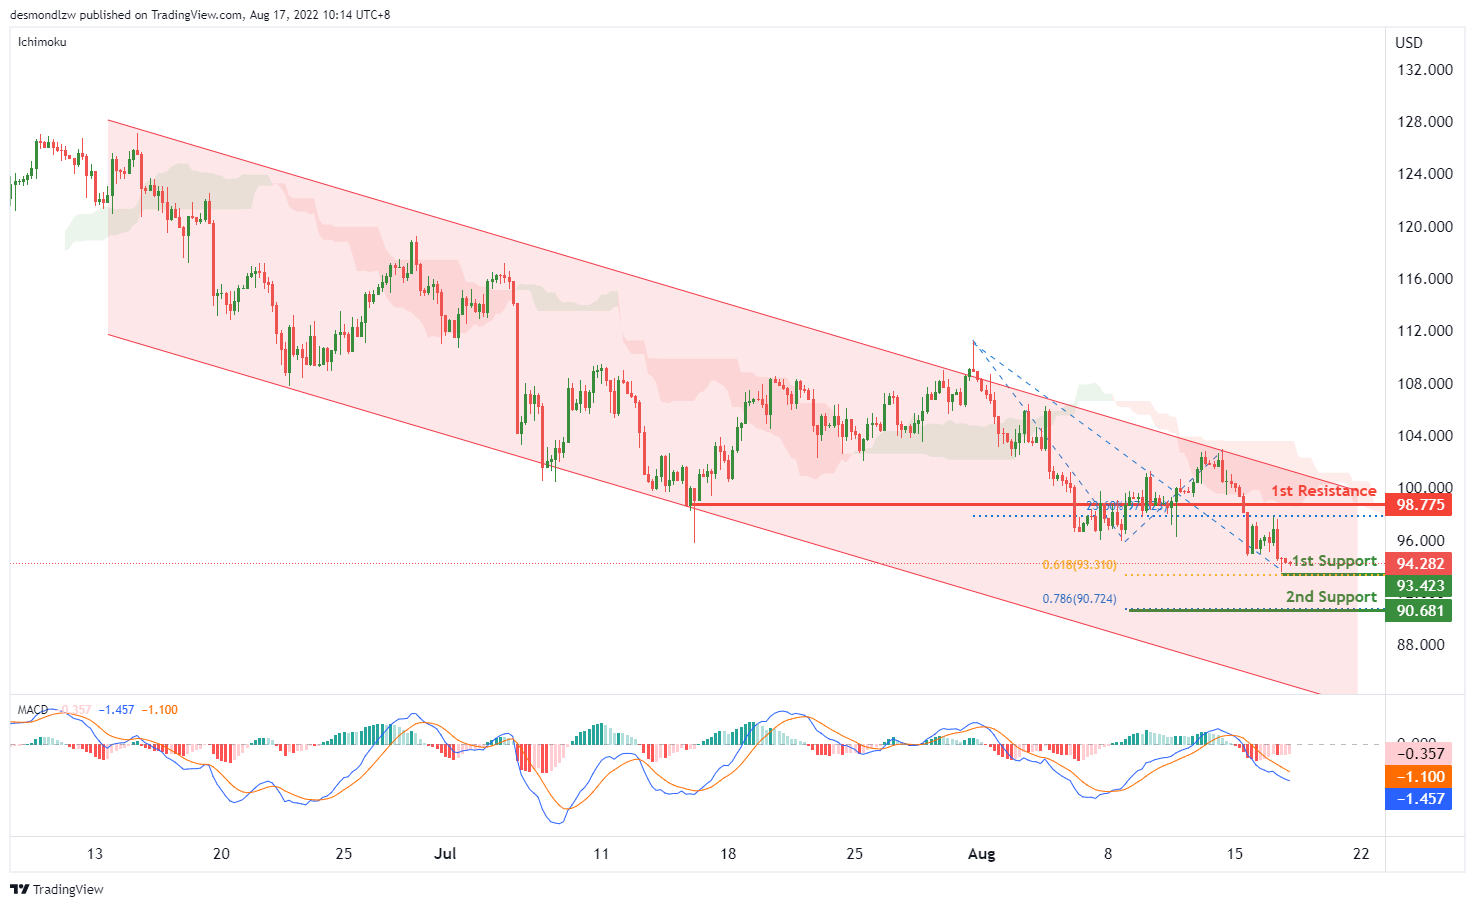
OIL:
On the H4, with price moving within the descending channel, below ichimoku cloud and the MACD indicators are under zero, we have a bearish bias that the price may drop from our 1st support at 93.423, which is in line with the swing low and 61.8% fibonacci projection to the 2nd support at 90.681, which is in line with the 78.6% fibonacci projection. Otherwise, the price may rise to our 1st resistance at 98.775, which is in line with the overlap resistance and 23.6% fibonacci retracement.
Areas of consideration:
- H4 time frame, 1st support at 93.423
- H4 time frame, 2nd support at 90.681
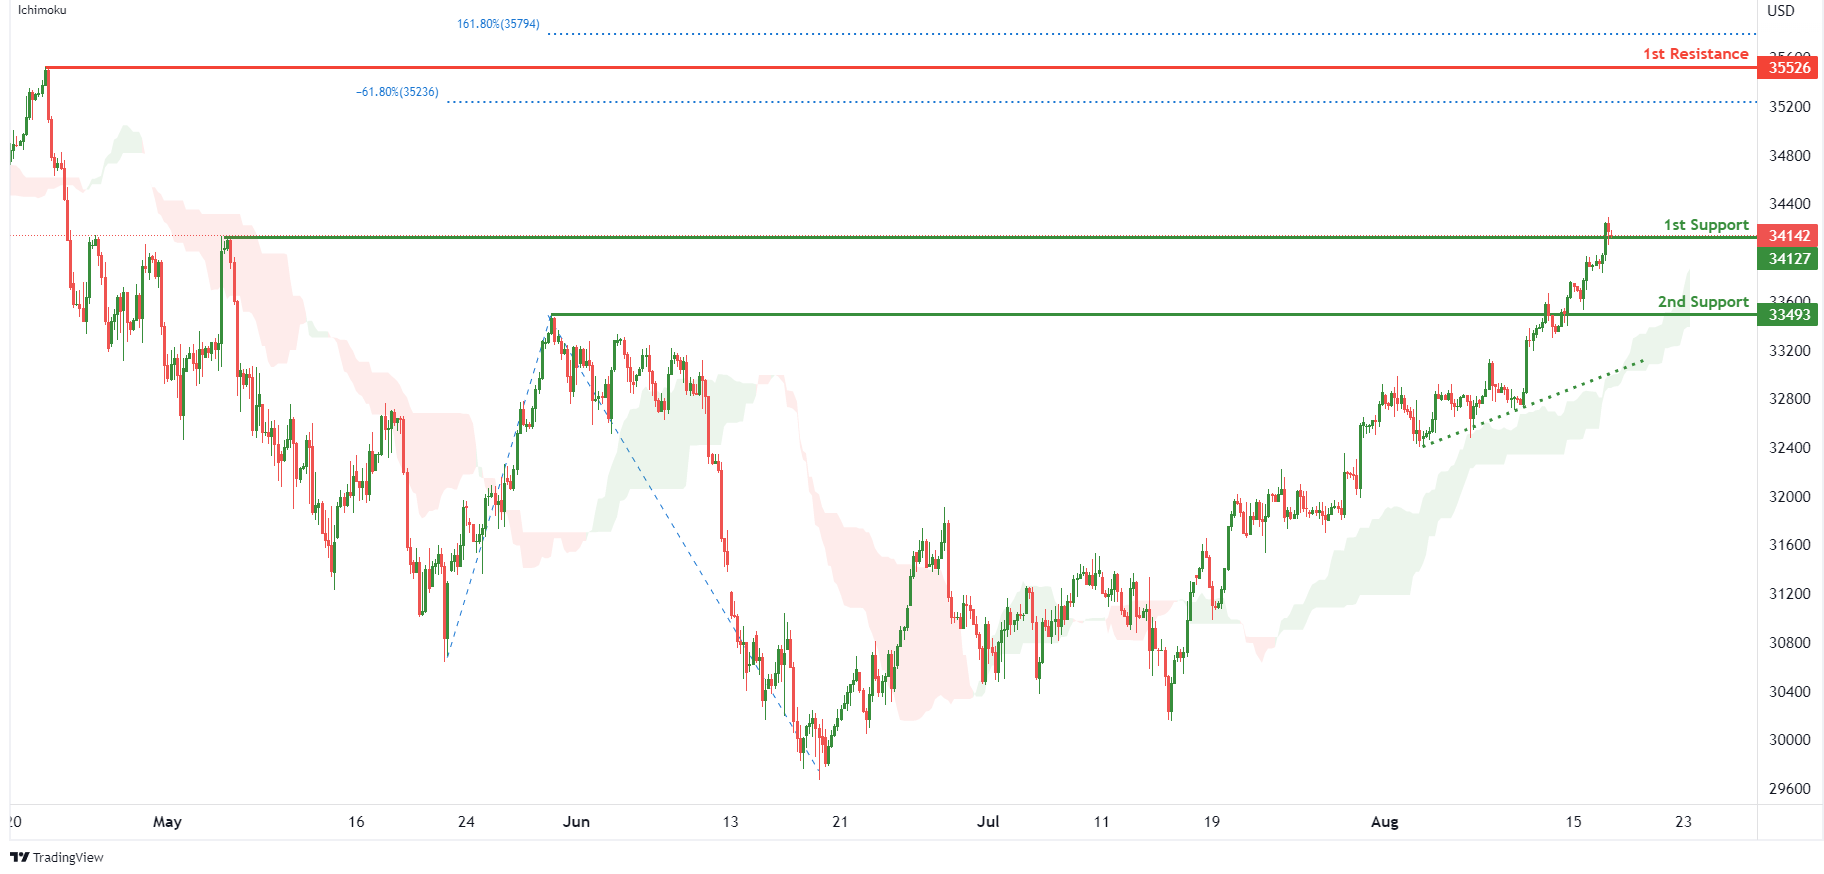
Dow Jones Industrial Average:
On the H4, with price moving above the ichimoku indicator and along an ascending trendline, we have a bullish bias that price will rise from our 1st support at 34127 where the pullback support is to the 1st resistance at 35526 where the swing high resistance, 161.8% fibonacci extension and -61.8% fibonacci expansion are. Alternatively, price could break 1st support and drop to 2nd support at 33493 where the pullback support is.
Areas of consideration:
- H4 time frame, 1st resistance of 35526
- H4 time frame, 1st support at 34127
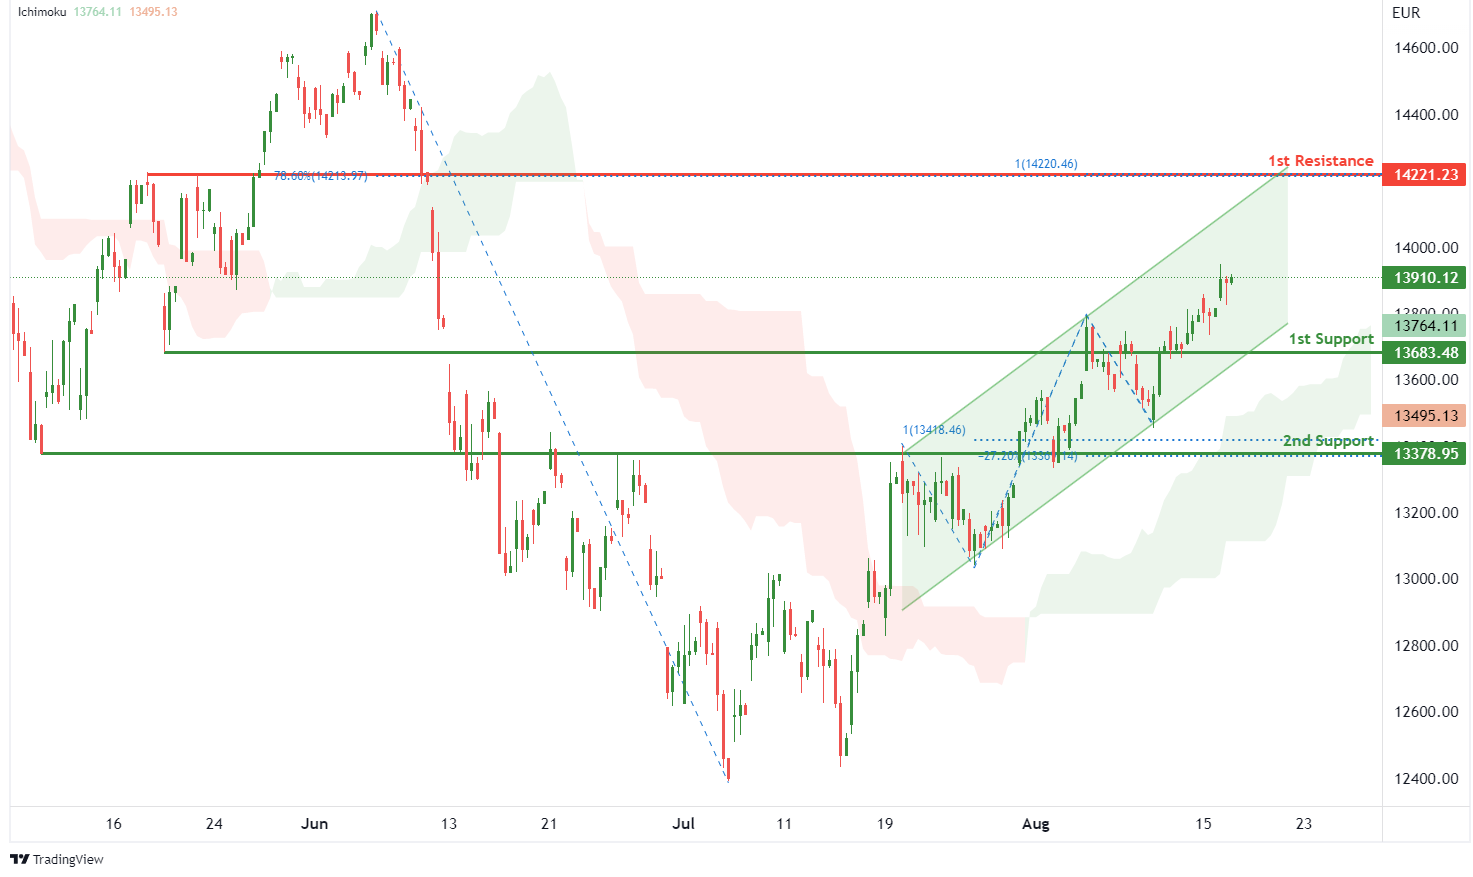
DAX:
On the H4, with price moving above the ichimoku indicator and within the ascending channel, we have a bullish bias that price will rise from 1st support at 13683.48 where the pullback support is to the 1st resistance at 14221.23 in line with 100% fibonacci projection and 78.6% fibonacci retracement. Alternatively, price could break 1st support and drop to 2nd support at 13378.95 where the overlap support, -27.2% fibonacci expansion and 100% fibonacci projection are.
Areas of consideration:
- H4 time frame, 1st resistance of 14221.23
- H4 time frame, 1st support at 13683.48
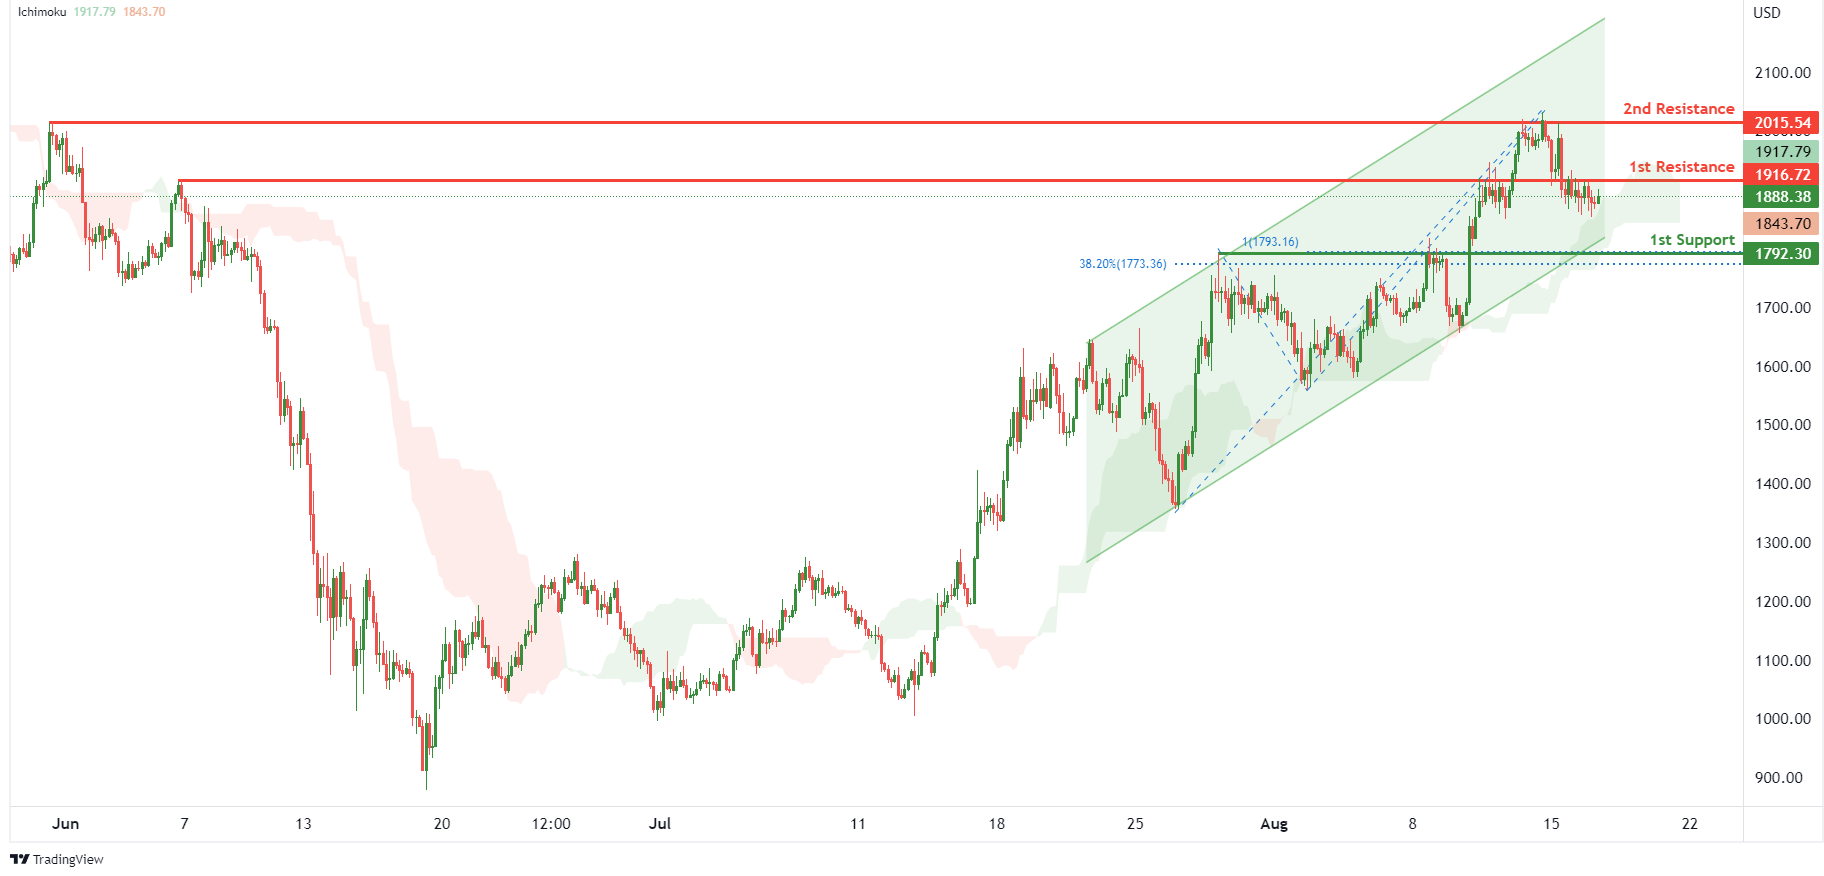
ETHUSD:
On the H4, with price moving within an ascending channel and bouncing off the ichimoku indicator, we have a bullish bias that price will rise to the 1st resistance at 1916.72 where the pullback support is. Once there is upside confirmation that price has broken 1st resistance structure, we would expect bullish momentum to carry price to 2nd resistance at 2015.54 where the swing high resistance is. Alternatively, price could drop to 1st support at 1792.30 where the overlap support, 38.2% fibonacci retracement and 100% fibonacci projection are.
Areas of consideration:
- H4 time frame, 1st resistance of 1916.72
- H4 time frame, 1st support at 1792.30
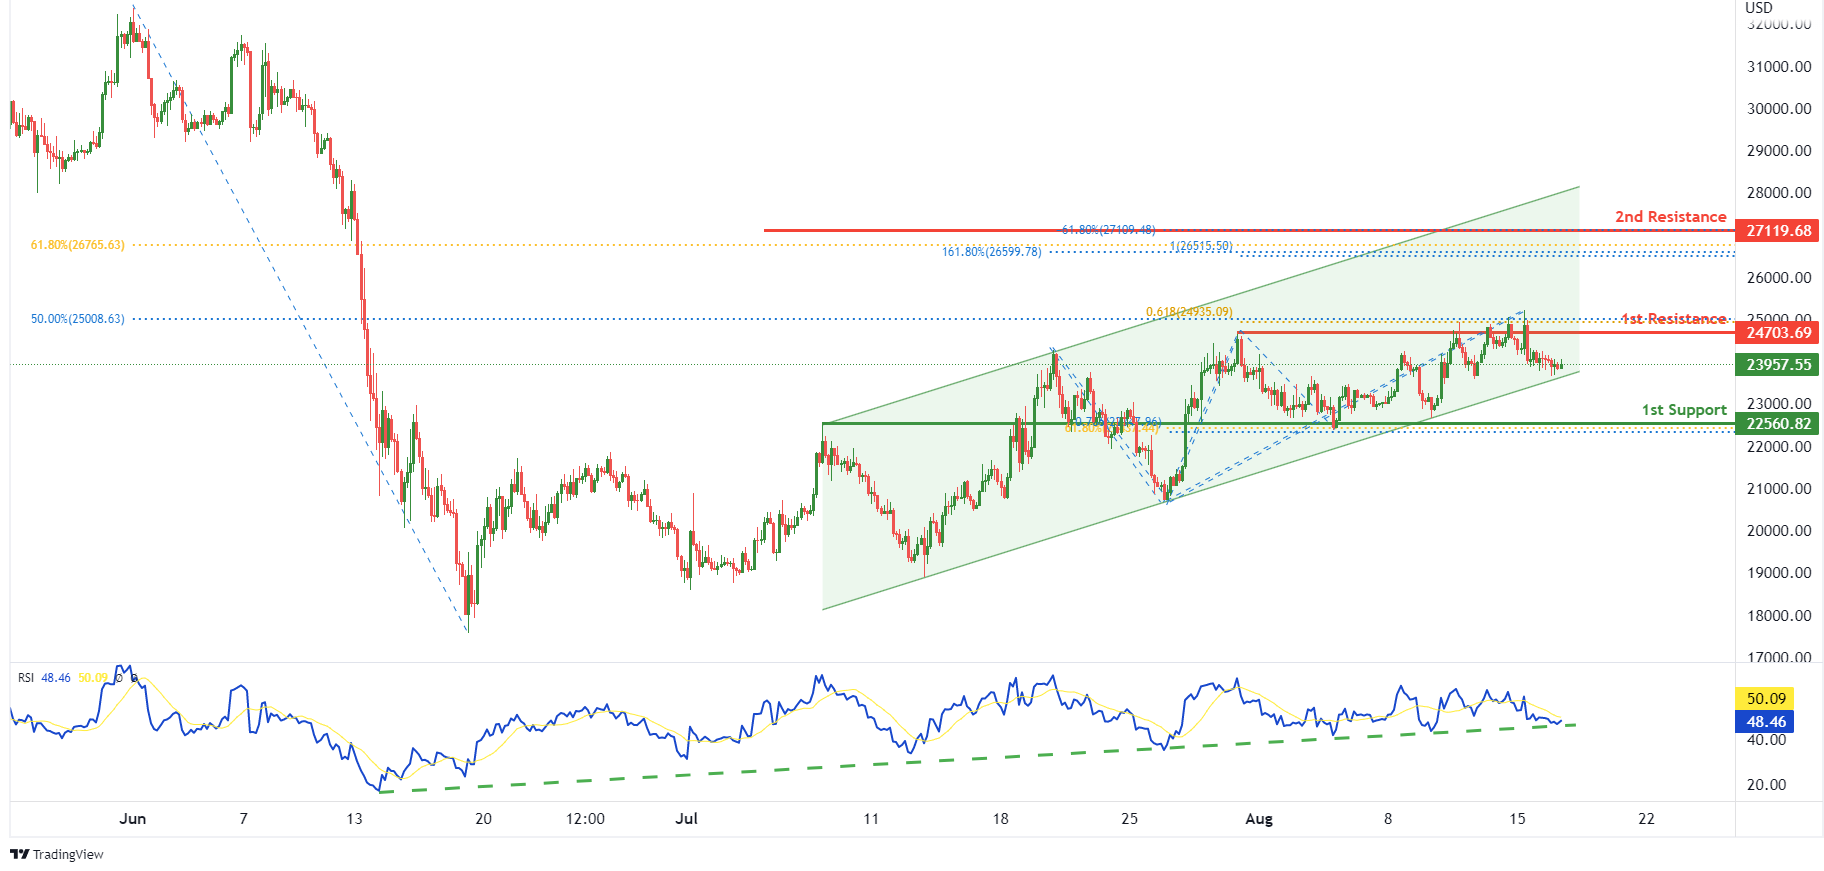
BTCUSD:
On the H4, with price moving within a bullish channel and RSI moving along an ascending trendline, we have a bullish bias that price will rise to our 1st resistance at 24703.69 where the pullback resistance, 50% fibonacci retracement and 61.8% fibonacci projection are. Once there is upside confirmation that price has broken 1st resistance structure, we would expect bullish momentum to carry price to 2nd resistance at 27119.68 where the 61.8% fibonacci retracement, -61.8% fibonacci expansion, 161.8% fibonacci extension and 100% fibonacci projection are. Alternatively, price could drop to 1st support at 22560.82 where the pullback support, 61.8% fibonacci retracement and 78.6% fibonacci projection are.
Areas of consideration:
- H4 time frame, 1st resistance of 24703.69
- H4 time frame, 1st support at 22560.82
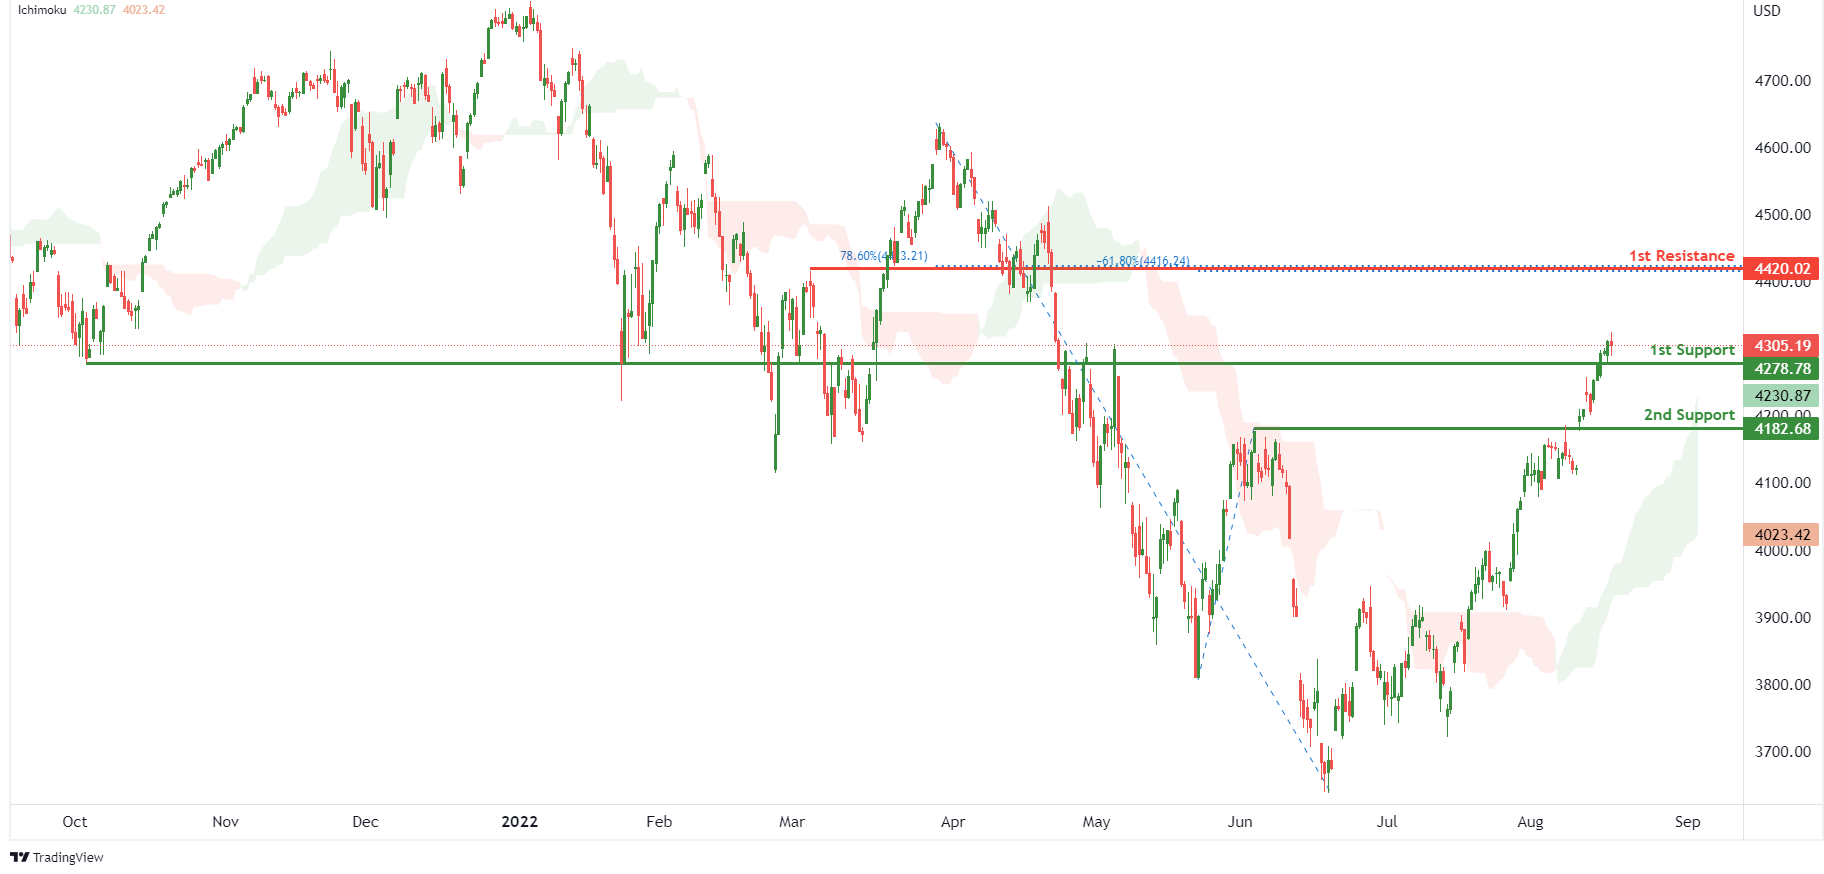
S&P 500:
On the H4, with prices moving above the ichimoku indicator, we have a bullish bias that price will rise from 1st support at 4278.78 where the overlap support is to the 1st resistance at 4420.02 where the pullback resistance, 78.6% fibonacci retracement and -61.8% fibonacci expansion are. Alternatively, price could break 1st support structure and drop to 2nd support at 4182.68 where the pullback support is.
Areas of consideration:
- H4 time frame, 1st resistance of 4420.02
- H4 time frame, 1st support at 4278.78


