
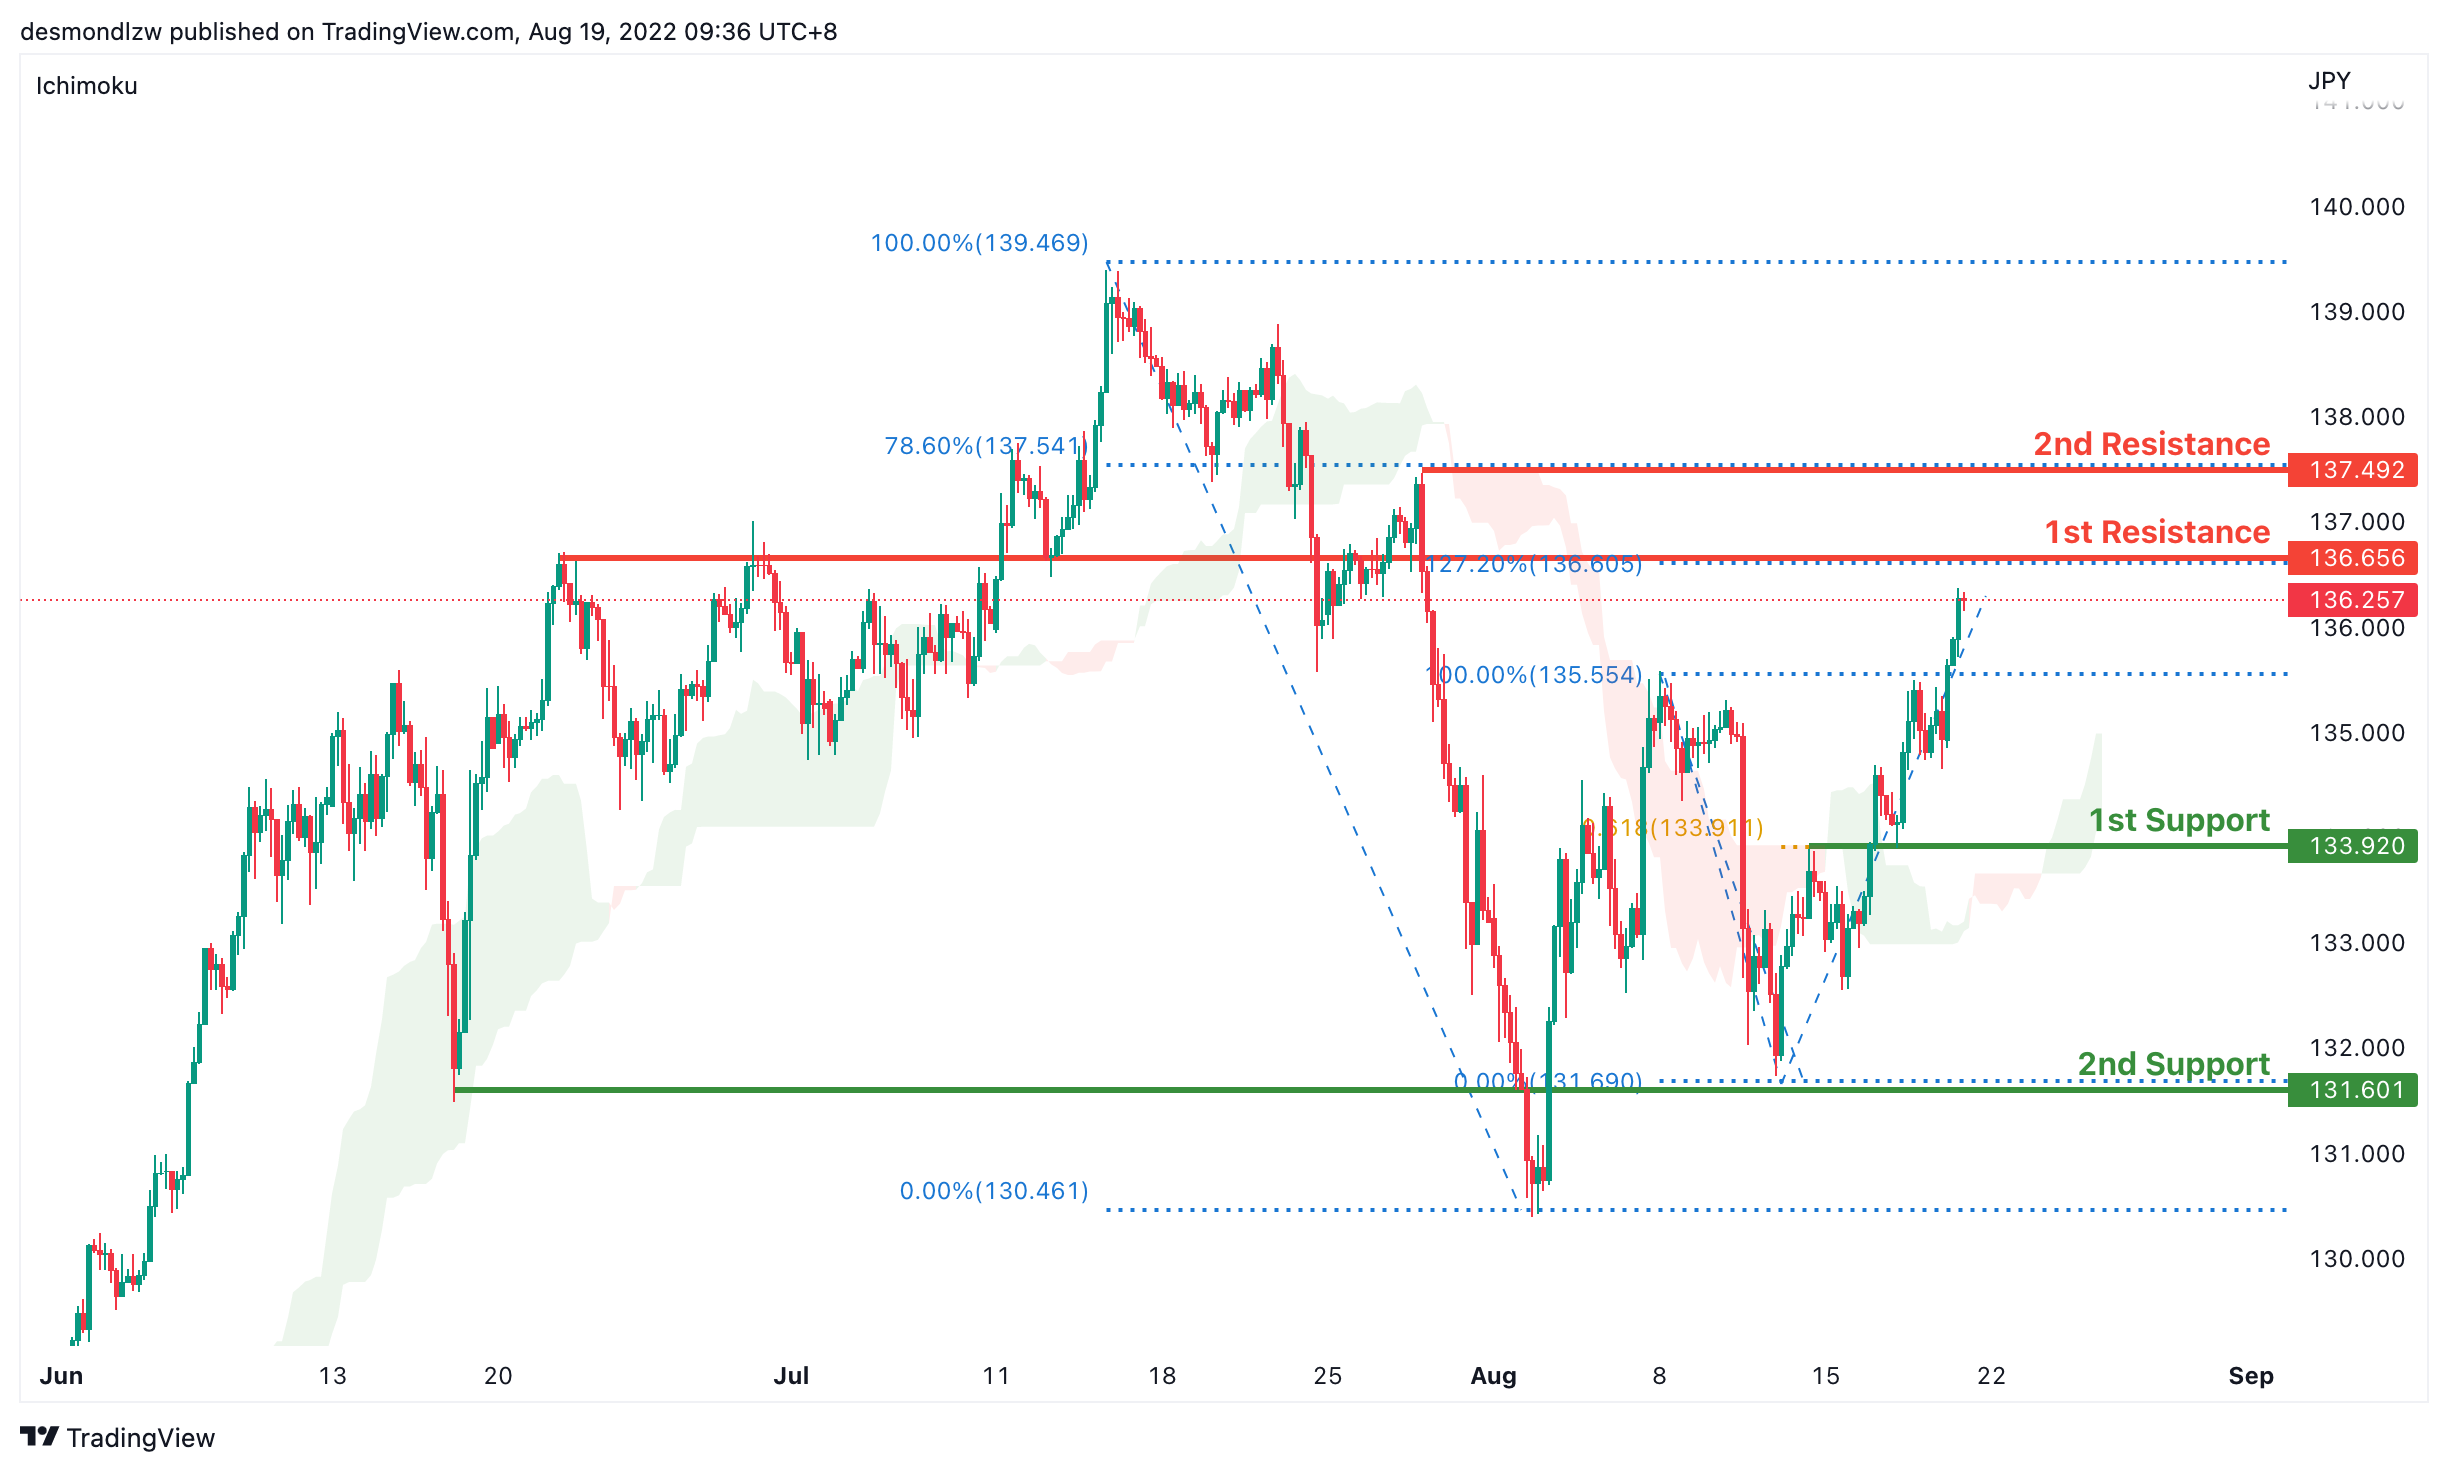
USD/JPY:
On the H4 chart, prices seem to have pulled back a little but the overall trend is still bearish biased. Price has broken the intermediate resistance at 133.908 which is the 50% Fibonacci retracement and is now testing the first resistance at 135.605 where the previous swing high. 61.8% fibonacci retracement and 78.6% projection sits.If the bearish momentum continues it will pull back to test the first support at 131.711 where the 78.6% retracement and 100% projection sits
Areas of consideration:
- H4 time frame, 1st resistance at 135.605
- H4 time frame, 1st support at 131.711
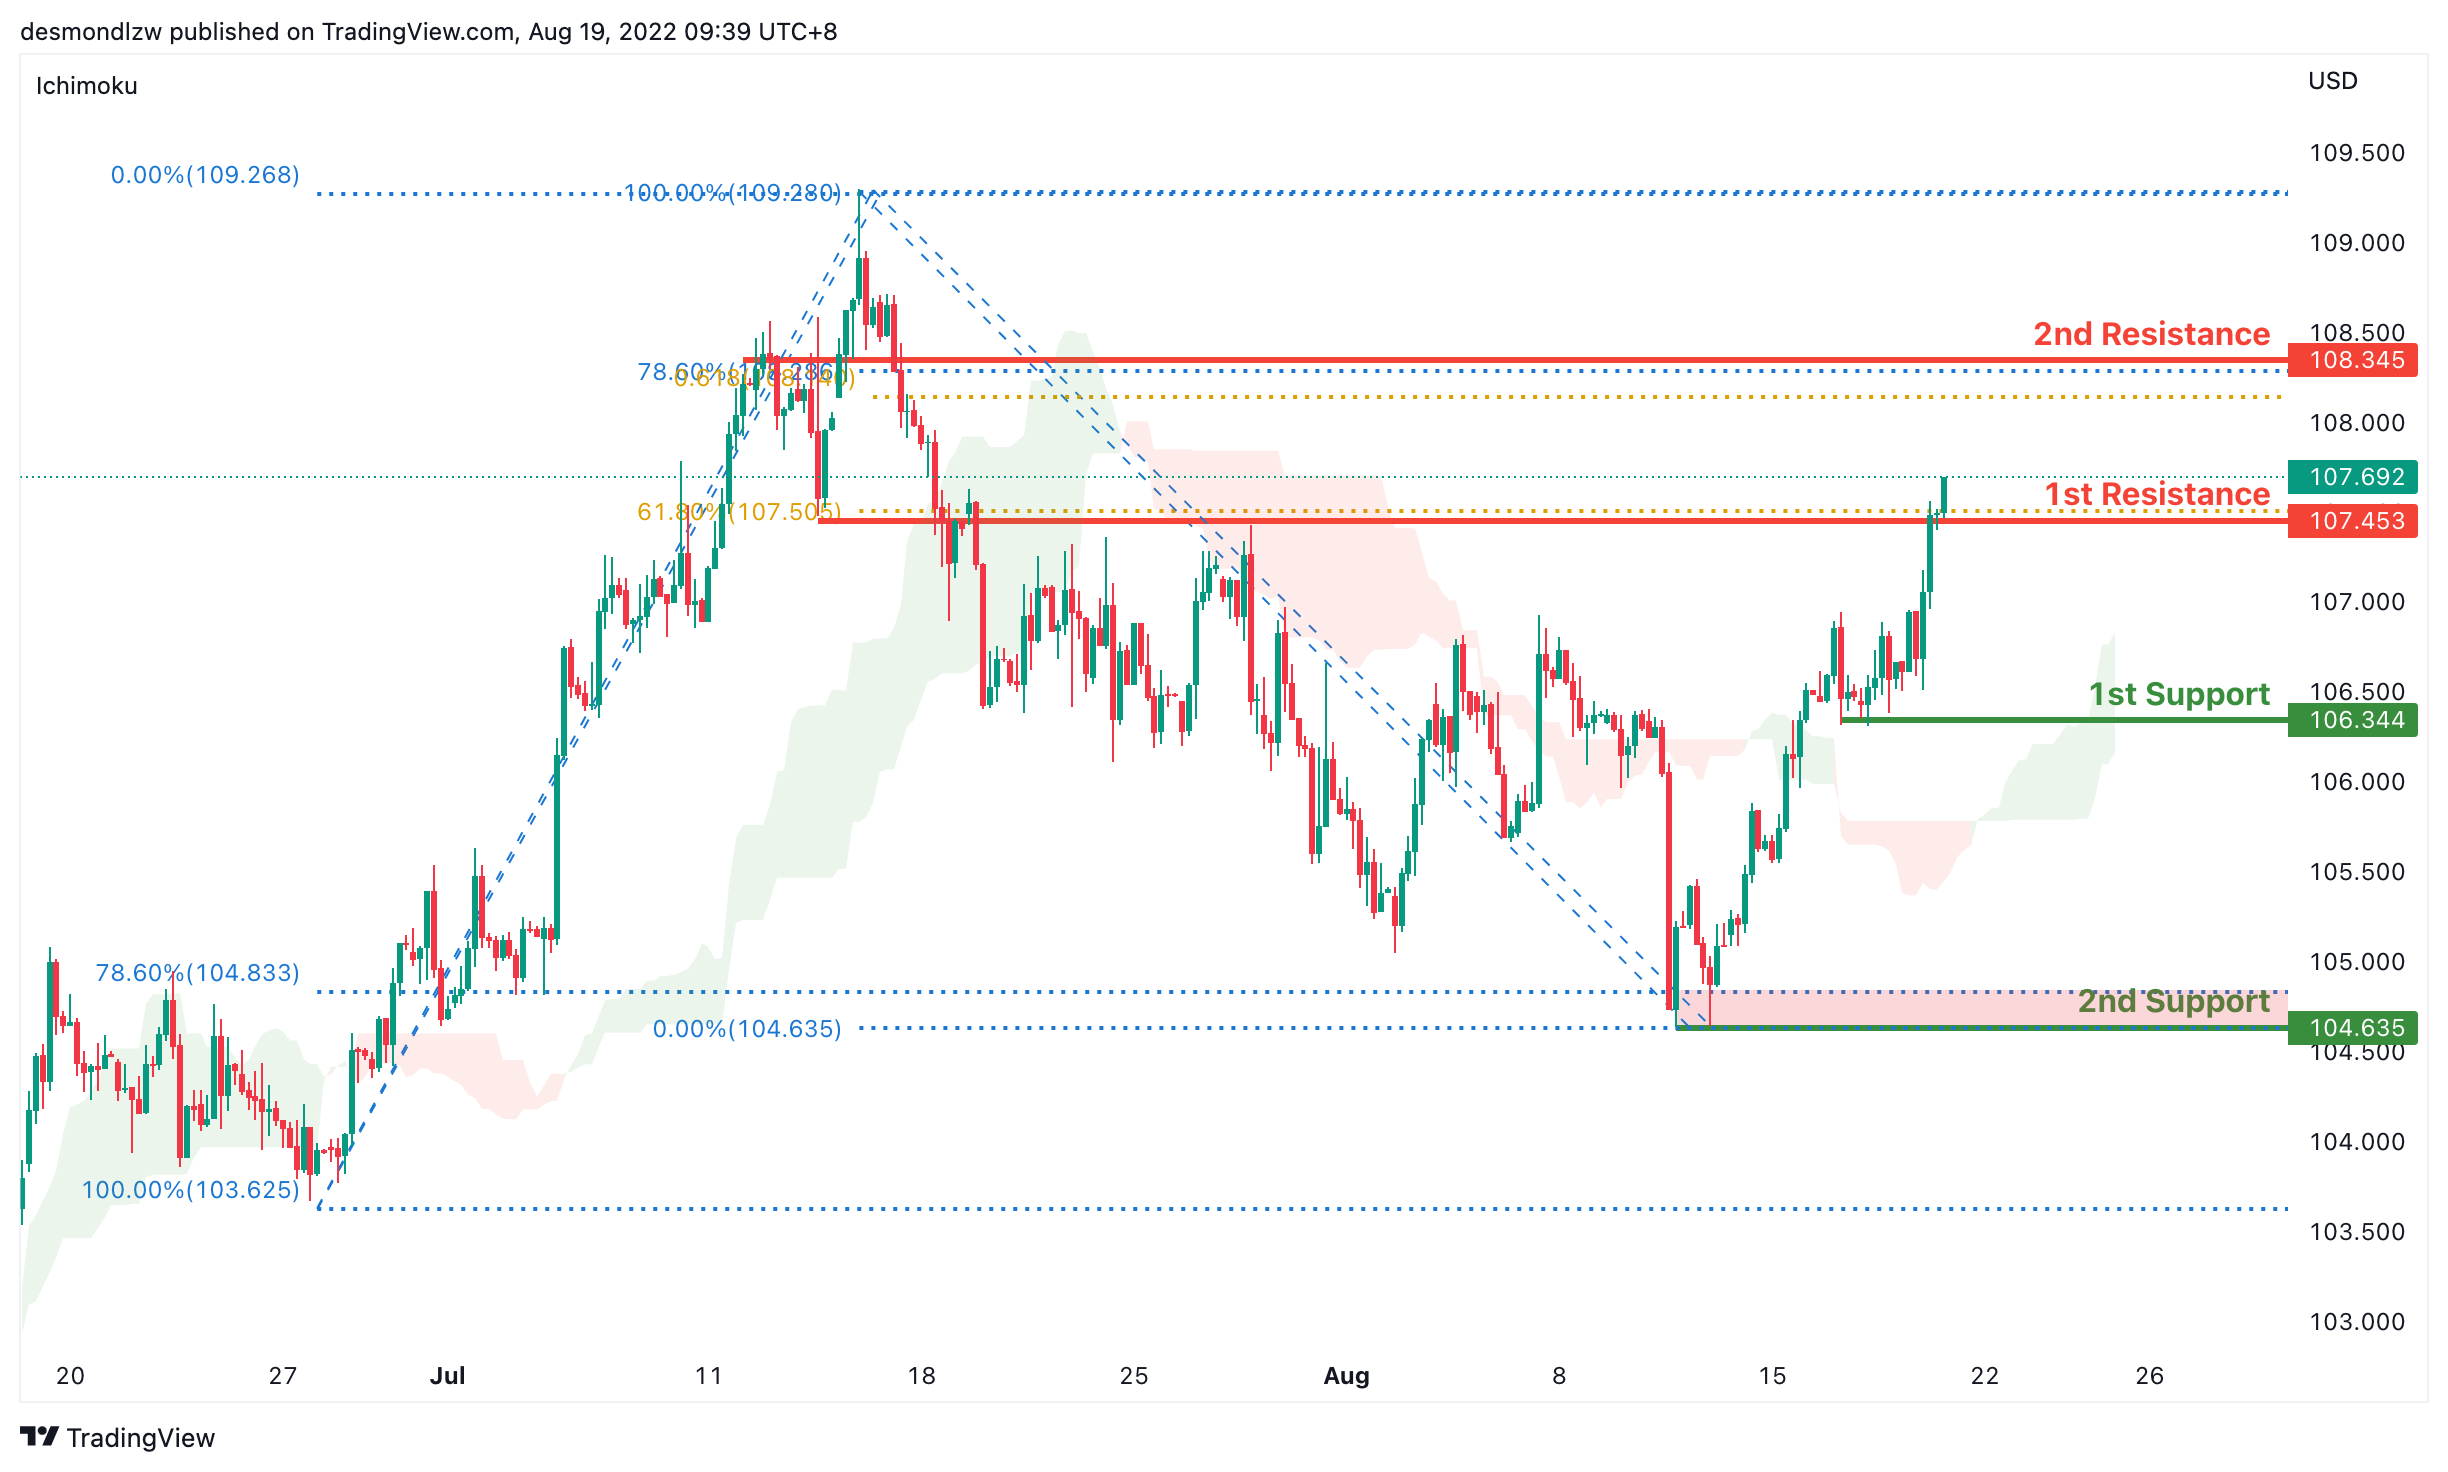
DXY:
On the H4, prices seem to be moving in an ascending trend and is in a bullish momentum. Price is now around the first resistance at 106.945 where the 50% Fibonacci retracement and the previous swing high sits. We’re looking for price to test the first resistance again and if price continues with bullish momentum, it will test the second resistance at 107.453 where the 61.8% fibonacci retracement sits. If fails to break the first resistance, it will pull back to test the first support at 104.635 where the 78.6% retracement is and subsequently the second support at 103.697 which is the previous swing low
Areas of consideration:
- H4 time frame, 1st resistance at 106.945
- H4 time frame, 1st support at 104.635
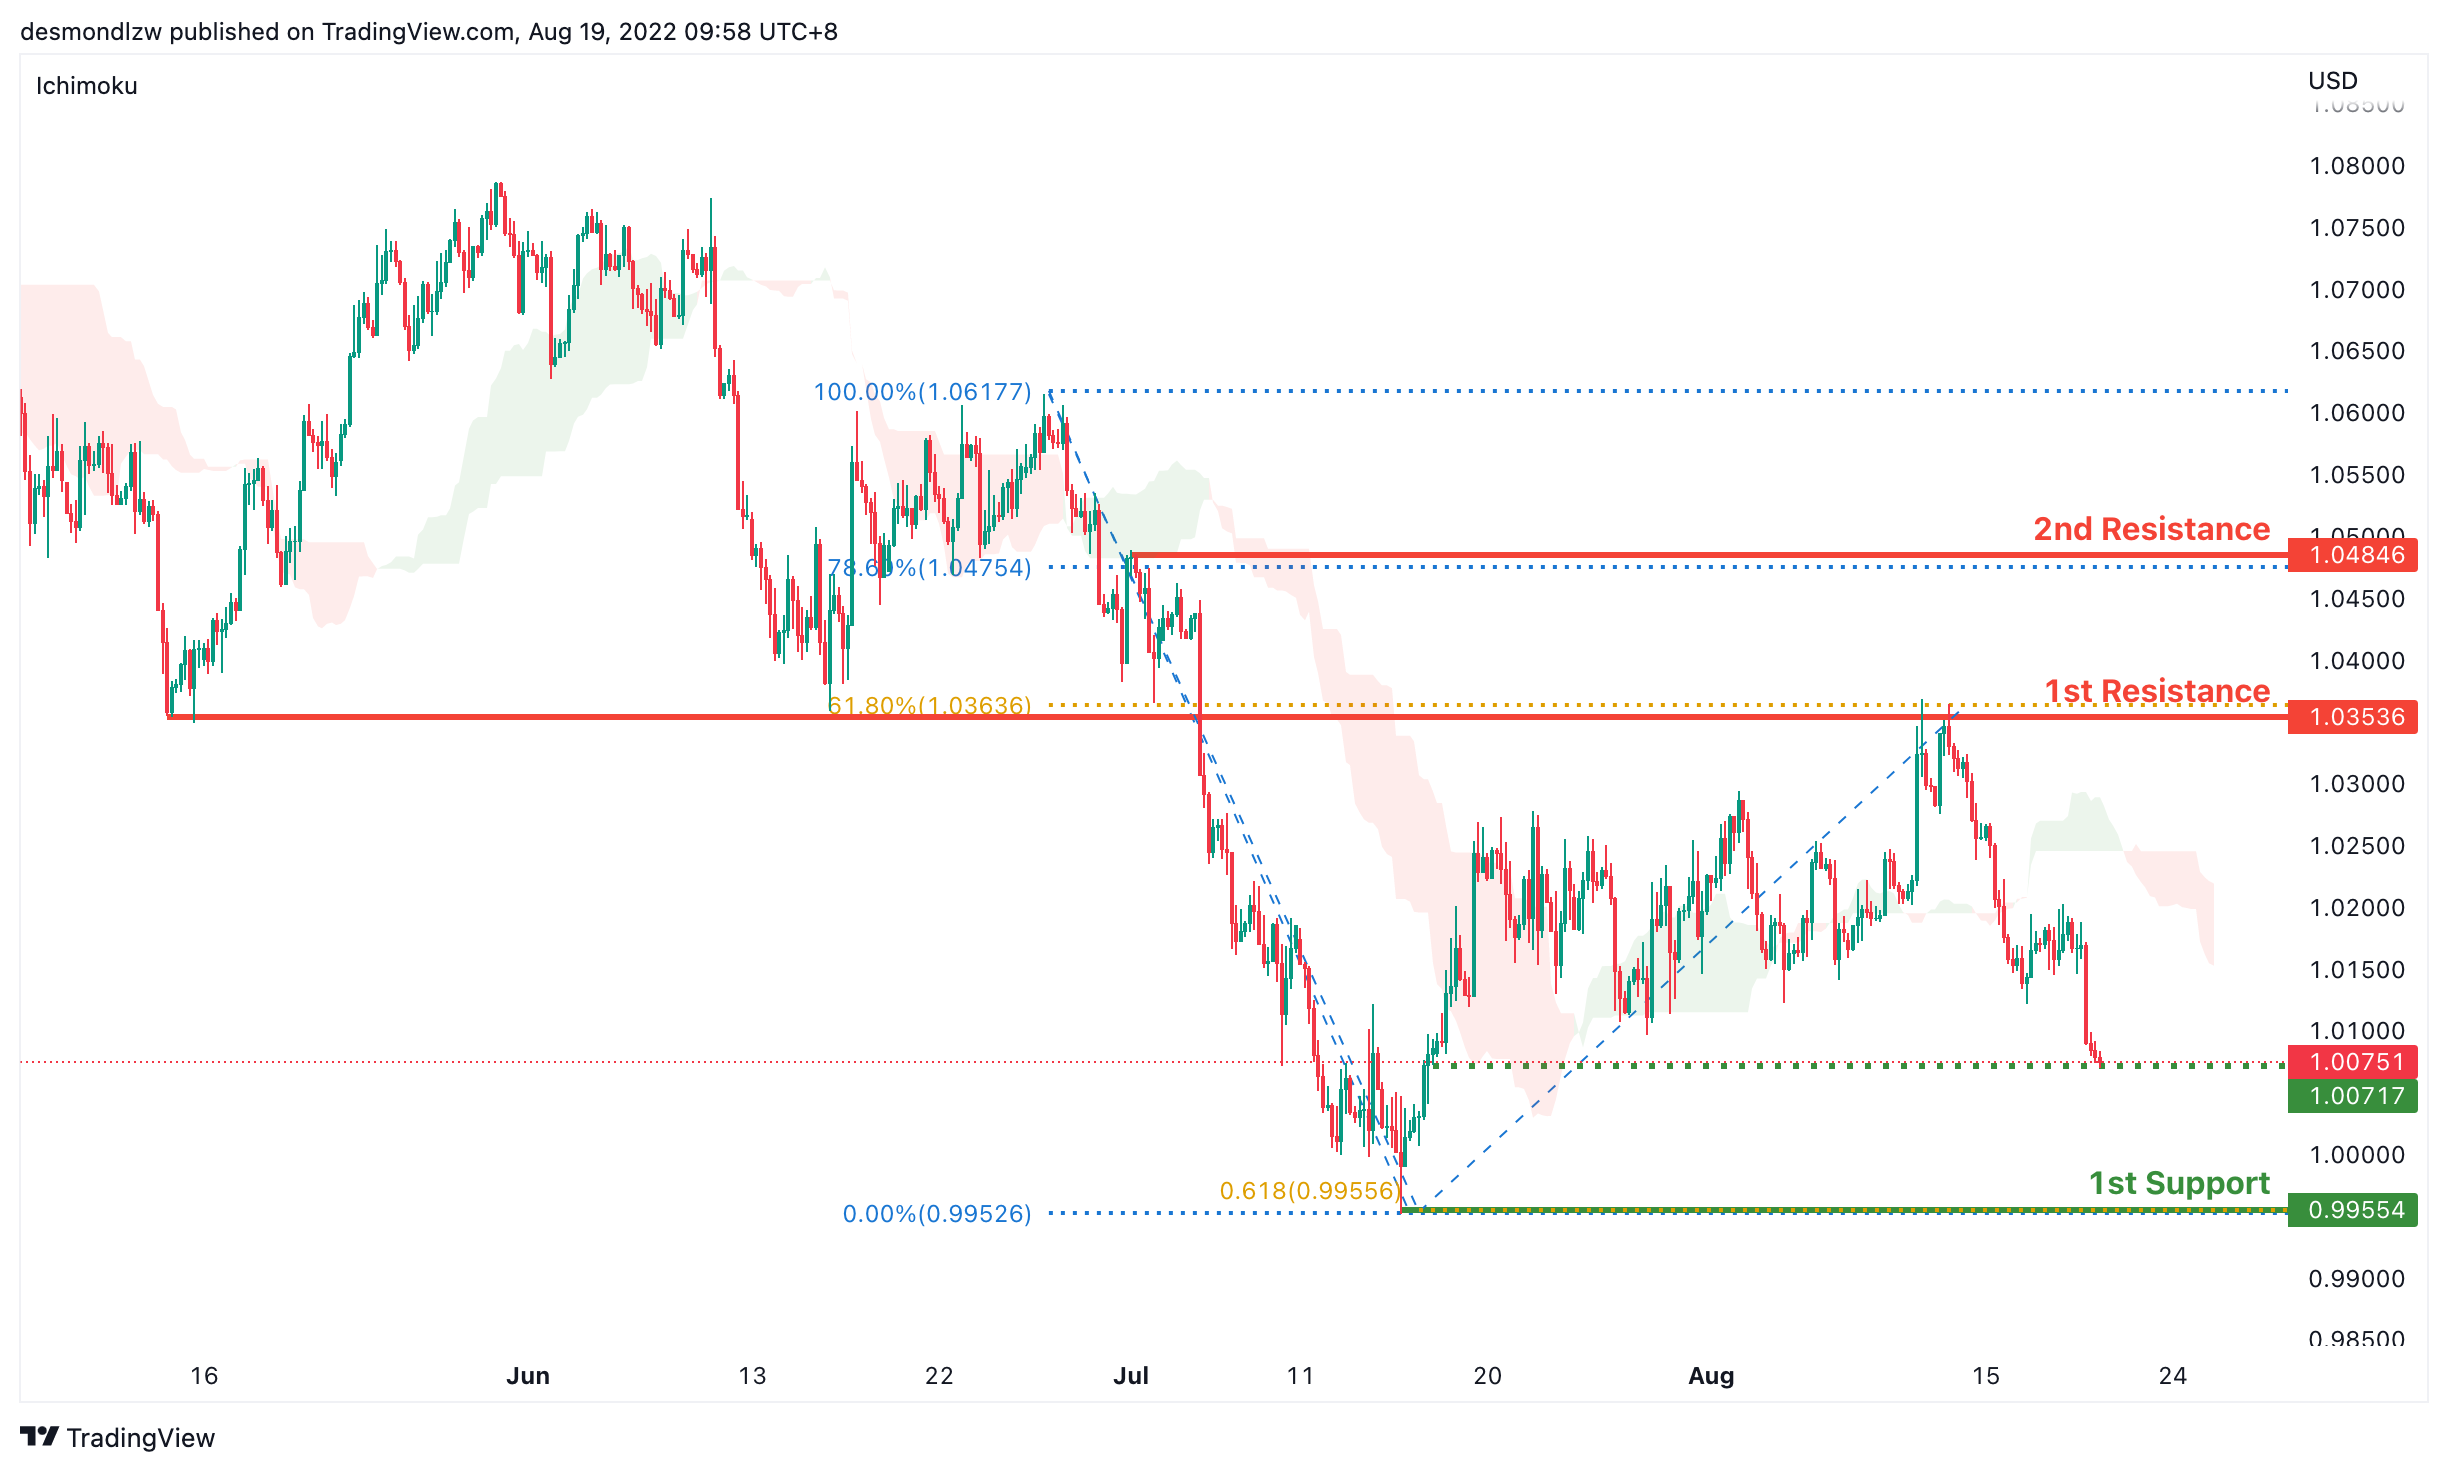
EUR/USD :
On the H4, prices have broken the ascending trend and are below the ichimoku indicator, we are bearish bias. Prices have ascended slightly but we’re looking for a pull back to test the first support at 1.0108 where the 61.8% Fibonacci retracement sits. If prices continue in the bearish momentum, it will test the second support at 0.9948. Alternatively price could go back to test the first resistance at 1.0363 where the 61.8% Fibonacci retracement sits and then the second resistance at 1.0465
Areas of consideration :
- H4 1st resistance at 1.0363
- H4 1st support at 1.0108
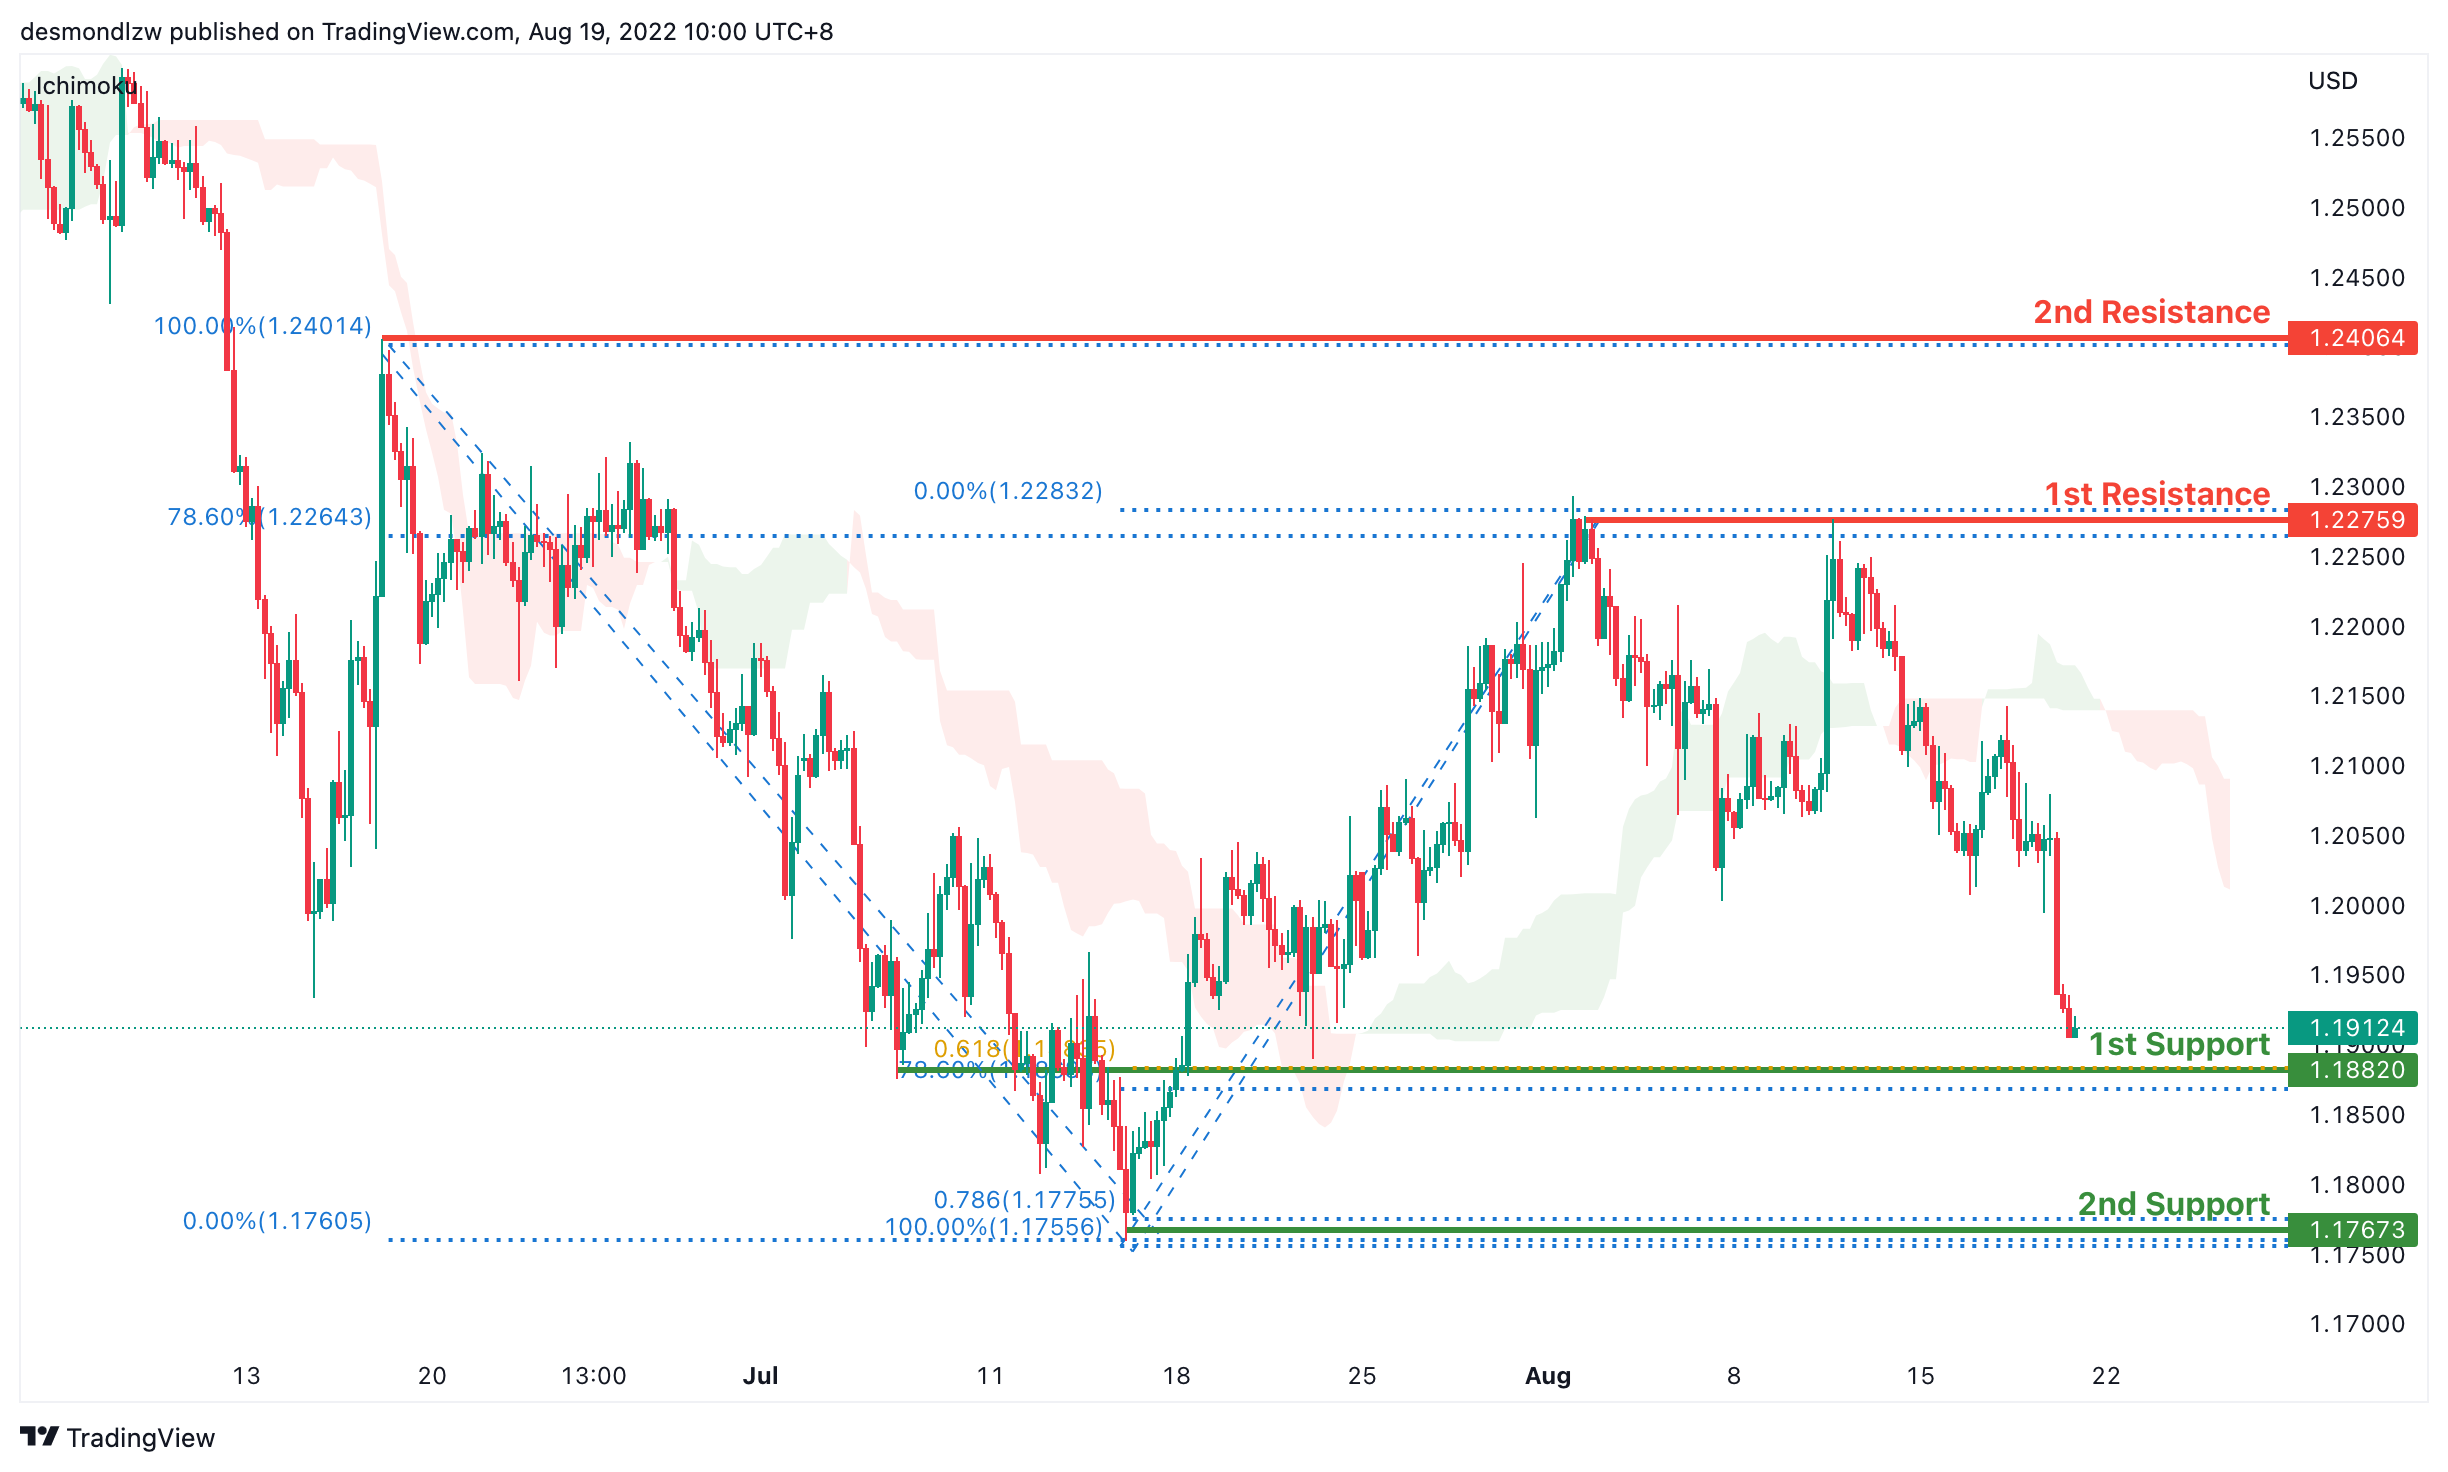
GBP/USD:
On the H4, prices seem to be in a bearish momentum. It is currently testing the 50% Fibonacci retracement and if the bearish momentum continues, it will pull prices to our first support 1.2025 where our swing low sits. If prices pull back further it will test the second support at 1.1767 where our 78.6% Fibonacci projection sits. Alternatively price could hit resistance at 1.2275 around the 78.6% projection and the first resistance at 1.2403 where the swing high sits
Areas of consideration:
- H4 1st resistance at 1.2275
- H4 1st support at 1.2025
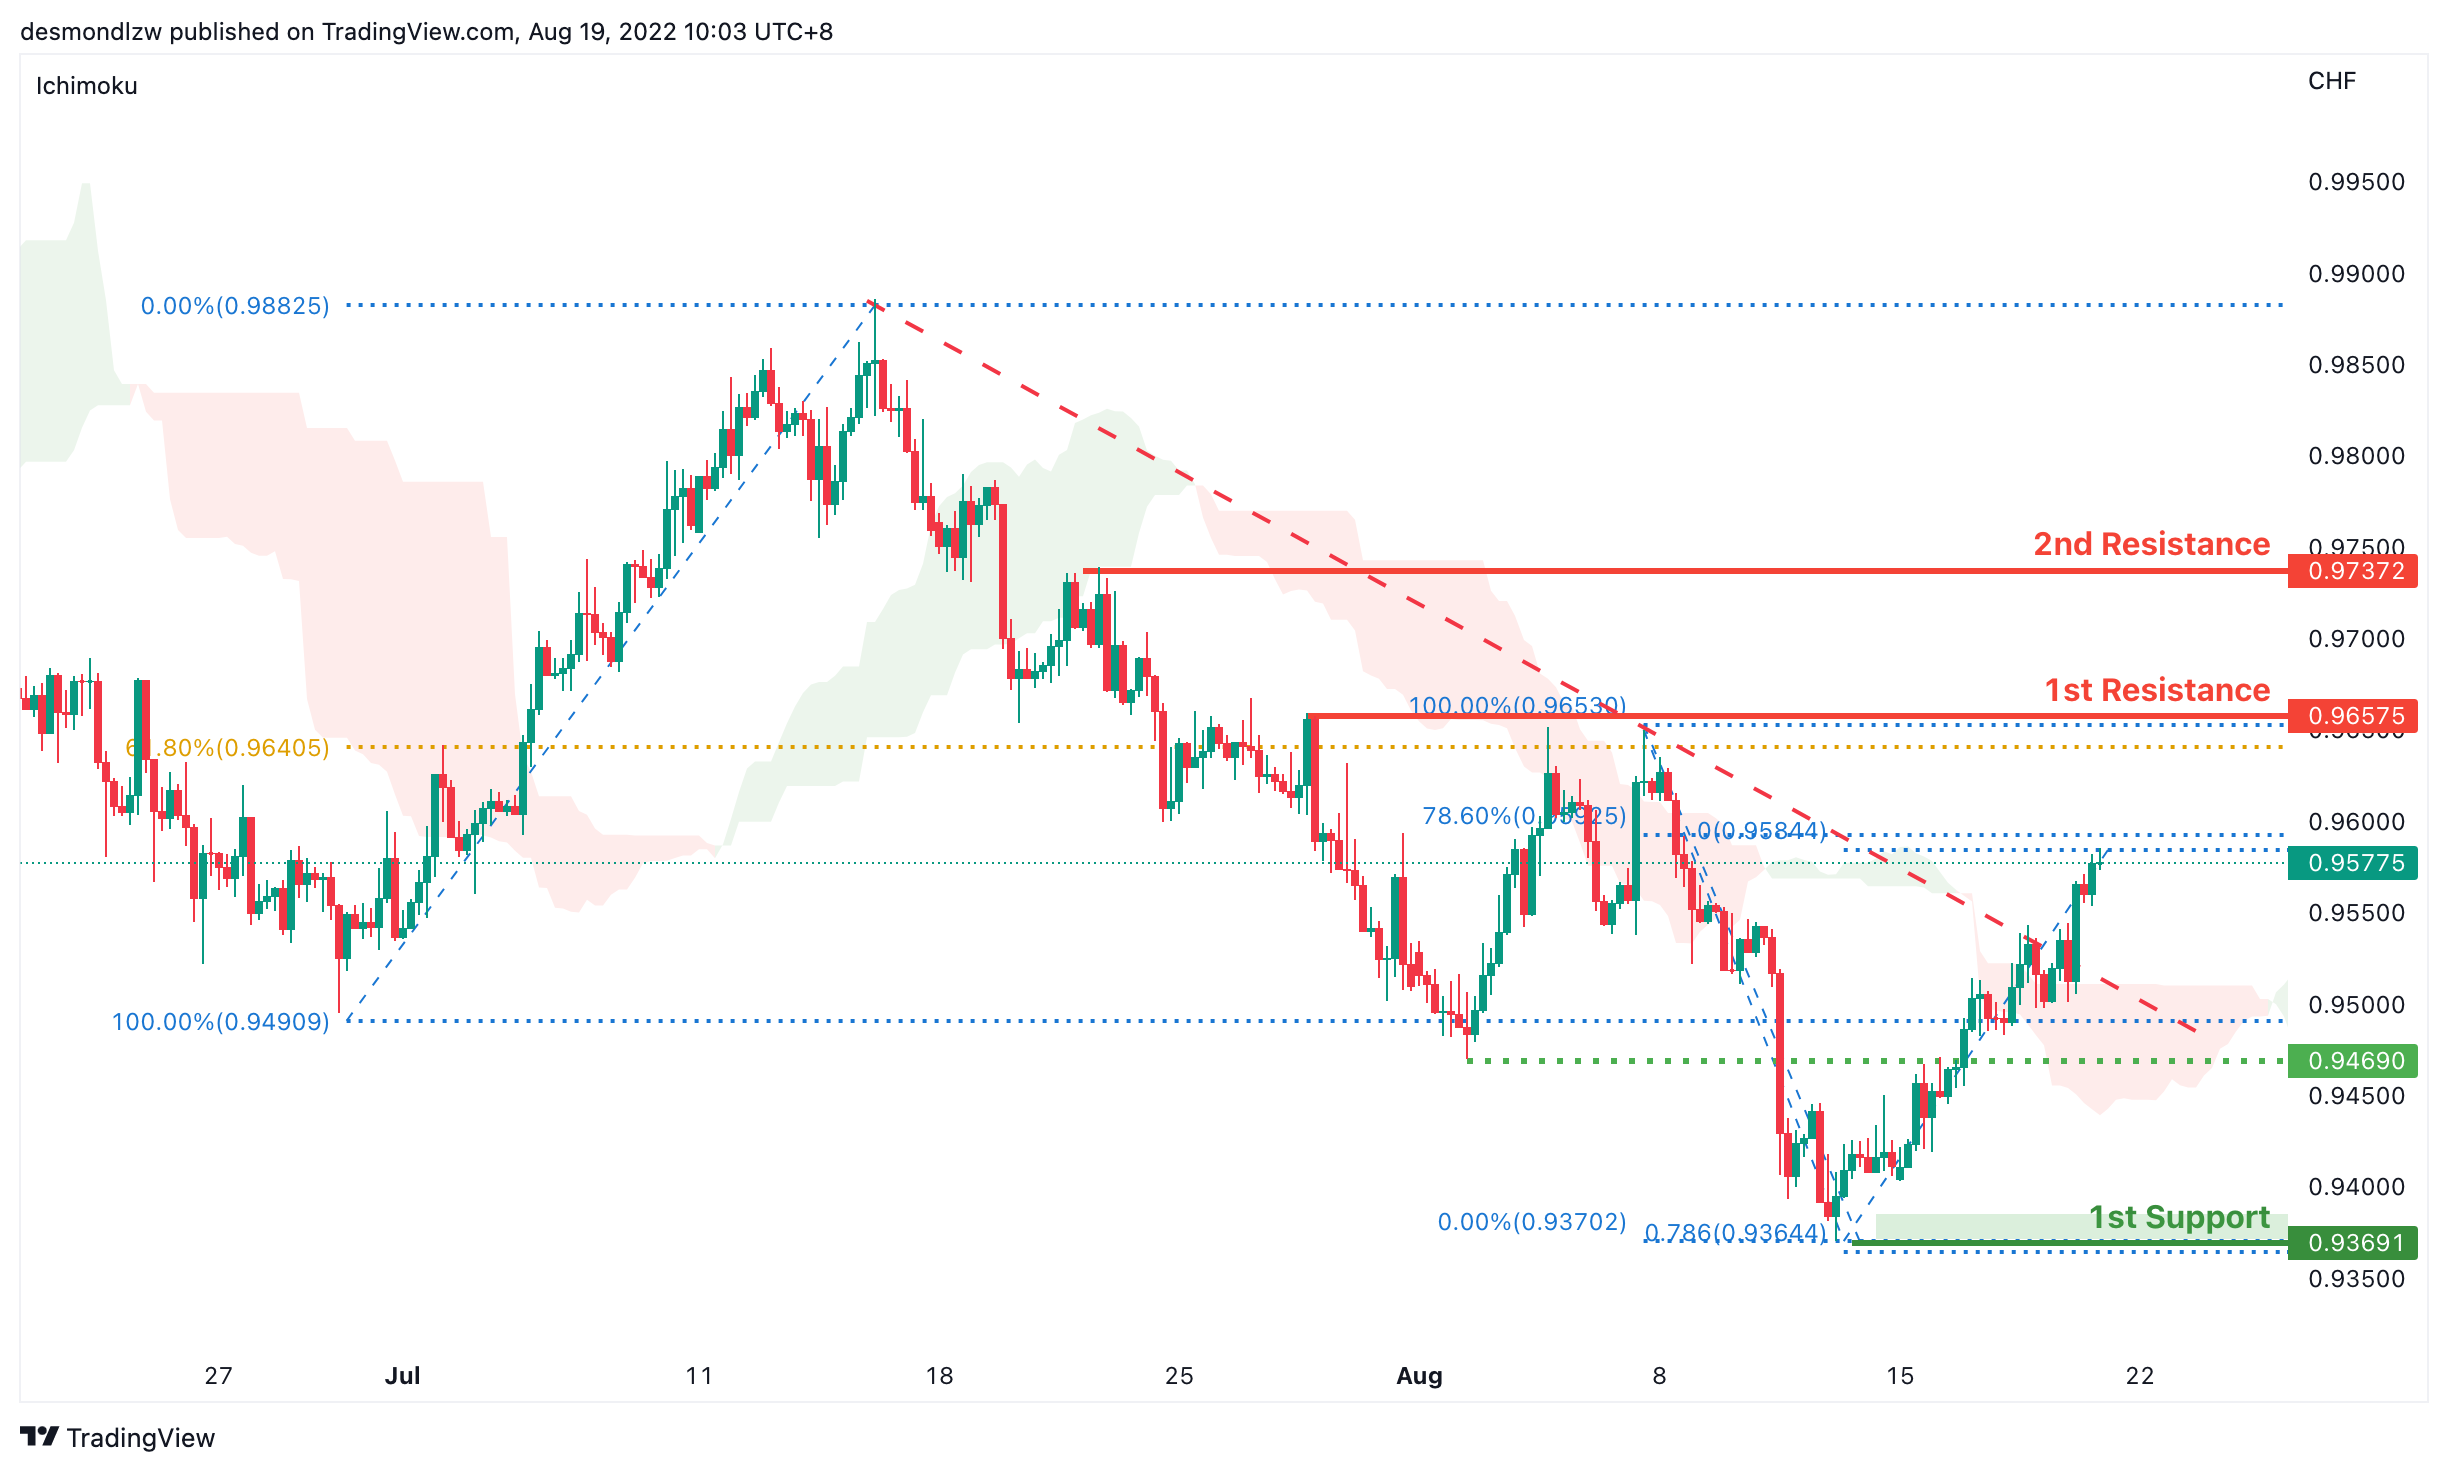
USD/CHF:
On the H4, with prices moving below the ichimoku cloud and along the descending trend, we are bearish bias that the price will continue with the bearish momentum. Price is now testing at the 61.8%% Fibonacci retracement and it may rise to test the first resistance at 0.9542 again. If bearish momentum continues, it should pull back to test at the intermediate support at 0.9468 where the previous swing low is then the first support at 0.9369 where the 61.8% projection and 127.2% extension sits
Areas of consideration
- H4 1st support at 0.9369
- H4 1st resistance at 0.9542
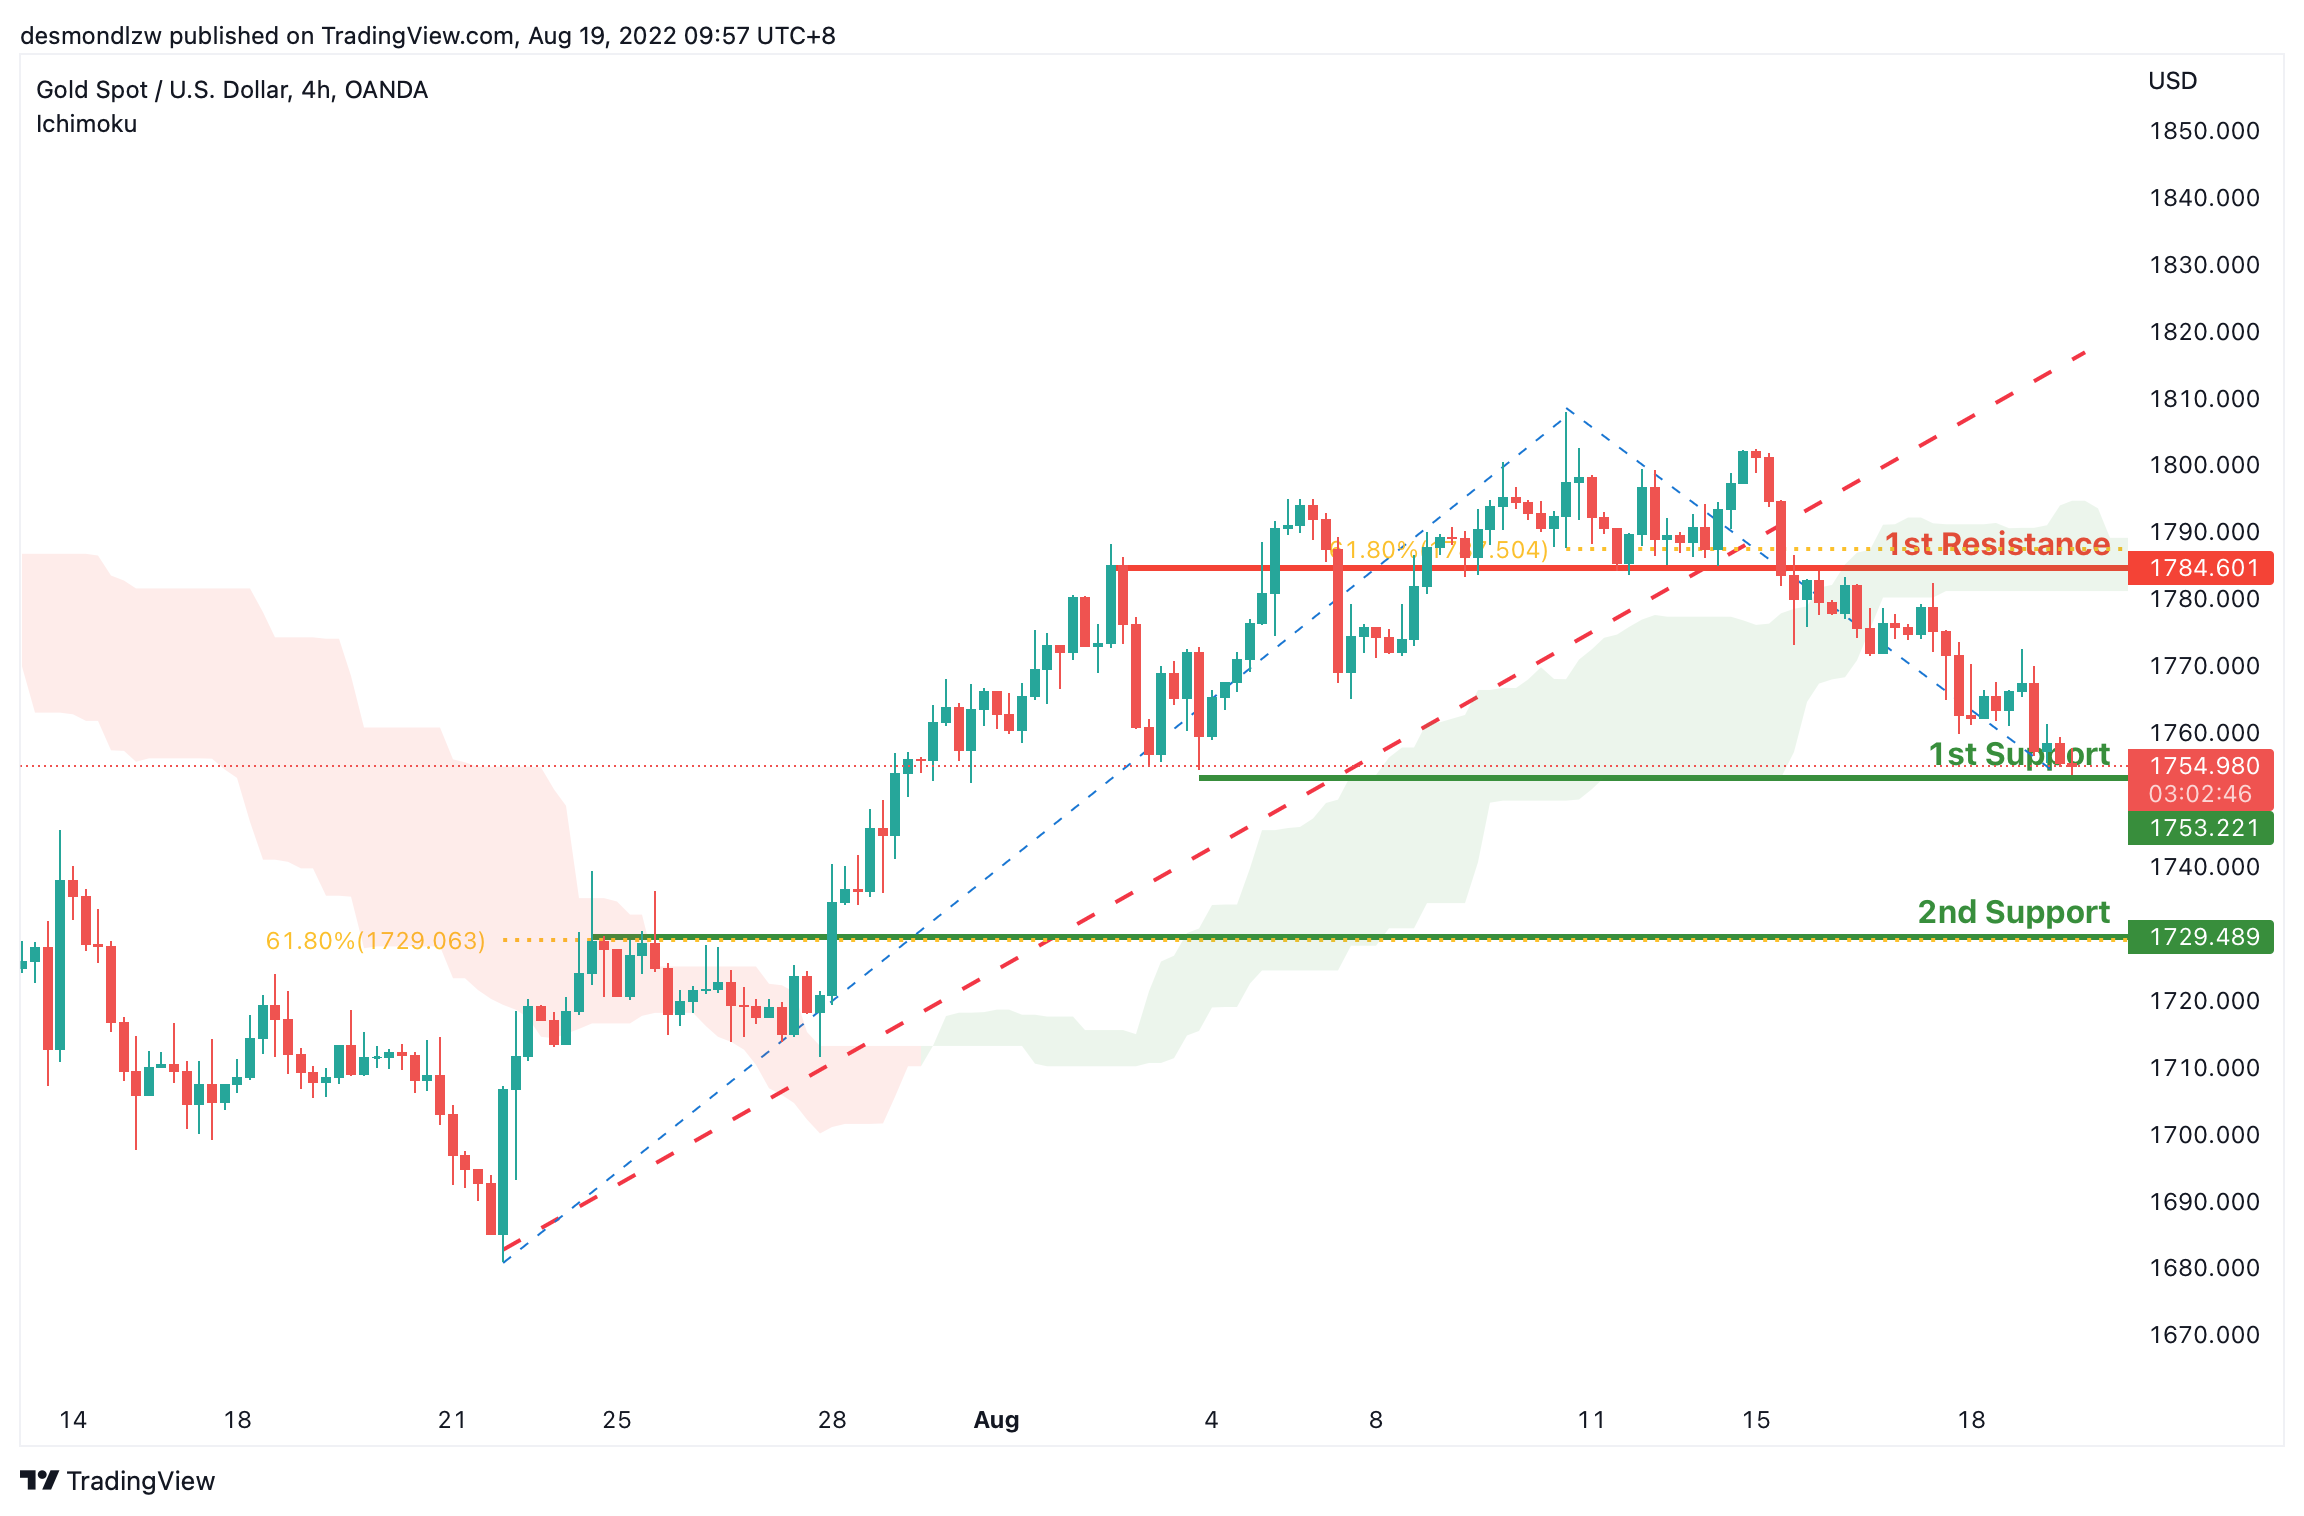
XAU/USD (GOLD):
On the H4, with prices breaking the ascending and below ichimoku cloud, we have a bearish bias that the price may drop from the 1st support at 1754.980, which is in line with the overlap support to the 2nd support at 1729.489, which is in line with the pullback support and 61.8% fibonacci retracement. Alternatively, the price may rise to the 1st resistance at 1784.601, which is in line with the 61.8% fibonacci retracement and overlap resistance.
Areas of consideration:
- H4 time frame, 1st support at 1754.98
- H4 time frame, 2nd support at 1729.489
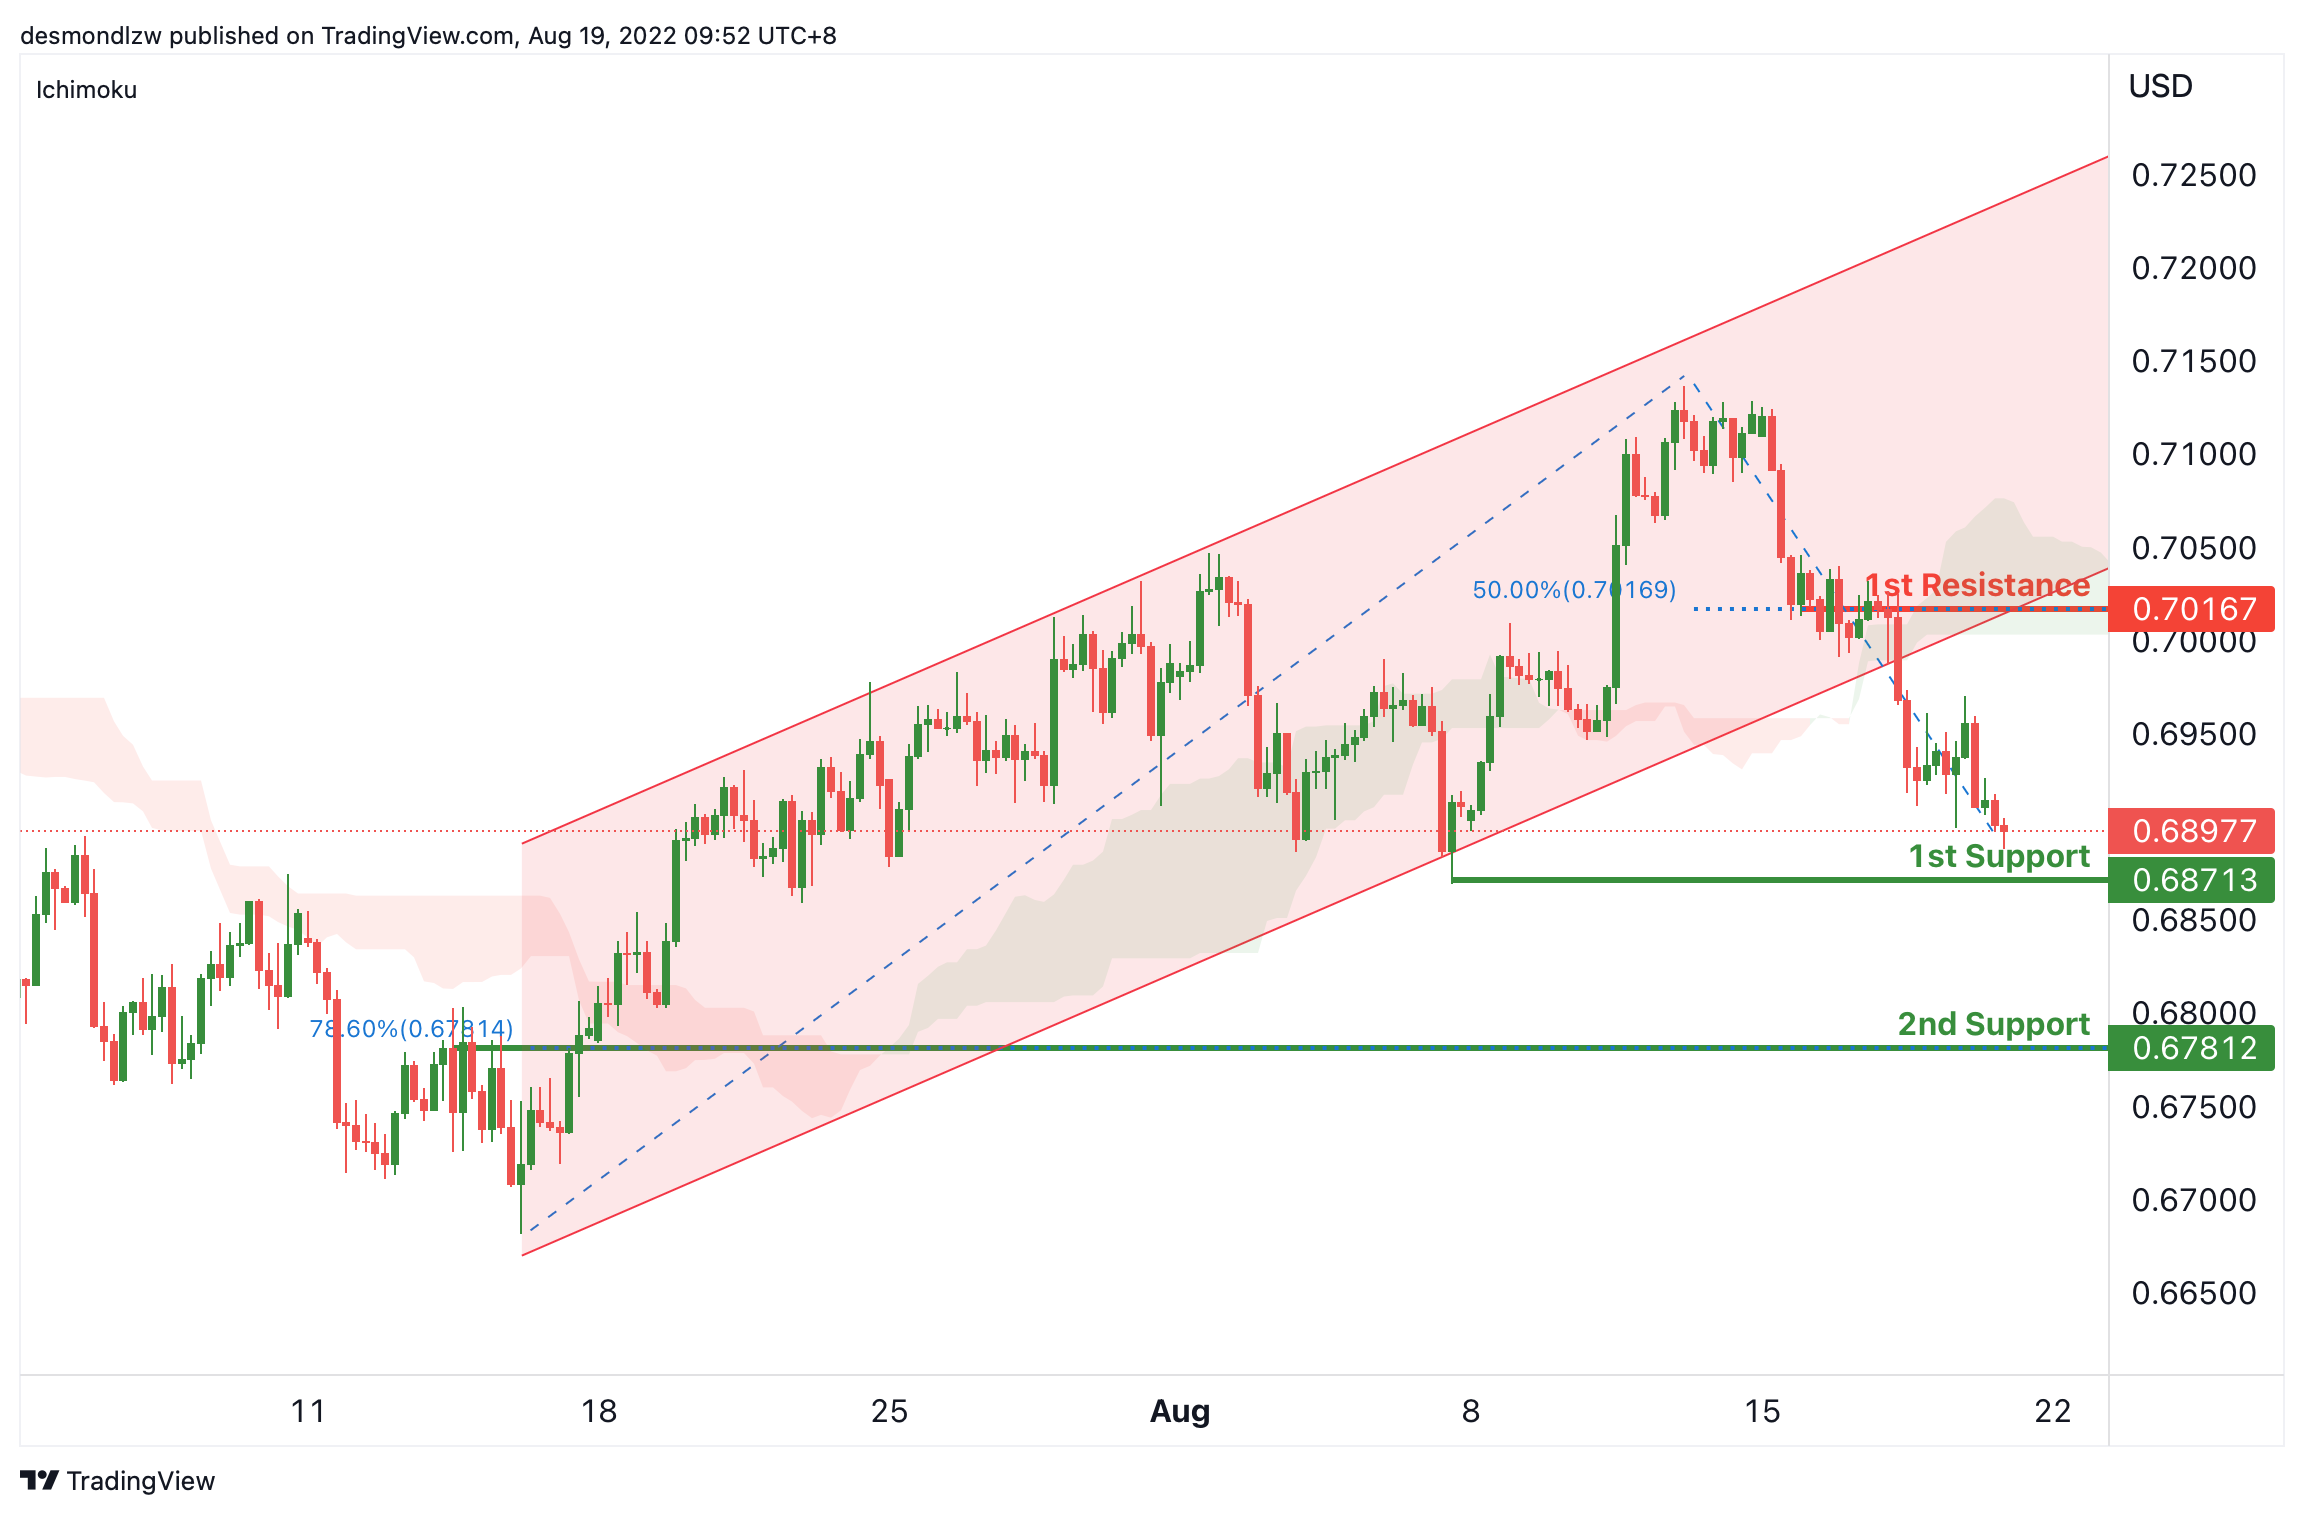
AUD/USD:
On the H4, with the the price breaking the ascending channel and below the ichimoku cloud, we have a bearish bias that price may drop to the 1st support at 0.68713, where the swing lows is to the 2nd support at 0.67812, which is in line with the 78.6% fibonacci retracement. Alternatively, the price may rise to the 1st resistance at 0.70167 which is in line with 50% fibonacci retracement.
Areas of consideration
- H4 1st support at 0.68713
- H4 2nd support at 0.67812
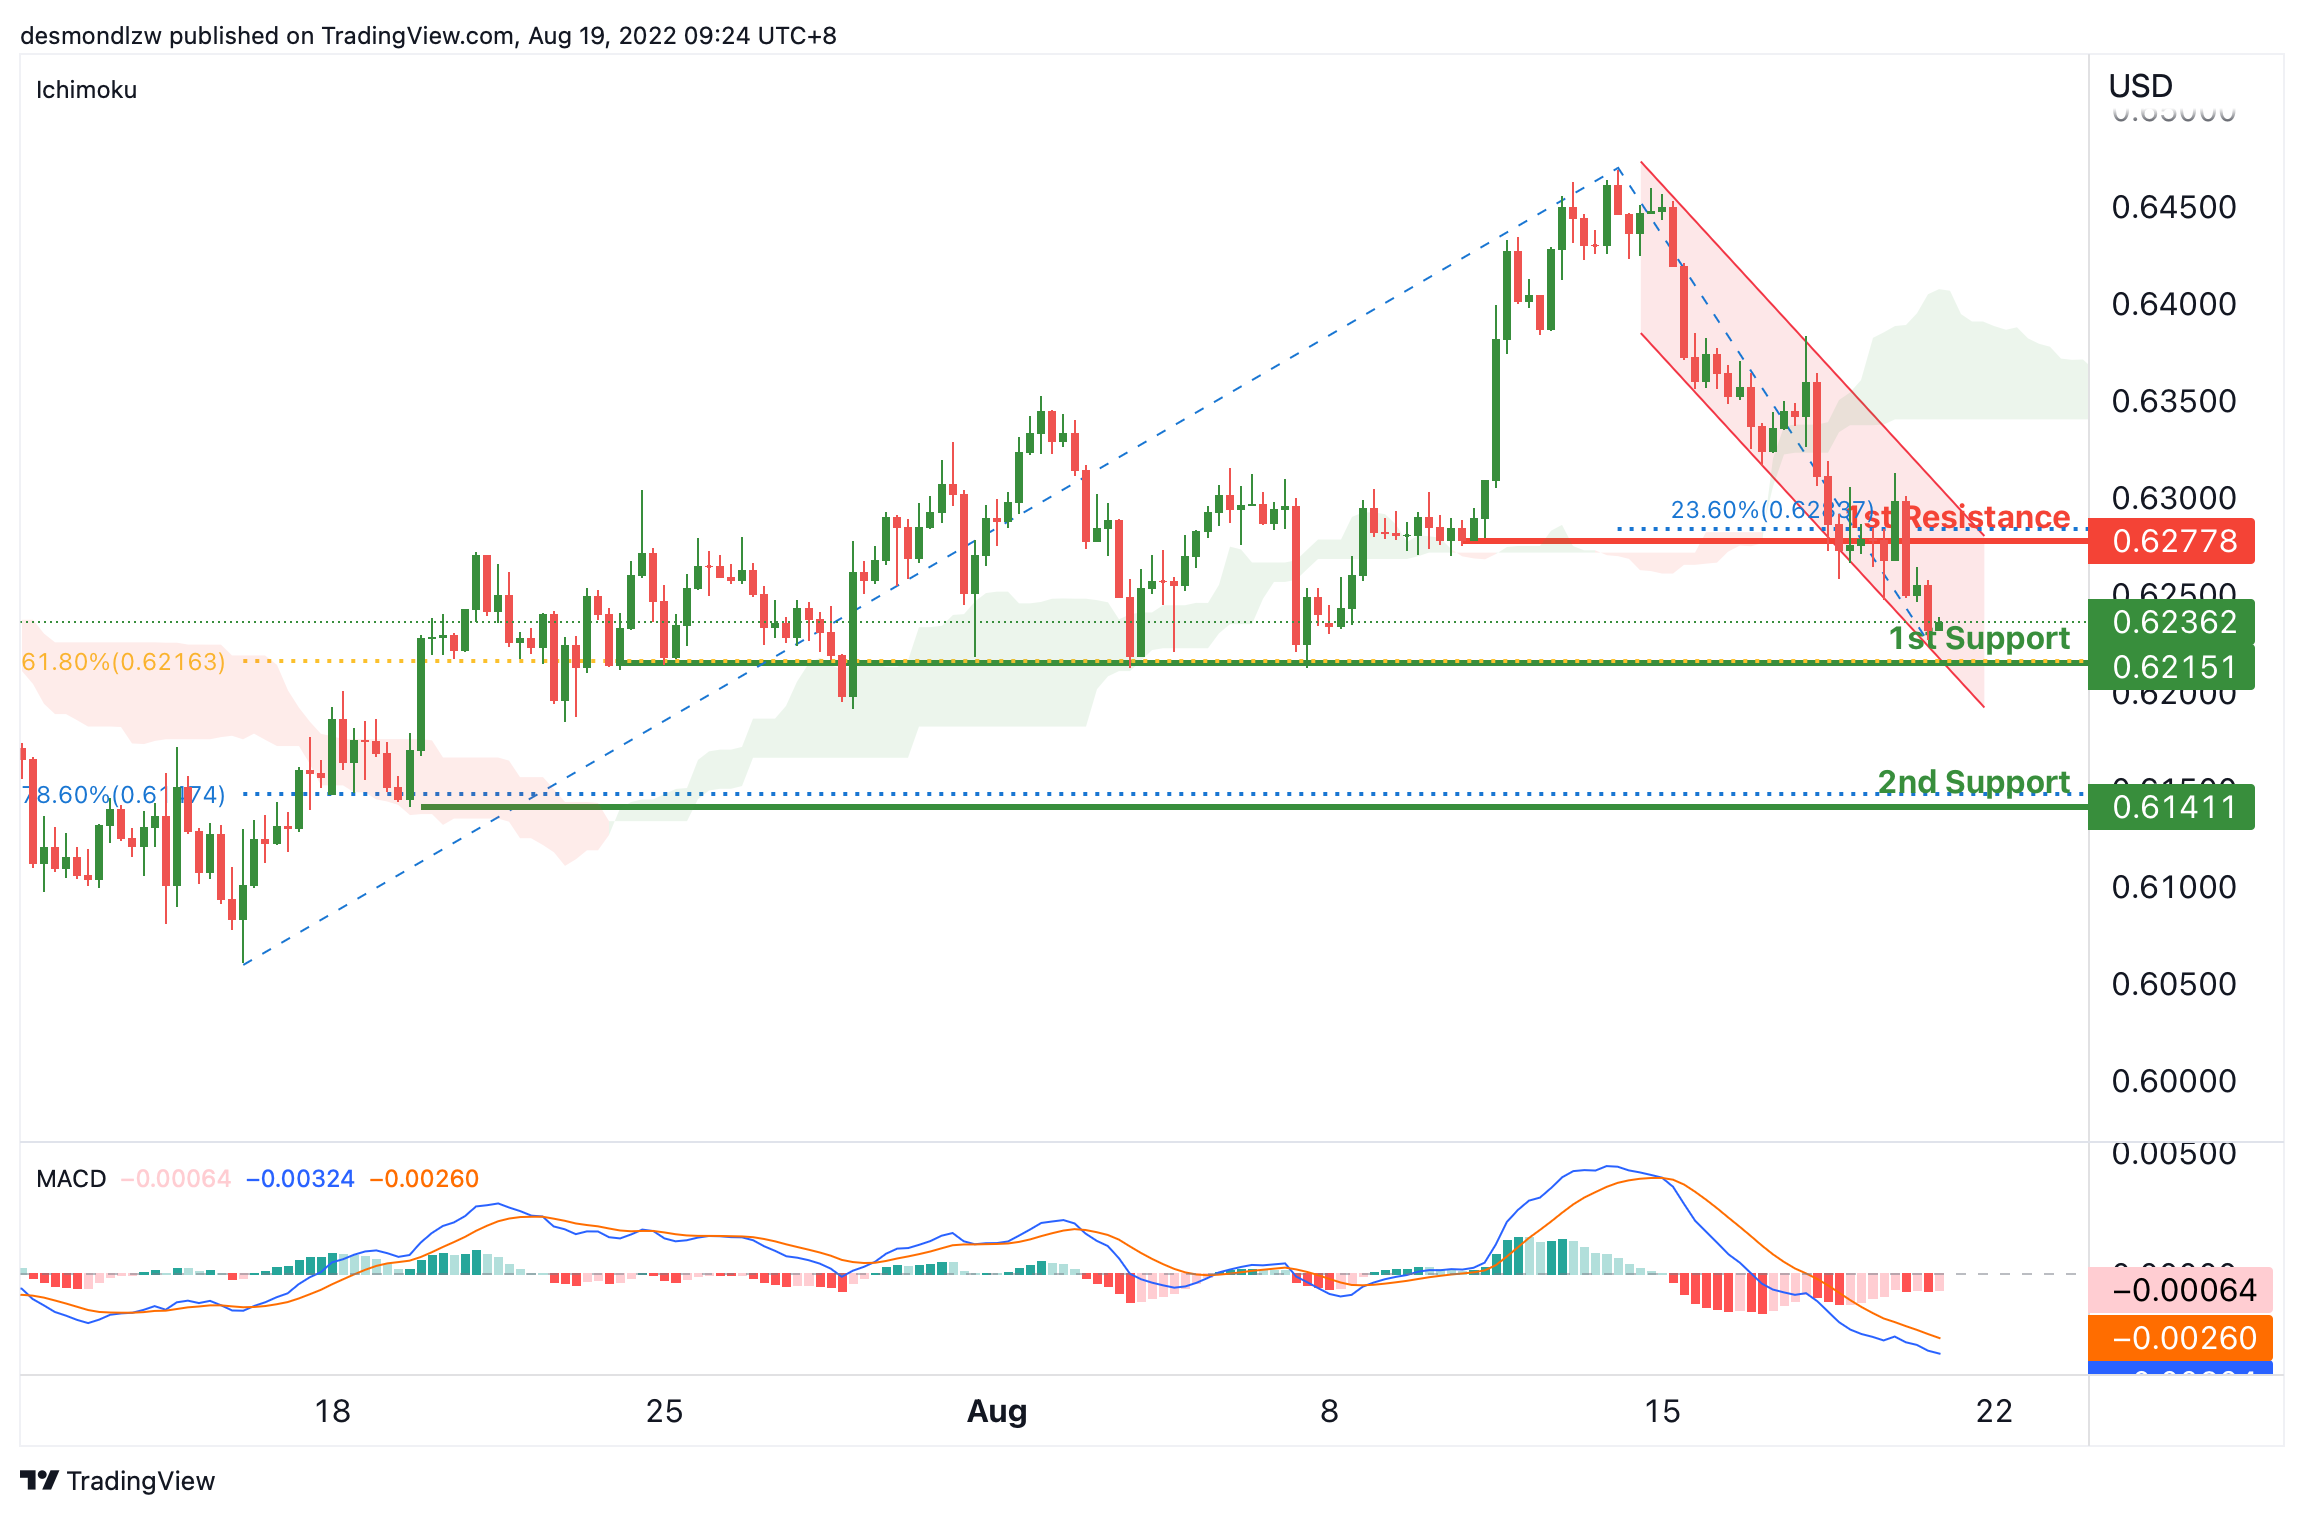
NZD/USD:
On the H4, with the price moving within the descending channel, below ichimoku cloud and MACD indicators are below zero, we have a bearish bias that the price may drop from the 1st support at 0.62362, which is in line with the 61.8% fibonacci retracement and pervious swing lows to the 2nd support at 0.61411, which is in line with the swing low and 78.6% fibonacci retracement. Alternatively, the price may rise to the 1st resistance at 0.62778, where the 23.6% fibonacci retracement is.
Areas of consideration:
- H4 time frame, 1st support at 0.6236
- H4 time frame, 2nd support at 0.61411
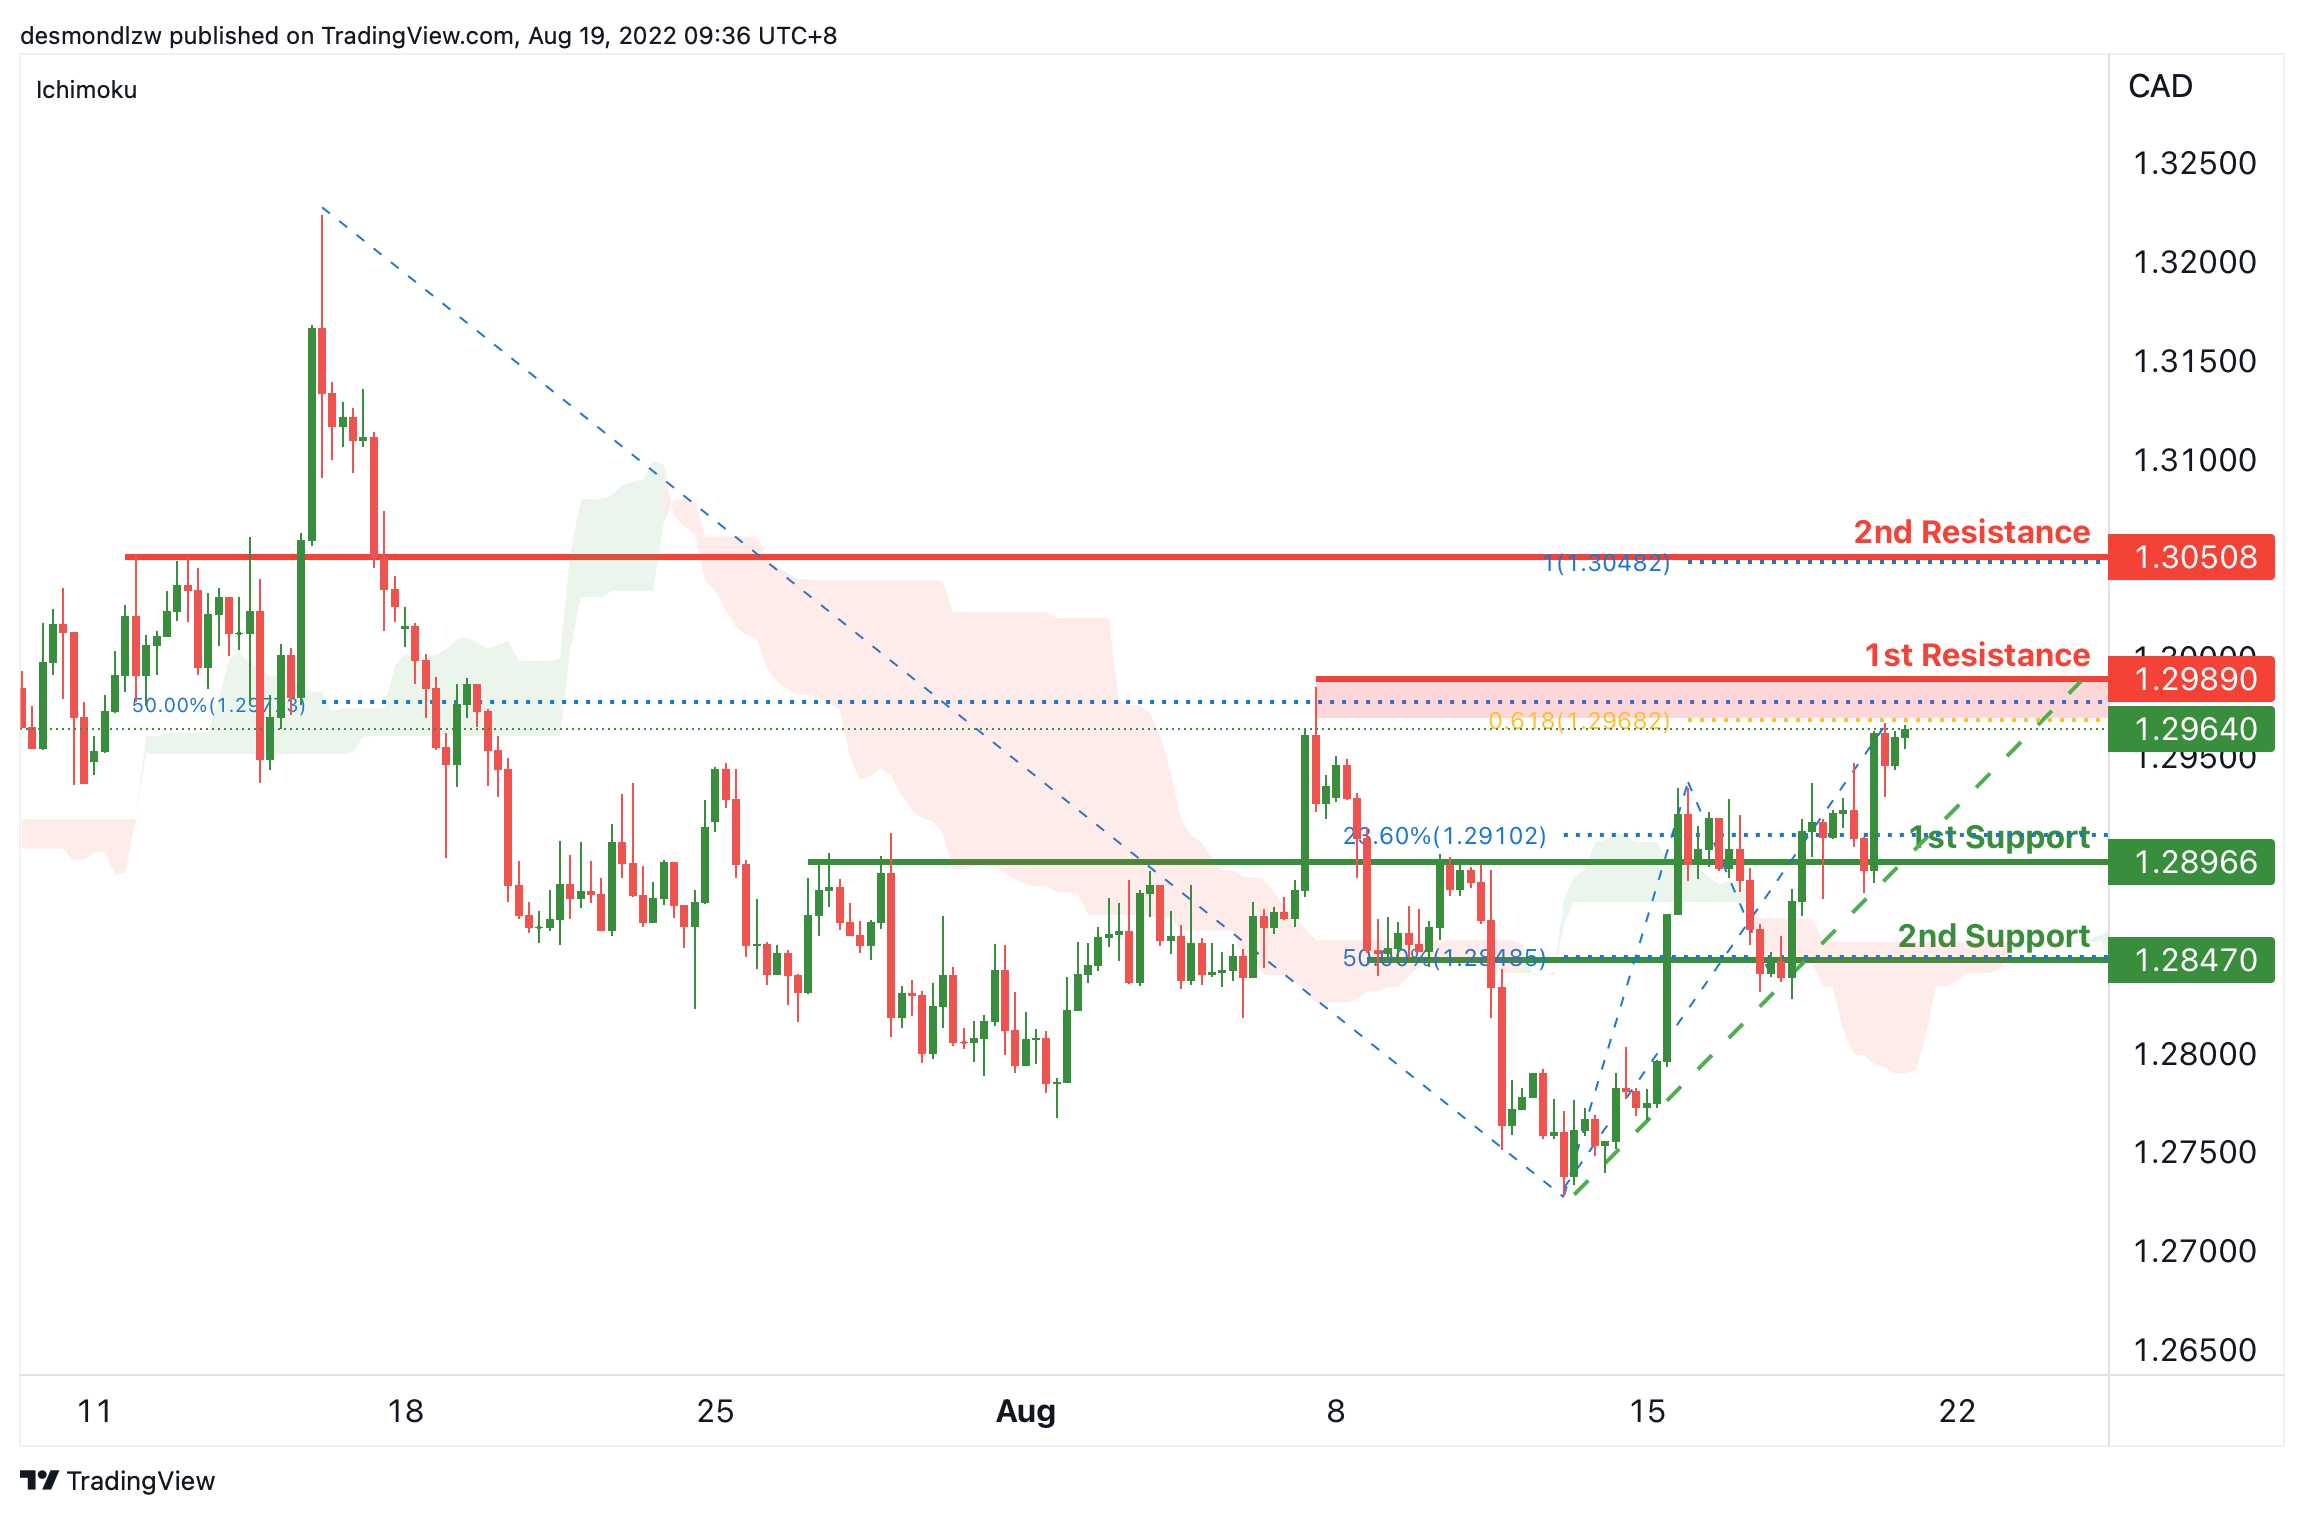
USD/CAD:
On the H4, with the price moving within the ascending trendline and above the ichimoku cloud, we have a bullish bias that the price may rise to the 1st resistance at 1.29890, where the swing high, 61.8% fibonacci projection, 50% fibonacci retracement are. If the price breaks the 1st resistance, we can expect the price to rise to the 2nd resistance at 1.30508, which is in line with the 100% fibonacci projection and previous swing highs. Alternatively, the piece may drop to the 1st support at 1.28966, where the current swing low, previous swing highs and 23.6% fibonacci retracement are. IF the price breaks the 1st support, we can expect the price drop down to the 2nd support at 1.28470, which is in line with the swing low and 50% fibonacci retracement.
Areas of consideration:
- H4 time frame, 1st resistance at 1.29890
- H4 time frame, 2nd resistance at 1.30508
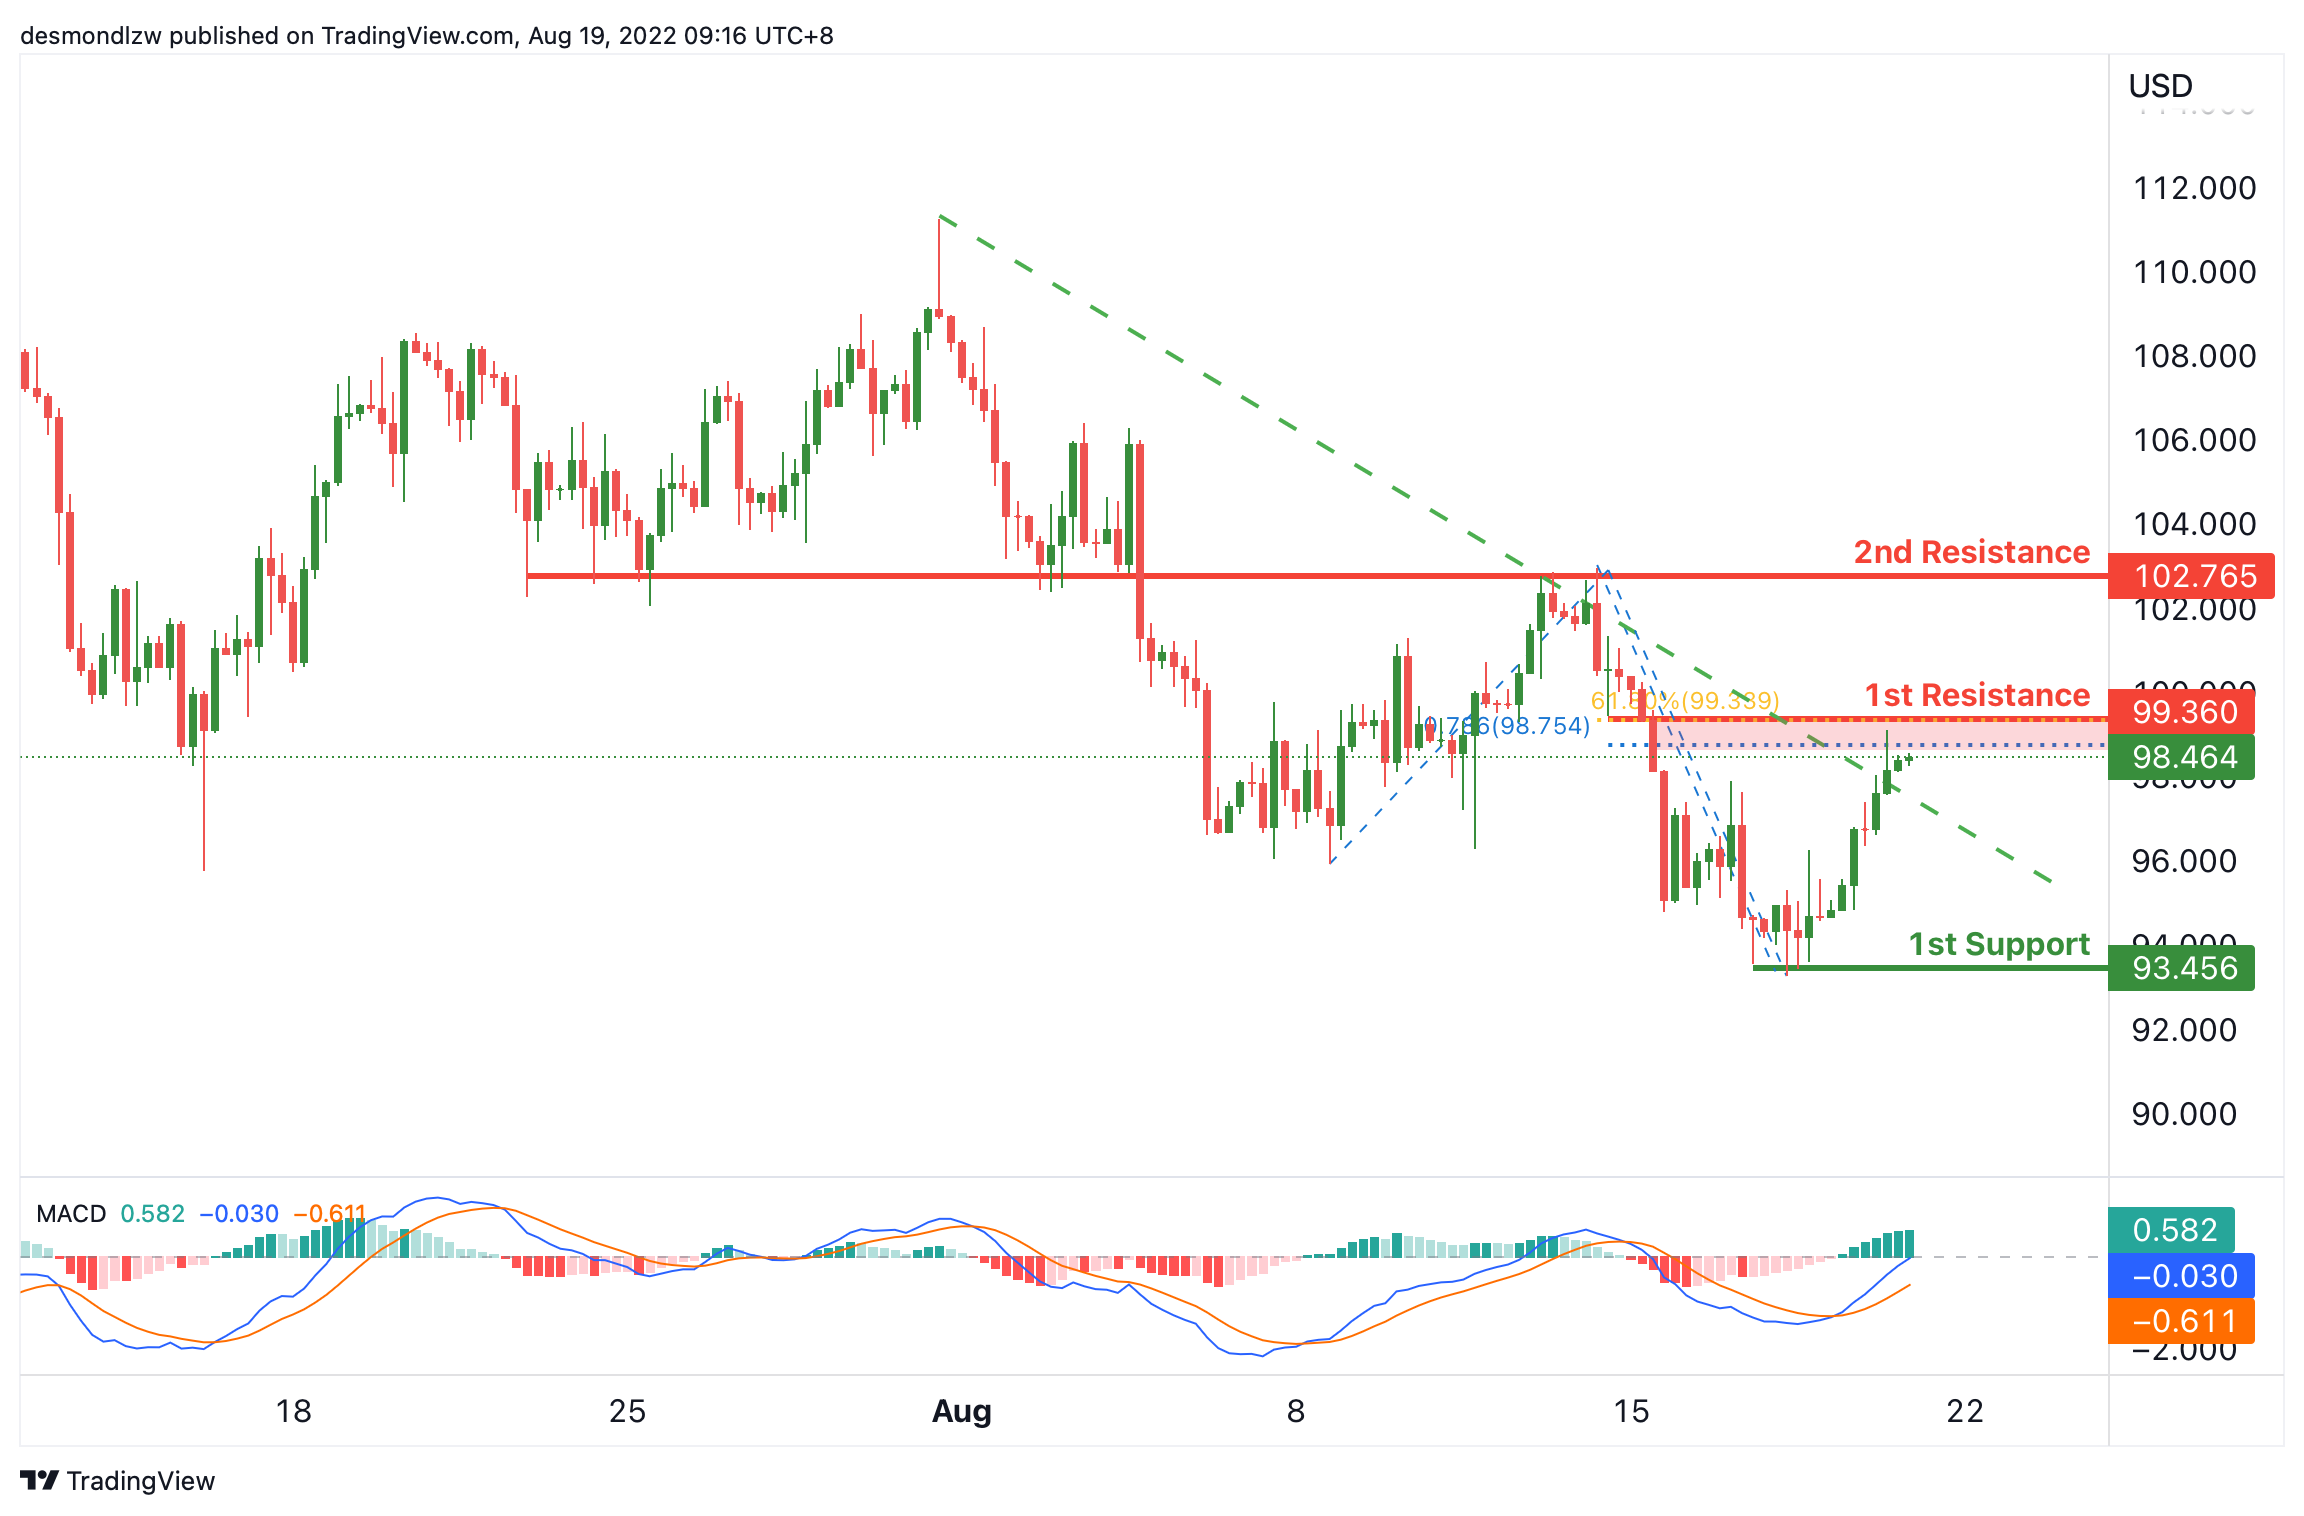
OIL:
On the H4, with price breaking the descending channel and DIF line is breaking zero, if the price break the 1st resistance at 99.360, which is in line with the 61.8% fibonacci retracement, 78.6% fibonacci projection, we can expect the price rise to the 2nd resistance at 102.765, which is in line with the overlap resistance. Alternatively, the price may drop to the descending trendline and go down to the 1st support at 93.456, which is in line with the swing low.
Areas of consideration:
- H4 time frame, 1st resistance at 99.360
- H4 time frame, 2nd resistance at 102.765
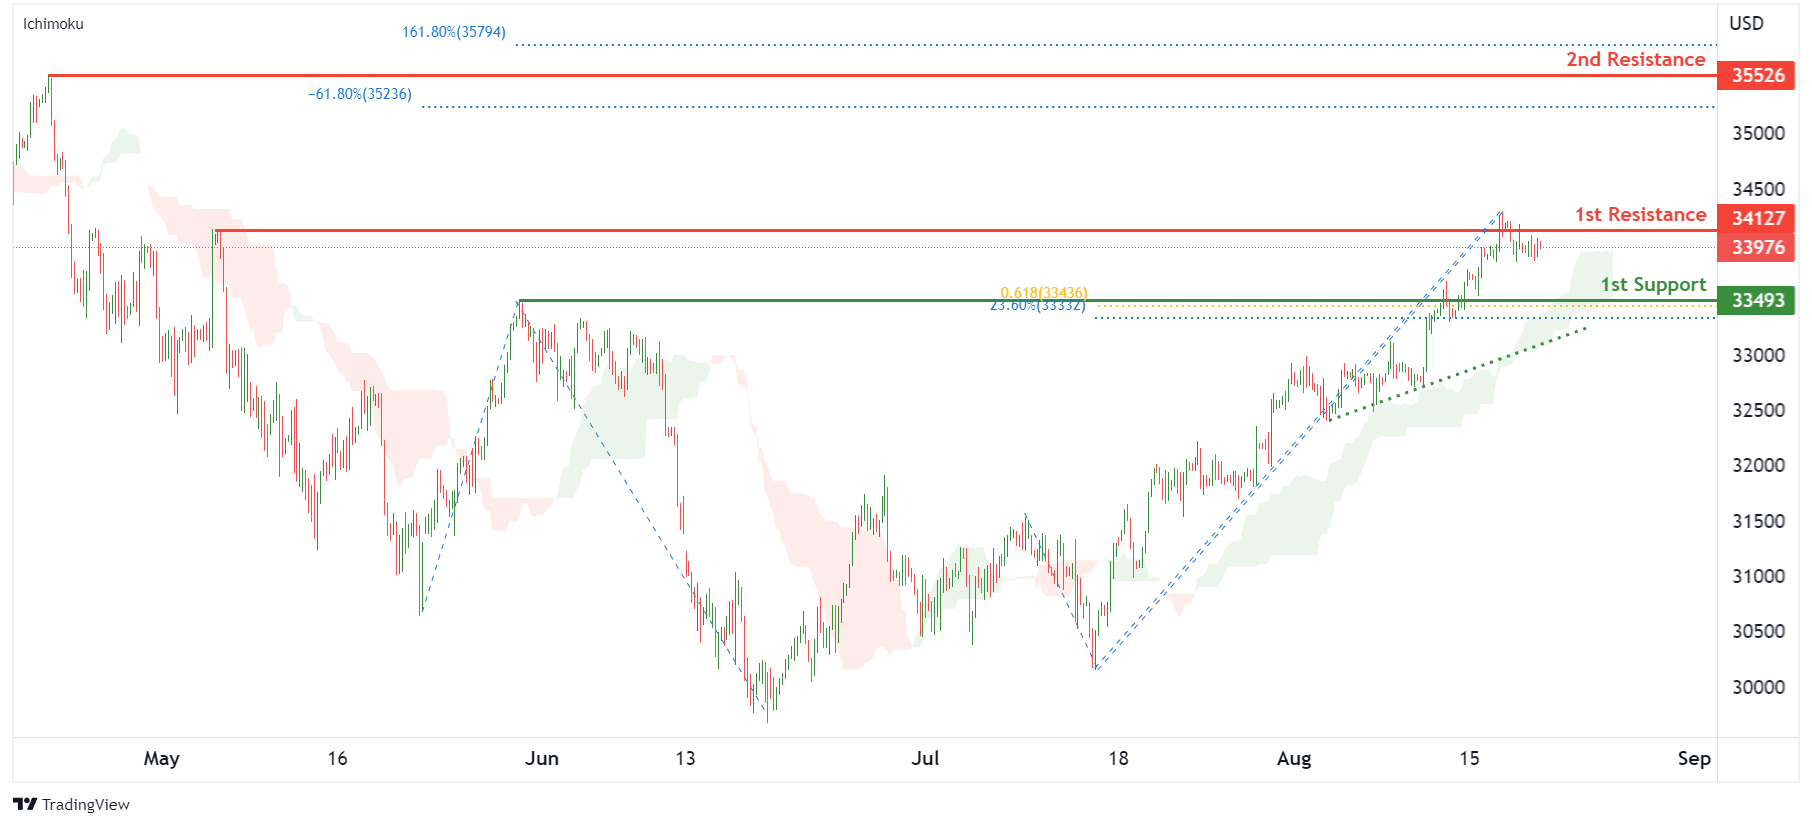
Dow Jones Industrial Average:
On the H4, with price moving above the ichimoku indicator and along an ascending trendline, we have a bullish bias that price will rise to 1st resistance at 34127 where the pullback resistance is. Once there is upside confirmation that price has broken 1st resistance structure, we would expect bullish momentum to carry price to 2nd resistance at 35526 where the swing high resistance, 161.8% fibonacci extension and -61.8% fibonacci expansion are. Alternatively, price could drop to 1st support at 33493 where the pullback support, 61.8% fibonacci projection and 23.6% fibonacci retracement are.
Areas of consideration:
- H4 time frame, 1st resistance of 34127
- H4 time frame, 1st support at 33493
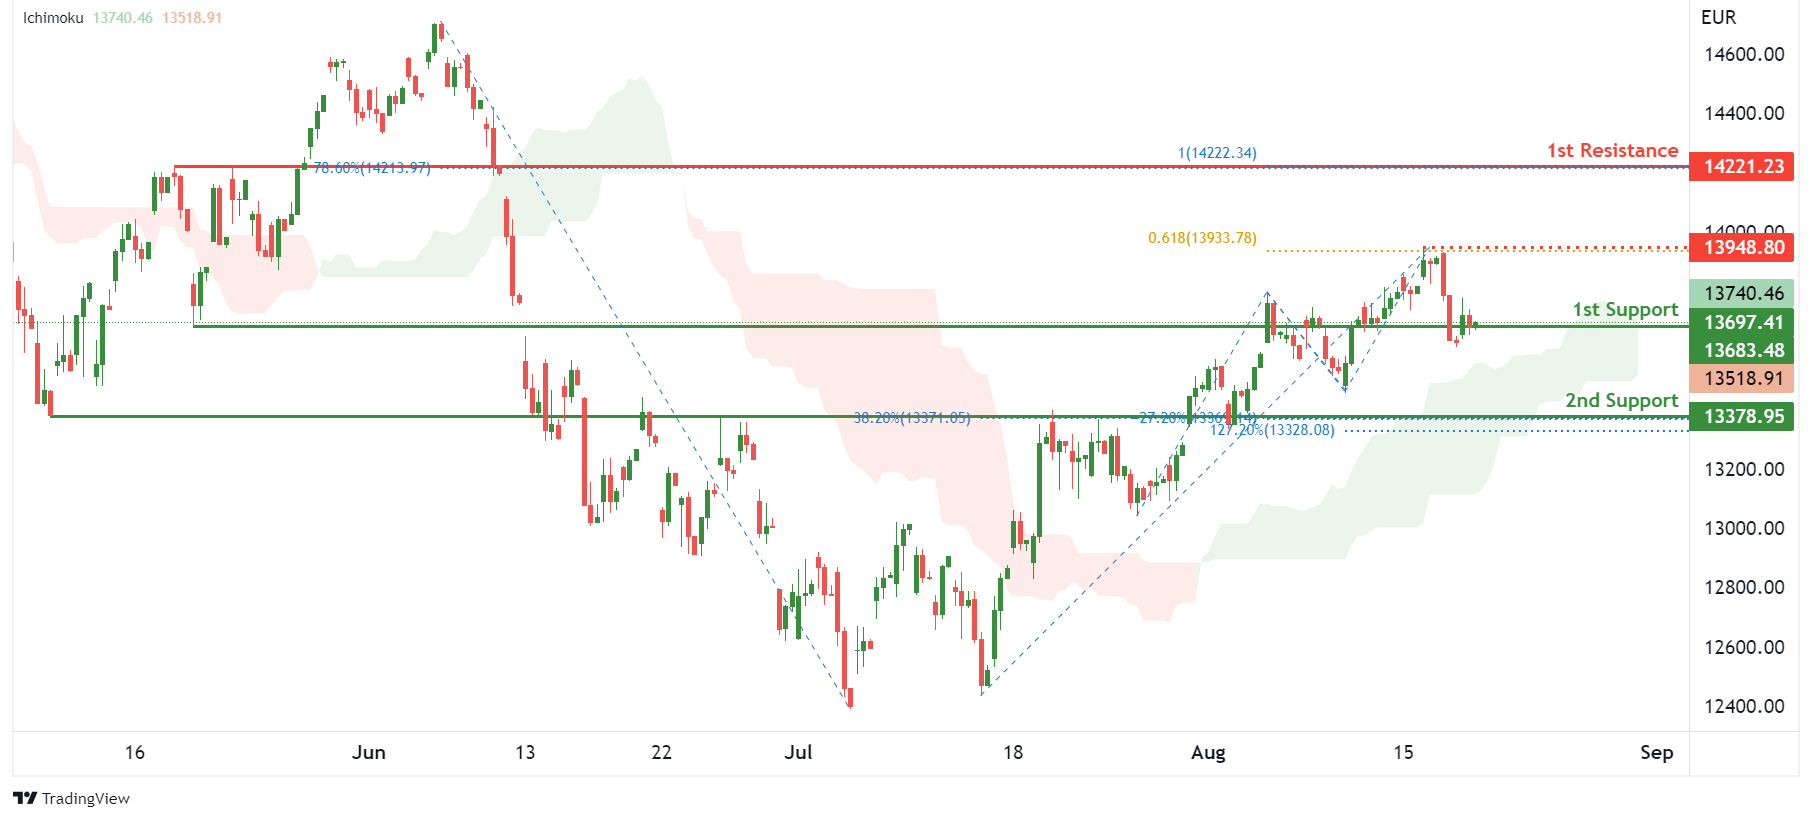
DAX:
On the H4, with price moving above the ichimoku indicator, we have a bullish bias that price will rise to the 1st resistance at 13683.48 where the pullback resistance is. Once there is upside confirmation of price breaking the 1st resistance structure, we would expect price to rise to 2nd resistance at 14221.23 in line with 100% fibonacci projection and 78.6% fibonacci retracement. Take note of intermediate resistance at 13948.80 where the swing high resistance and 61.8% fibonacci projection are. Alternatively, price could drop to 1st support at 13378.95 where the overlap support, -27.2% fibonacci expansion, 127.2% fibonacci extension and 38.2% fibonacci retracement are
Areas of consideration:
- H4 time frame, 1st resistance of 13683.48
- H4 time frame, 1st support at 13378.95
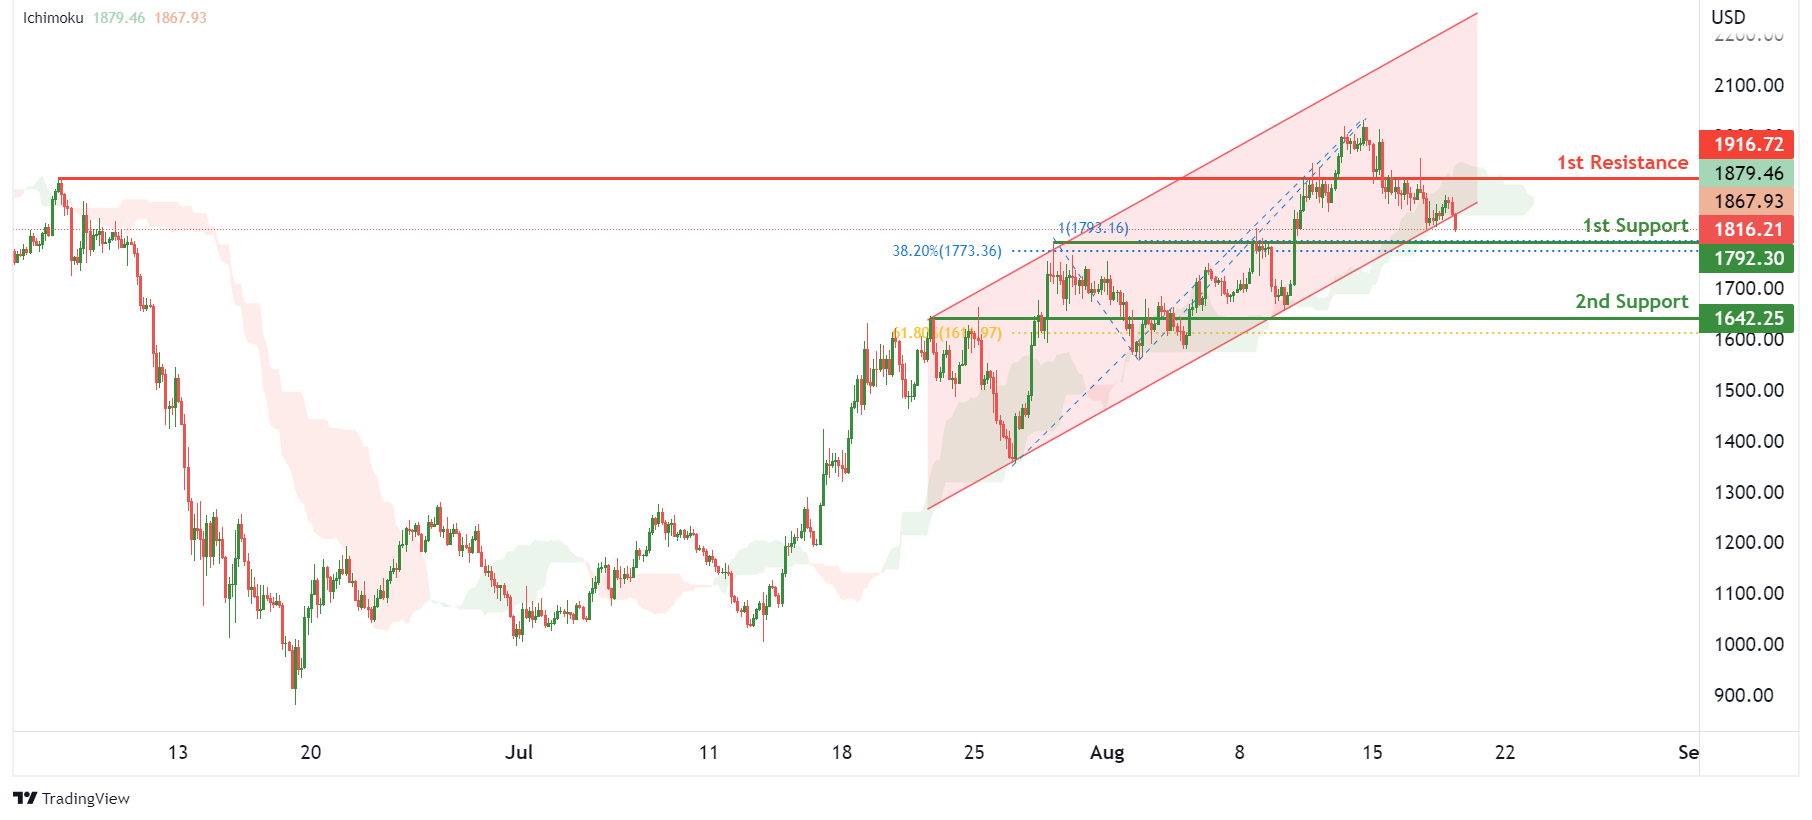
ETHUSD:
On the H4, with price moving within an ascending channel and bouncing off the ichimoku support, we have a bullish bias that price will rise to the 1st resistance at 1916.72 where the pullback resistance is. Once there is upside confirmation that price has broken 1st resistance structure, we would expect bullish momentum to carry price to 2nd resistance at 2015.54 where the swing high resistance is. Alternatively, price could drop to 1st support at 1792.30 where the overlap support, 38.2% fibonacci retracement and 100% fibonacci projection are.
Areas of consideration:
- H4 time frame, 1st resistance of 1916.72
- H4 time frame, 1st support at 1792.30
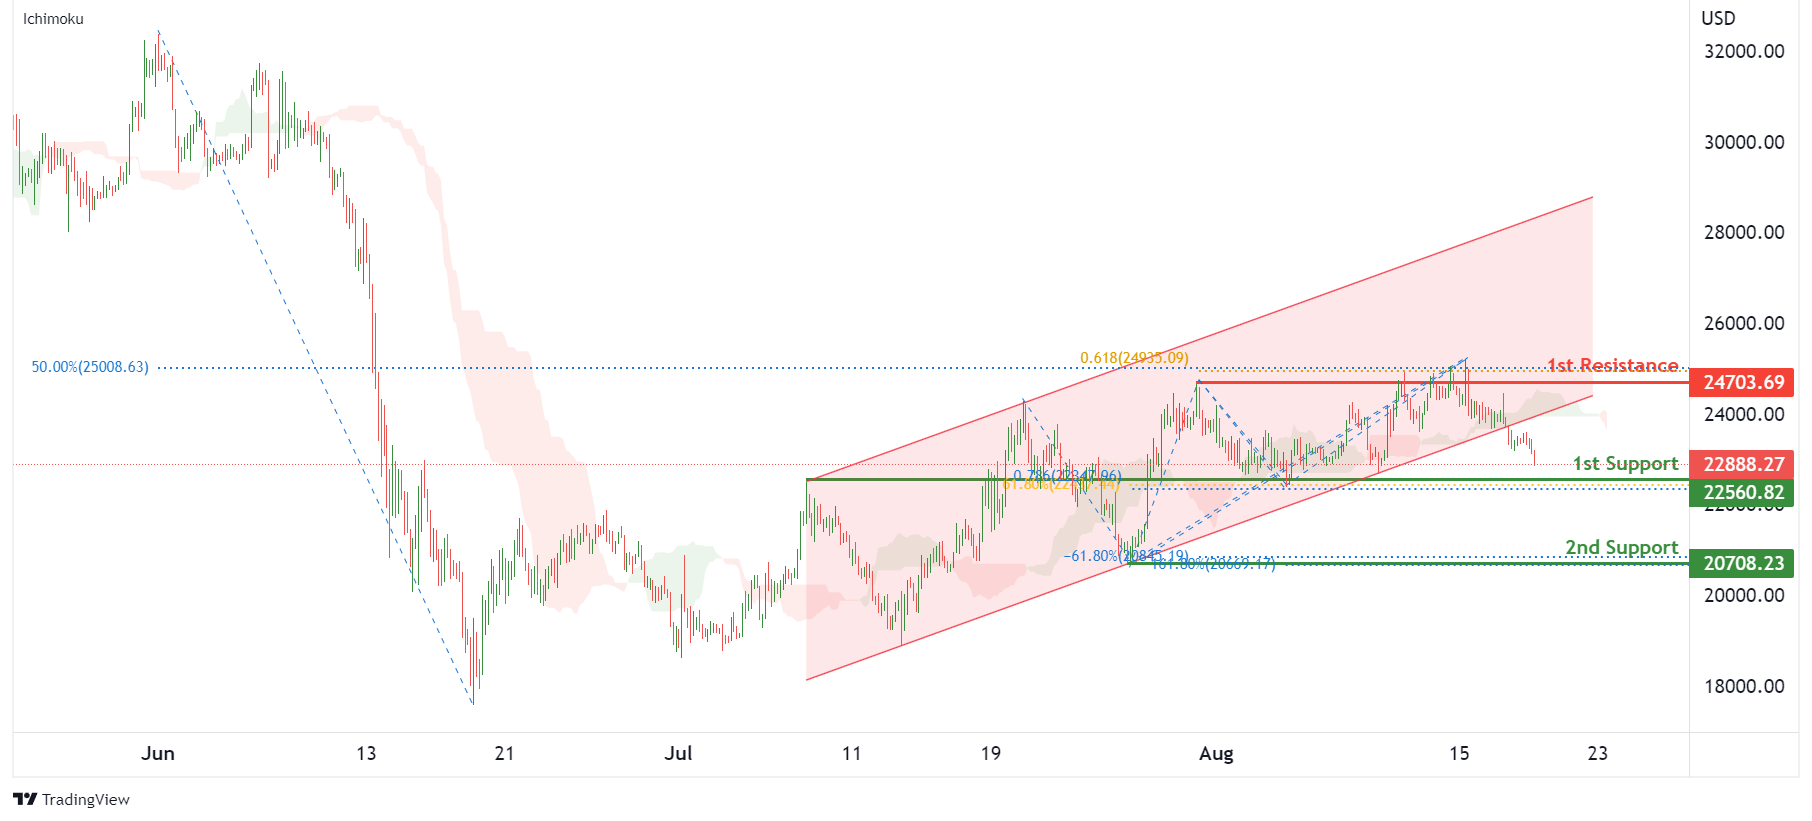
BTCUSD:
On the H4, with price breaking out of a bullish channel and moving below the ichimoku indicator, we have a bearish bias that price will drop to 1st support at 22560.82 where the pullback support, 61.8% fibonacci retracement and 78.6% fibonacci projection are. Once we have downside confirmation of price breaking 1st support structure,we would expect bearish momentum to carry price to 2nd support at 20708.23 where the -61.8% fibonacci expansion, 161.8% fibonacci extension and swing low support are. Alternatively, price could rise to 1st resistance at 24703.69 where the pullback resistance, 50% fibonacci retracement and 61.8% fibonacci projection are.
Areas of consideration:
- H4 time frame, 1st resistance of 24703.69
- H4 time frame, 1st support at 22560.82
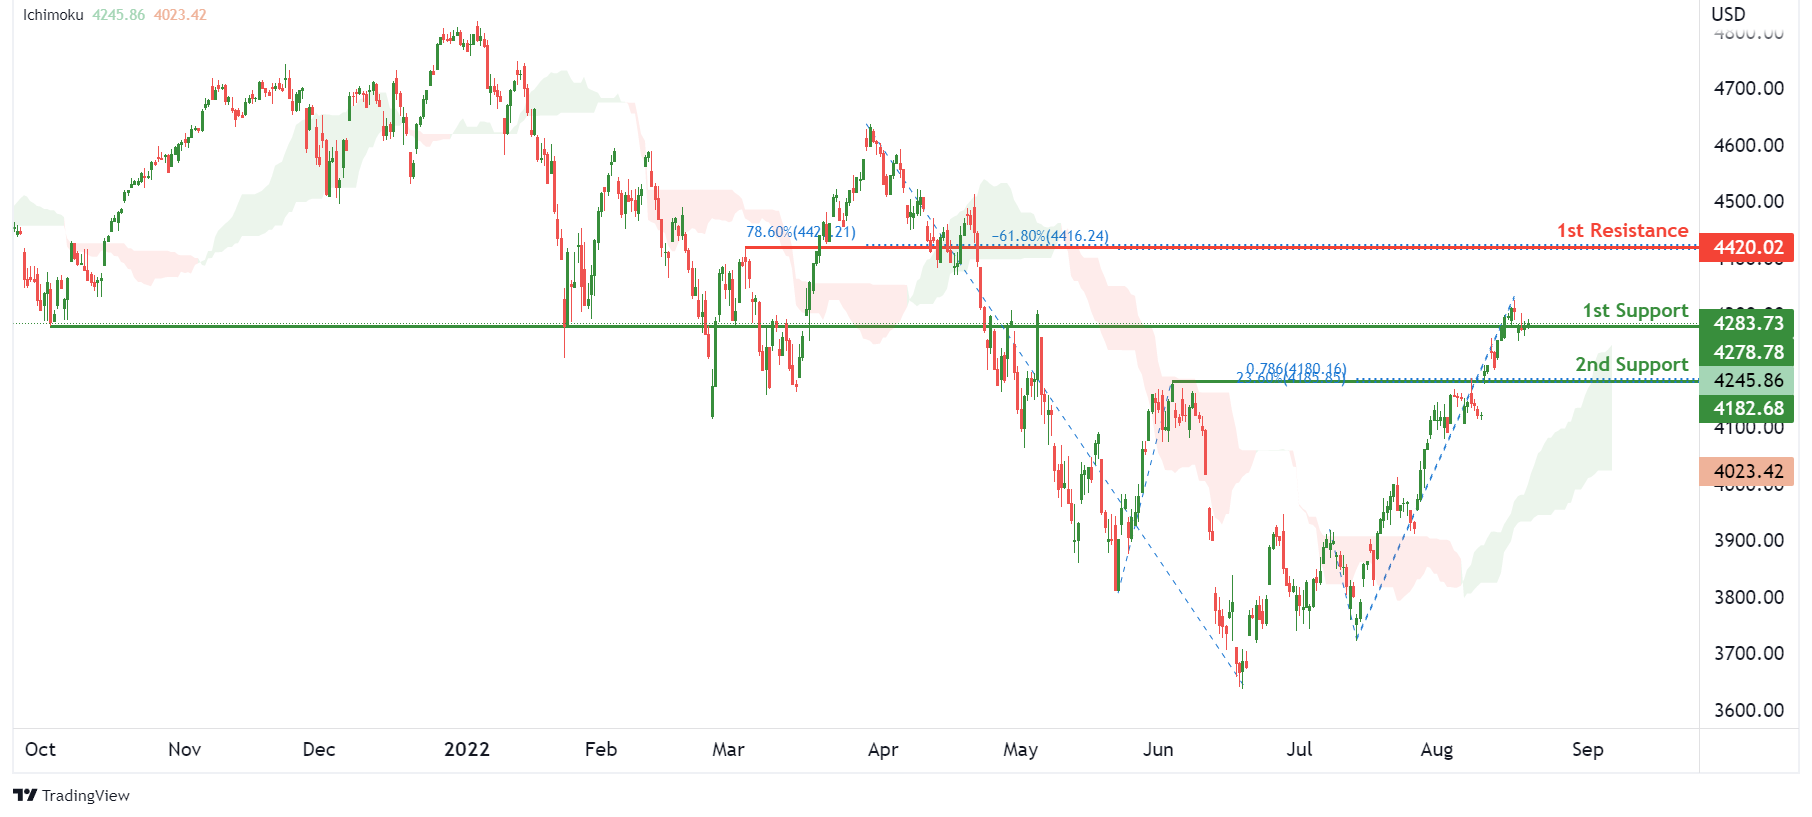
S&P 500:
On the H4, with prices moving above the ichimoku indicator, we have a bullish bias that the price will rise to 1st resistance at 4278.78 where the overlap resistance is. Once there is upside confirmation that price has broken the 1st resistance structure, we would expect bullish momentum to carry price to 2nd resistance at 4420.02 where the pullback resistance, 78.6% fibonacci retracement and -61.8% fibonacci expansion are. Alternatively, price could drop to 1st support at 4182.68 where the pullback support, 78.6% fibonacci projection and 23.6% fibonacci retracement are.
Areas of consideration:
- H4 time frame, 1st resistance of 4278.78
- H4 time frame, 1st support at 4182.68


