
USD/JPY:
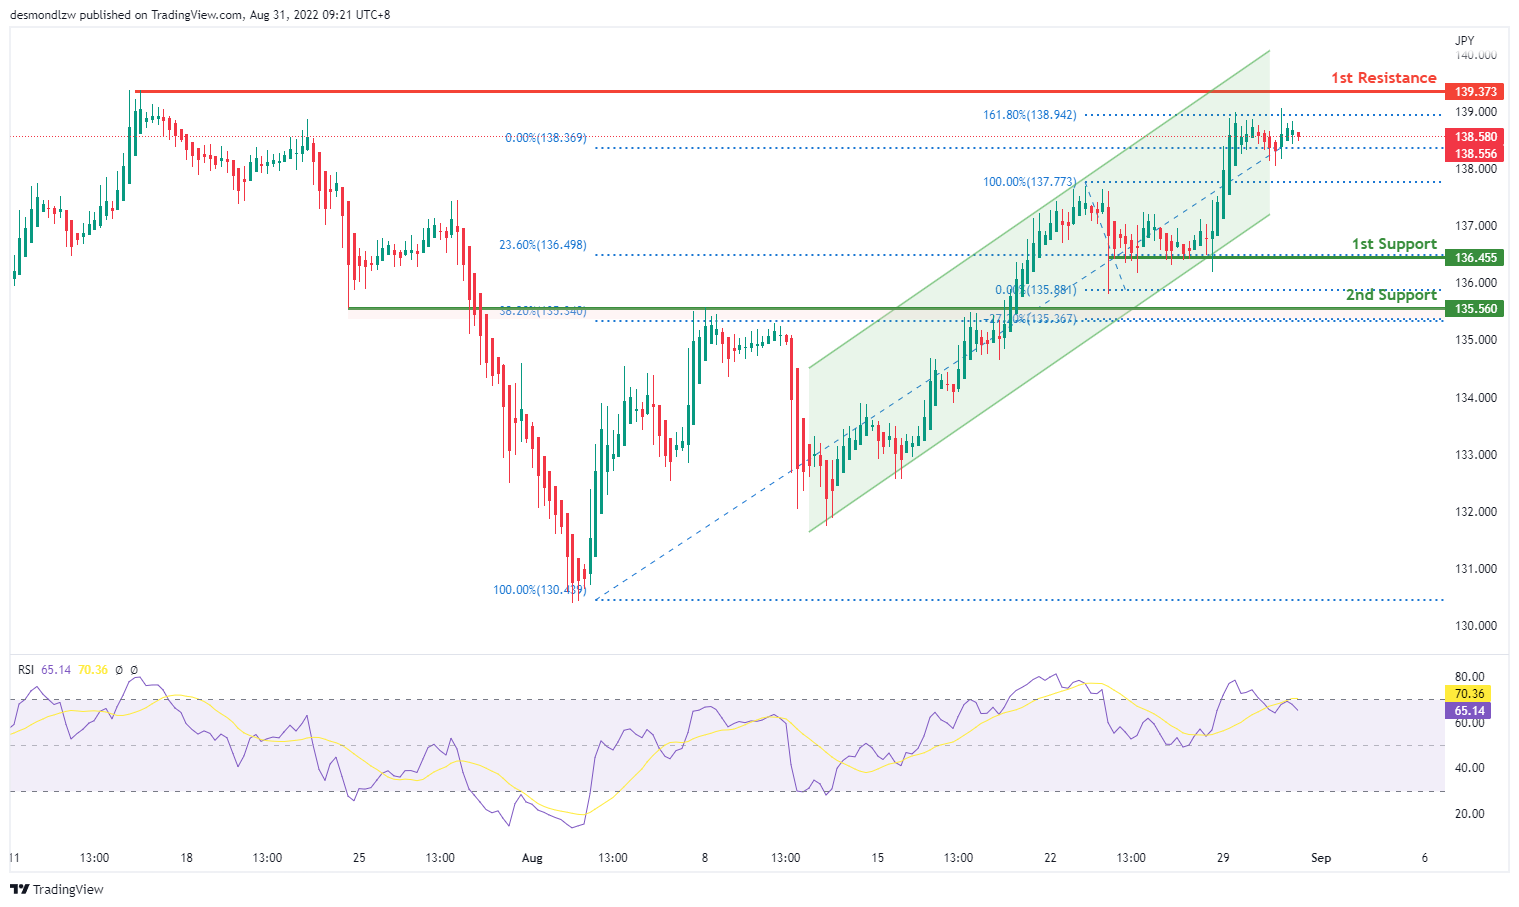
On the H4 chart, price has confirmed a bullish momentum breaking the previous high. We are bullish bias- Price has tested 138.870 where the previous swing high and 161.8% extension sits and is looking to move toward the first resistance at 139.373 where the previous swing high sits. Alternatively, if price reverse, it might pull back to test the first support at 136.455 where the 23.6% fibonacci retracement sits then subsequently the second support at 135.560 where the 38.2% retracement sits
Areas of consideration:
- H4 time frame, 1st resistance at 139.373
- H4 time frame, 1st support at 136.455
DXY:
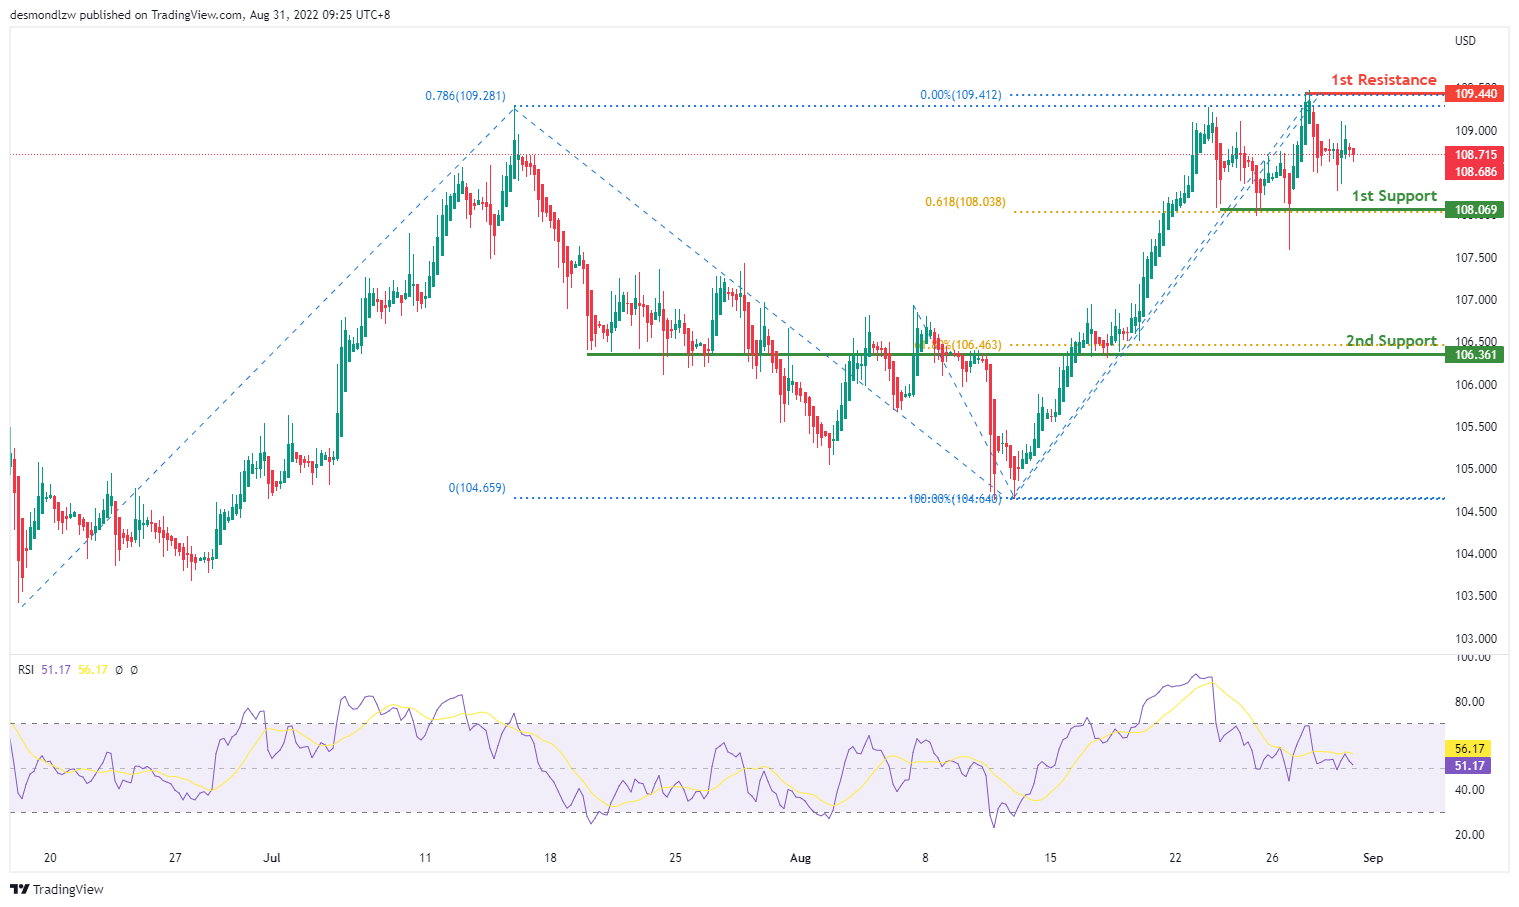
On the H4, price is still moving in an ascending trend and is in a bullish momentum. Price has tested the first resistance at 109.440 where the 78.6% Fibonacci projection and the previous swing high sits. If price fails to break this level, it will pull back to test the first support at 108.069 where the 61.8% projection sits and subsequently the second support at 106.235 where the 61.8% retracement sits
Areas of consideration:
- H4 time frame, 1st resistance at 109.440
- H4 time frame, 1st support at 108.069
EUR/USD:
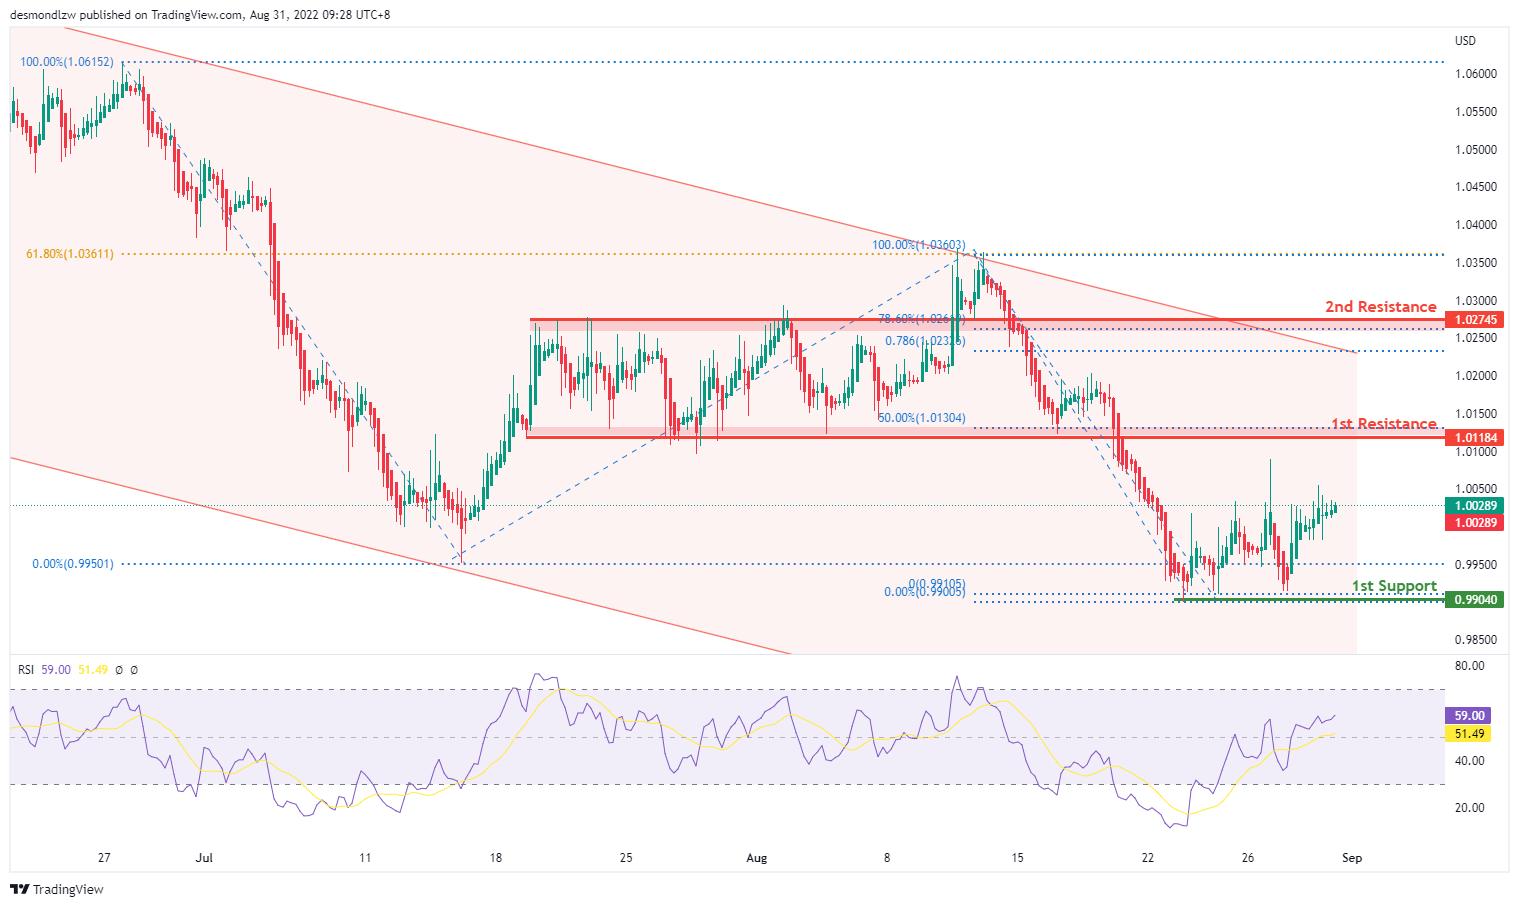
On the H4, prices seem to have formed a triple bottom and have reversed – we are in a slightly bullish bias. Price look like it’s pulling back to test the first resistance at 1.0118 where the previous swing low and 50% retracement sits and subsequently the second resistance at 1.0274 where the 78.6% retracement and swing high sits
Areas of consideration :
- H4 1st resistance at 1.0118
- H4 1st support at 0.9904
GBP/USD:
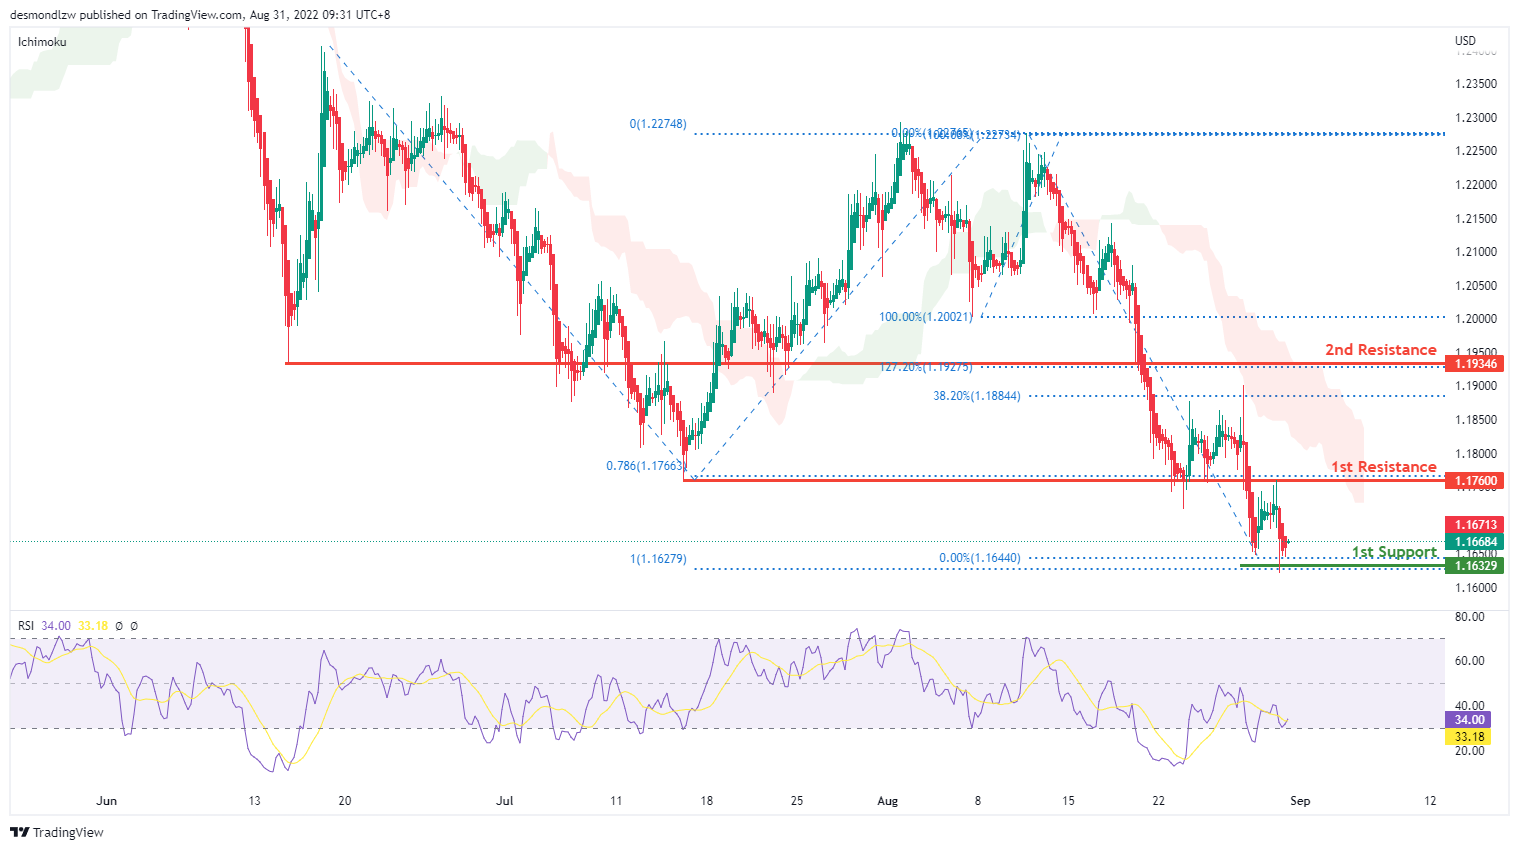
On the H4, prices seem to be in a bearish momentum and respecting the ichimoku cloud. Prices have broken the 78.6% projection level and is testing the first support, 100% projection at 1.1632 levels again. If price fails to break this level, it might look to test the first resistance at 1.1760 level where the 78.6% projection sits then the second resistance at 1.1934 level where the previous swing low and 127.2% extension sits
Areas of consideration:
- H4 1st resistance at 1.176
- H4 1st support at 1.1632
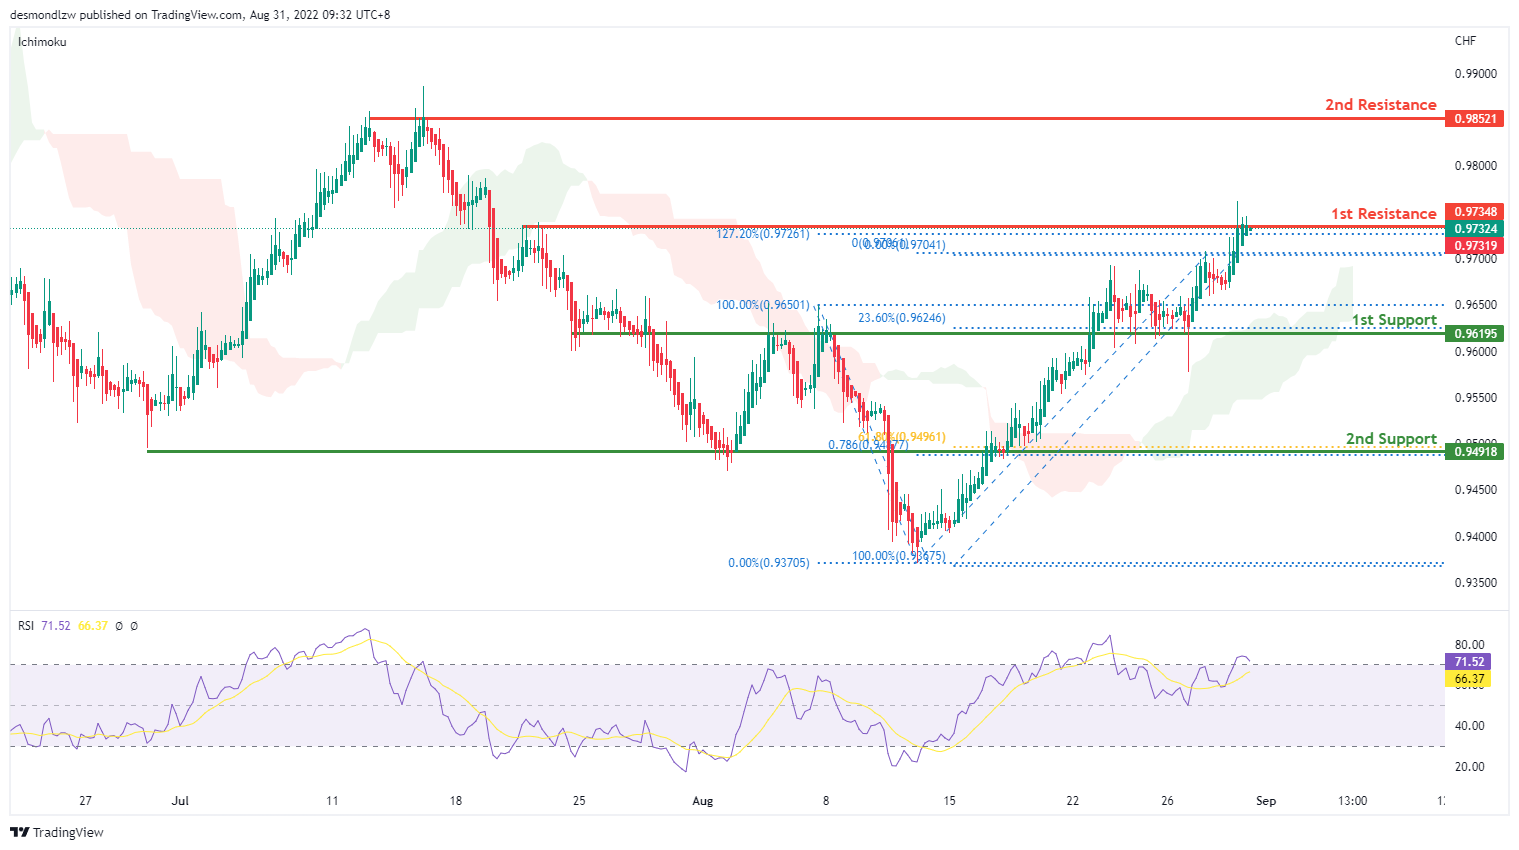
USD/CHF:
On the H4, with prices moving above the ichimoku cloud and breaking the descending trend, we are bullish. Price is currently testing the first resistance at 0.9734 where the 127.2% extension sits. If price continues with bullish momentum, it will bring price to second resistance at 0.9852. Alternatively, prices could pull back to test the first support at 0.96282 where the 23.6% fibonacci retracement and previous swing low sits then the second support at 0.9491 where the 61.8% retracement and 78.6% projection sits
Areas of consideration
- H4 1st support at 0.9628
- H4 1st resistance at 0.9734
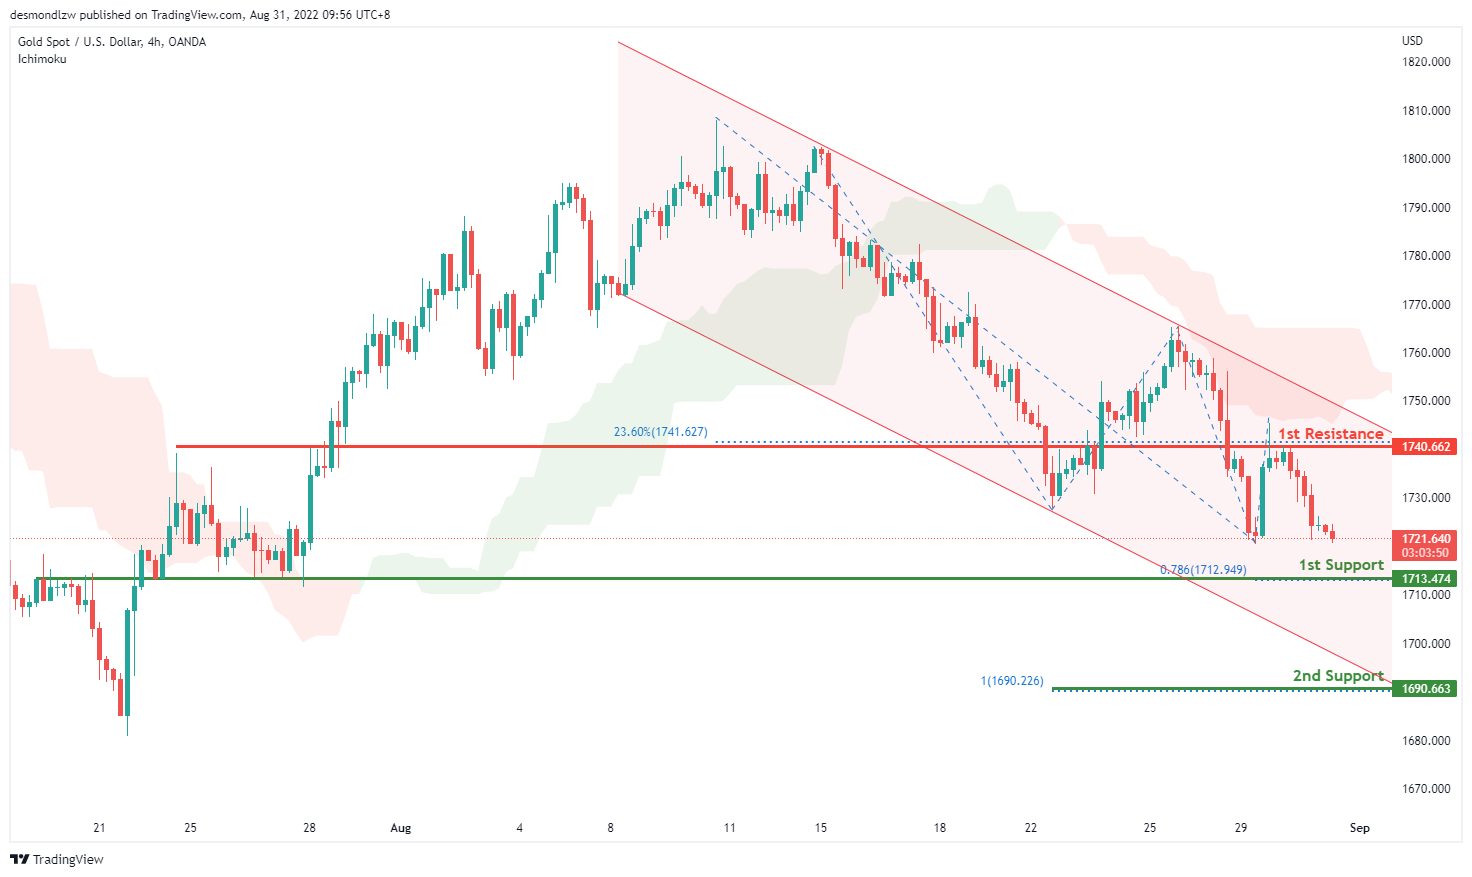
XAU/USD (GOLD):
On the H4, with prices below ichimoku cloud and moving within the descending channel, we have a bearish bias that the price may drop to the 1st support at 1713.474, where the overlap support and 78.6% fibonacci projection are. If the price can break this support line, the next support level could be at 1690.663, where the 100% fibonacci projection is. Alternatively, the price may rise to the 1st resistance at 1740.662, where the swing highs and 23.6% fibonacci retracement are.
Areas of consideration:
- H4 time frame, 1st support at 1713.474
- H4 time frame, 2nd support at 1690.663
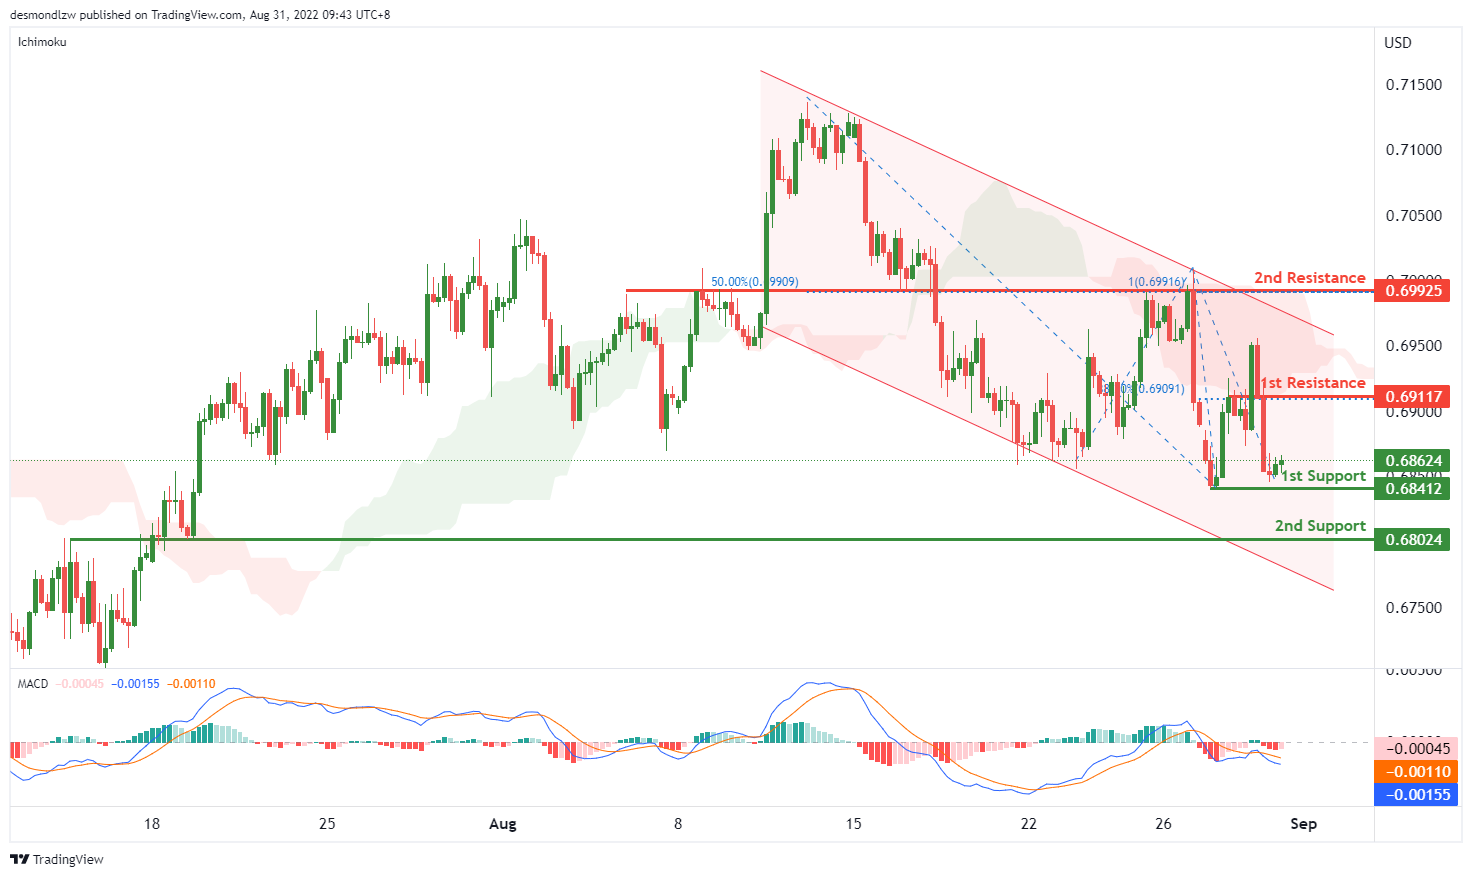
AUD/USD:
On the H4, with the price moving below the ichimoku cloud, moving within the descending channel and MACD is showing a death cross, we have a bearish bias that the price may drop to the 1st support at 0.68412, which is in line with the swing low to the 2nd support at 0.68024, where the overlap support is. Alternatively, the price may rise to the 1st resistance at 0.69118, where the 38.2% fibonacci retracement and previous swing high are. If the price can break this resistance level, we can expect the price to rise to the 2nd resistance at 0.69925, where the swing highs, 50% fibonacci retracement and 100% fibonacci projection are.
Areas of consideration
- H4 1st support at 0.68412
- H4 2nd support at 0.68024
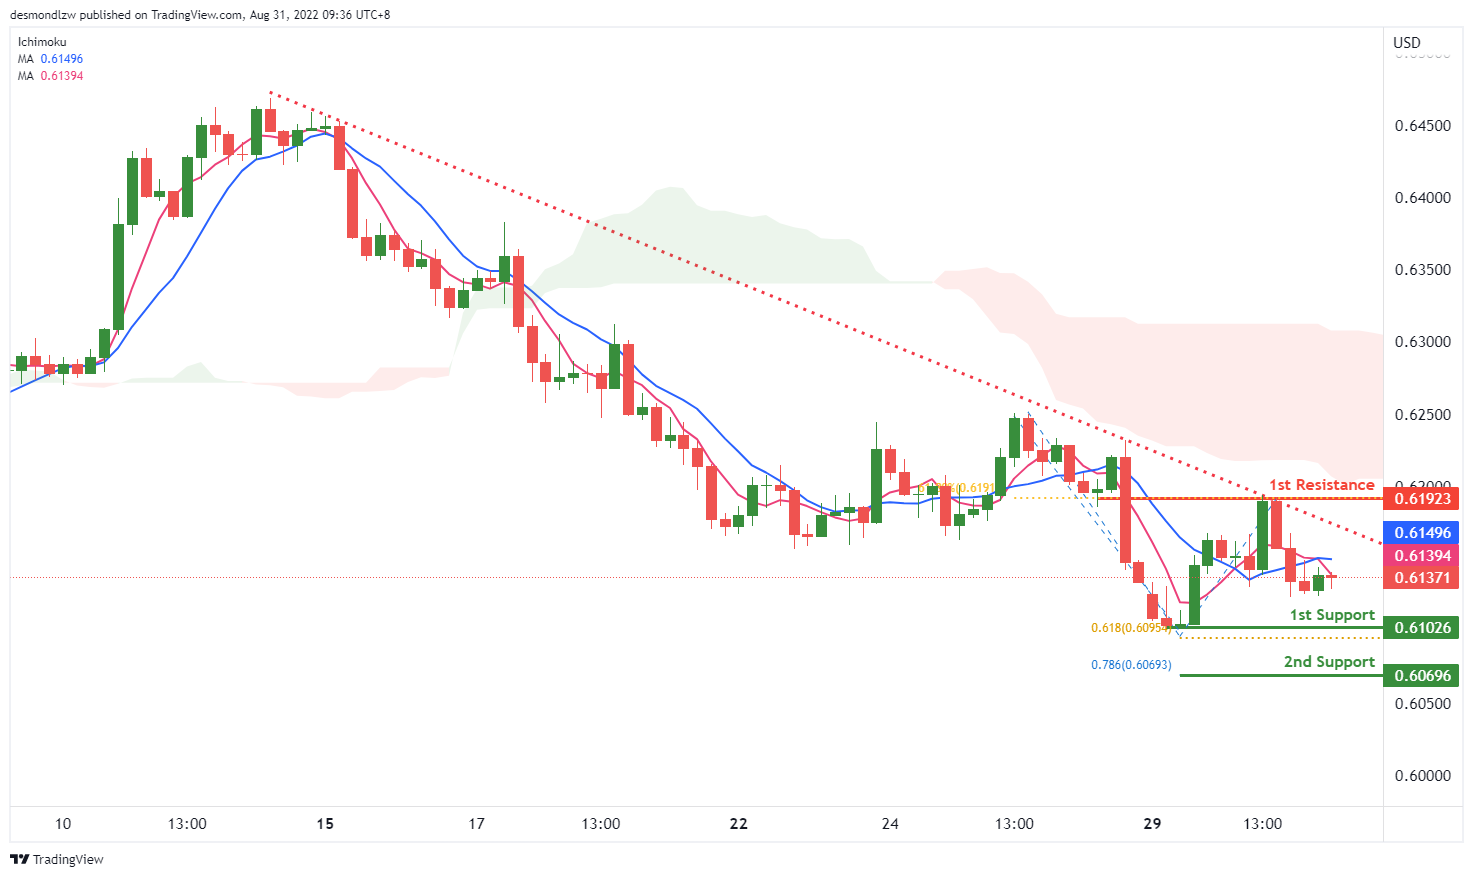
NZD/USD:
On the H4, with price moving within the descending trendline, below the ichimoku indicator and there is a death cross of MA, we have a bearish bias that price may drop to 1st support at 0.61026, where the swing low and 61.8% fibonacci projection are to the 2nd support at 0.60696, where the 78.6% fibonacci projection is. Alternatively, price could rise to 1st resistance at 0.61923, which is in line with 61.8% fibonacci retracement.
Areas of consideration:
- H4 time frame, 1st support at 0.61026
- H4 time frame, 2nd support at 0.60696
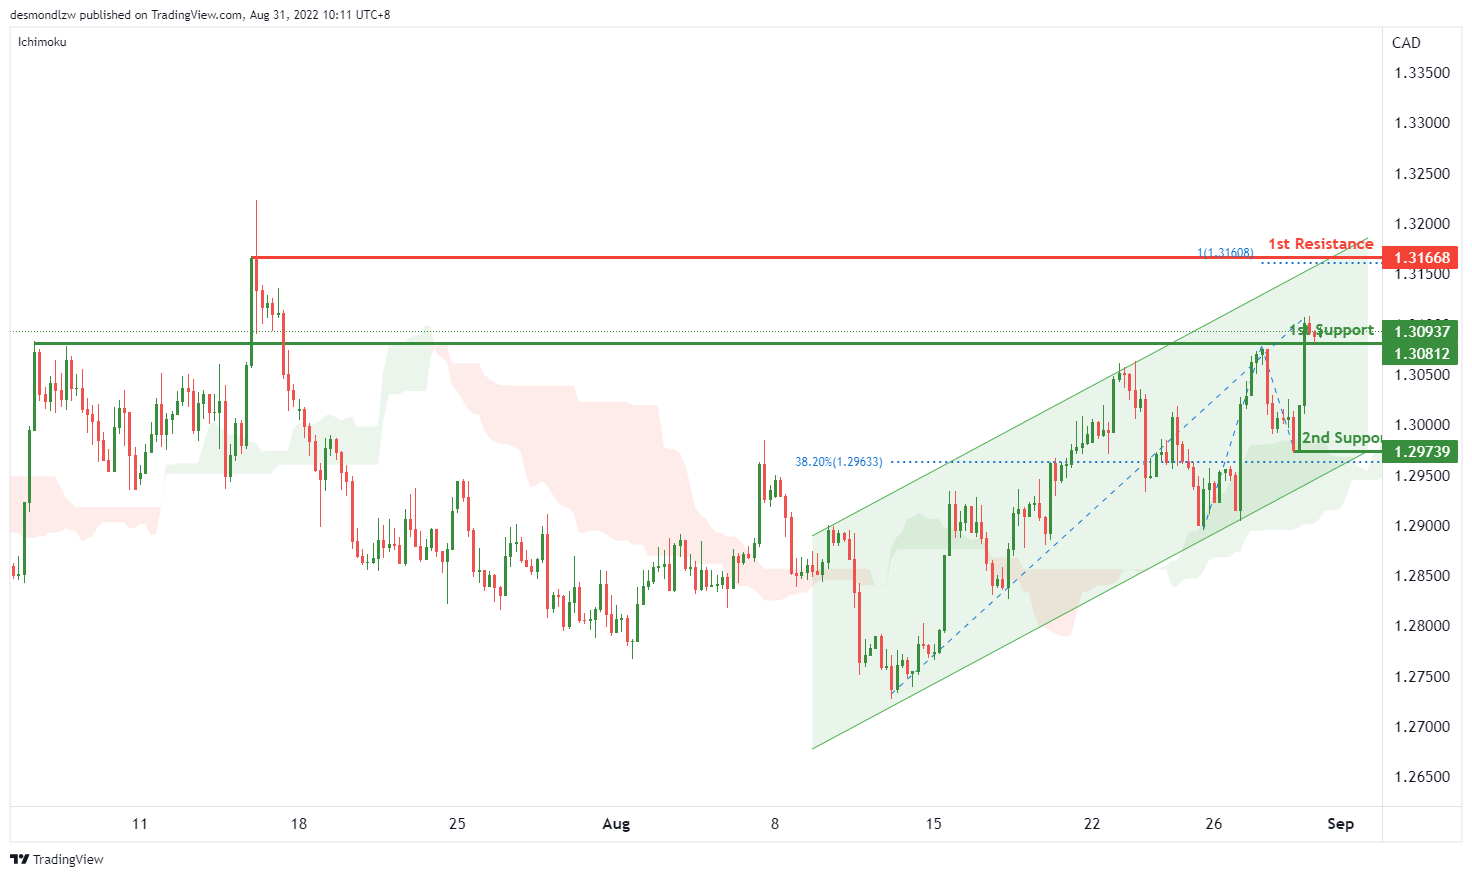
USD/CAD:
On the H4, with the price moving within the ascending channel, above ichimoku cloud, we have a bullish bias that the price may rise from the 1st support at 1.30812, where the swing highs are to the 1st resistance at 1.31668, where the swing high and 100% fibonacci projection are. Alternatively, price could break the 1st support and drop to the 2nd support at 1.29739, where the 38.2% fibonacci retracement and swing low are.
Areas of consideration:
- H4 time frame, 1st support at 1.30812
- H4 time frame, 1st resistance at 1.31668
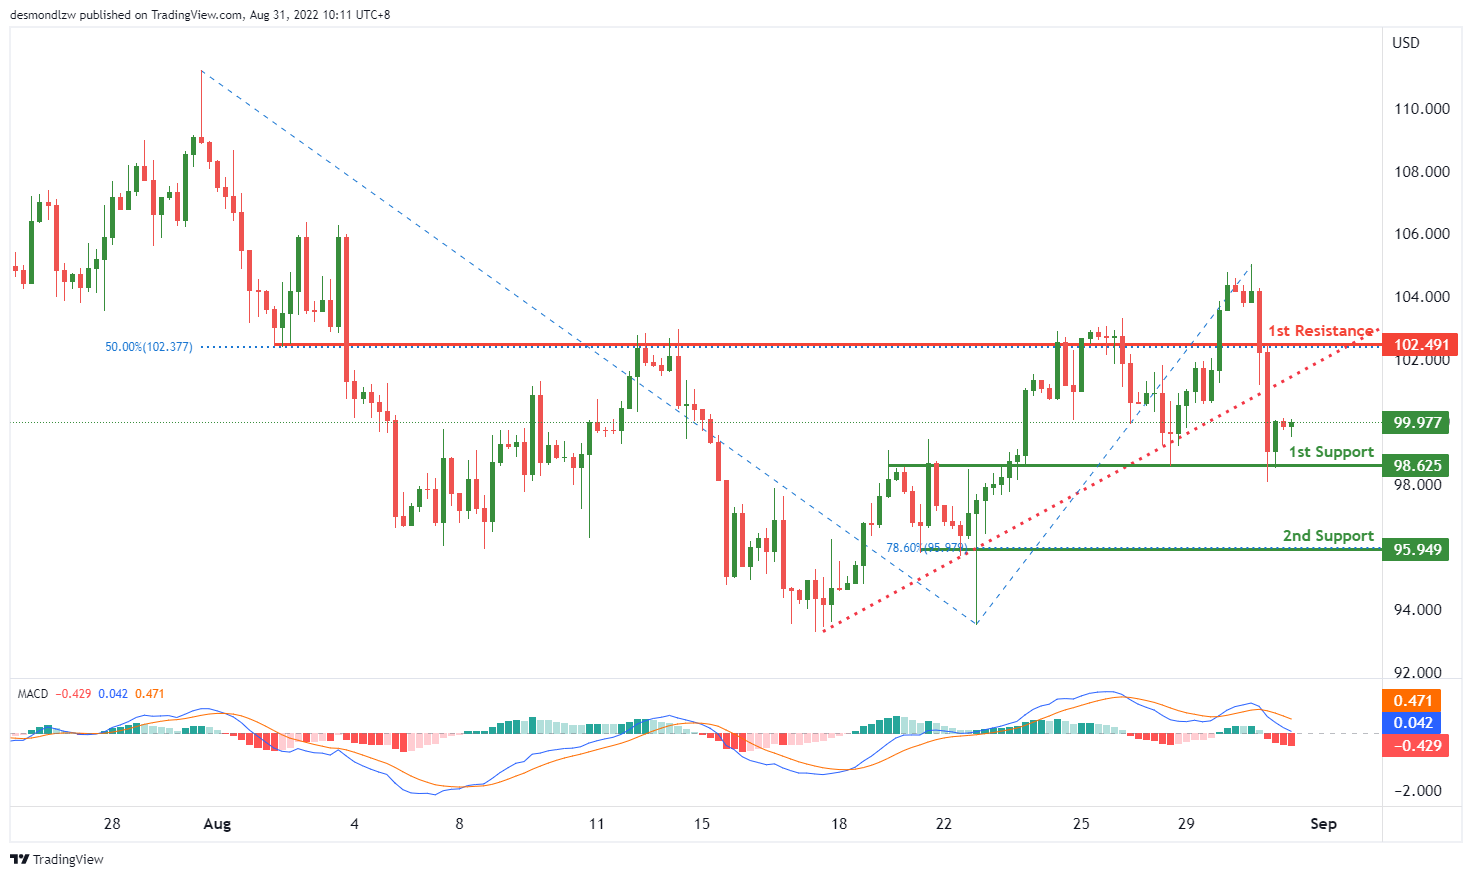
OIL:
On the H4, with price breaking the ascending trendline and MACD is showing a death cross, we have a bearish bias that the price may drop from the 1st support at 98.625, where the overlap support is to the 2nd support at 95.949, where the swing low and 78.6% fibonacci retracement are. Alternatively, the price may rise to the 1st resistance at 102.491, where the overlap support and 50% fibonacci retracement are.
Areas of consideration:
- H4 time frame, 1st support at 98.625
- H4 time frame, 1st resistance at 95.949
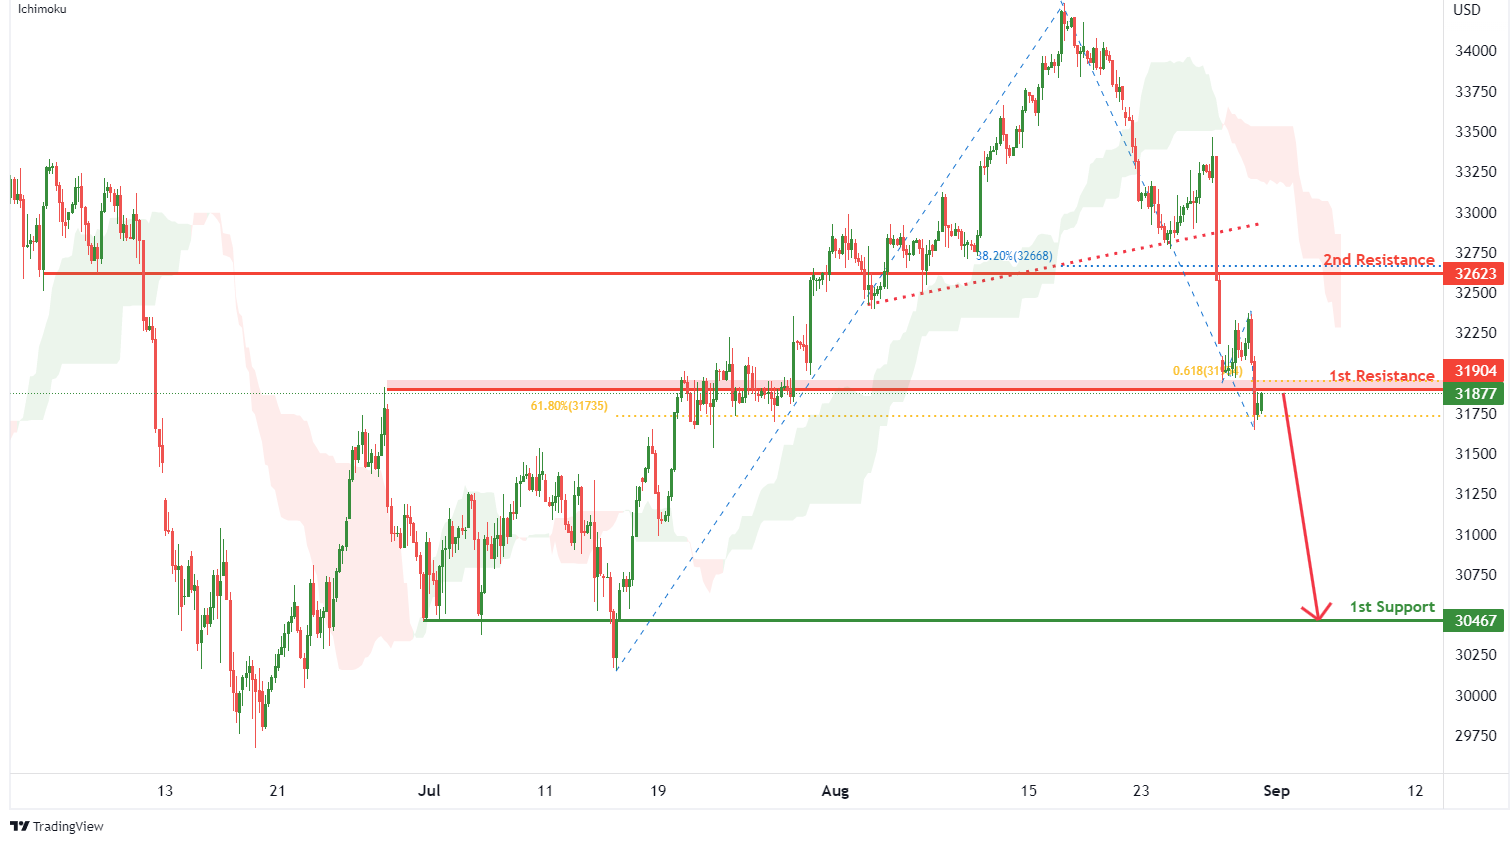
Dow Jones Industrial Average:
On the H4, with price breaking the ascending trendline and moving below the ichimoku indicator, ,we have a bearish bias that price will drop from 1st resistance at 31904 where the pullback resistance, 61.8% fibonacci retracement and 61.8% fibonacci projection are to 1st support at 30467 where the pullback support is. Alternatively, price could break 1st resistance structure and rise to 2nd resistance at 32623 in line with pullback resistance and 38.2% fibonacci retracement.
Areas of consideration:
- H4 time frame, 1st resistance of 31904
- H4 time frame, 1st support at 30467
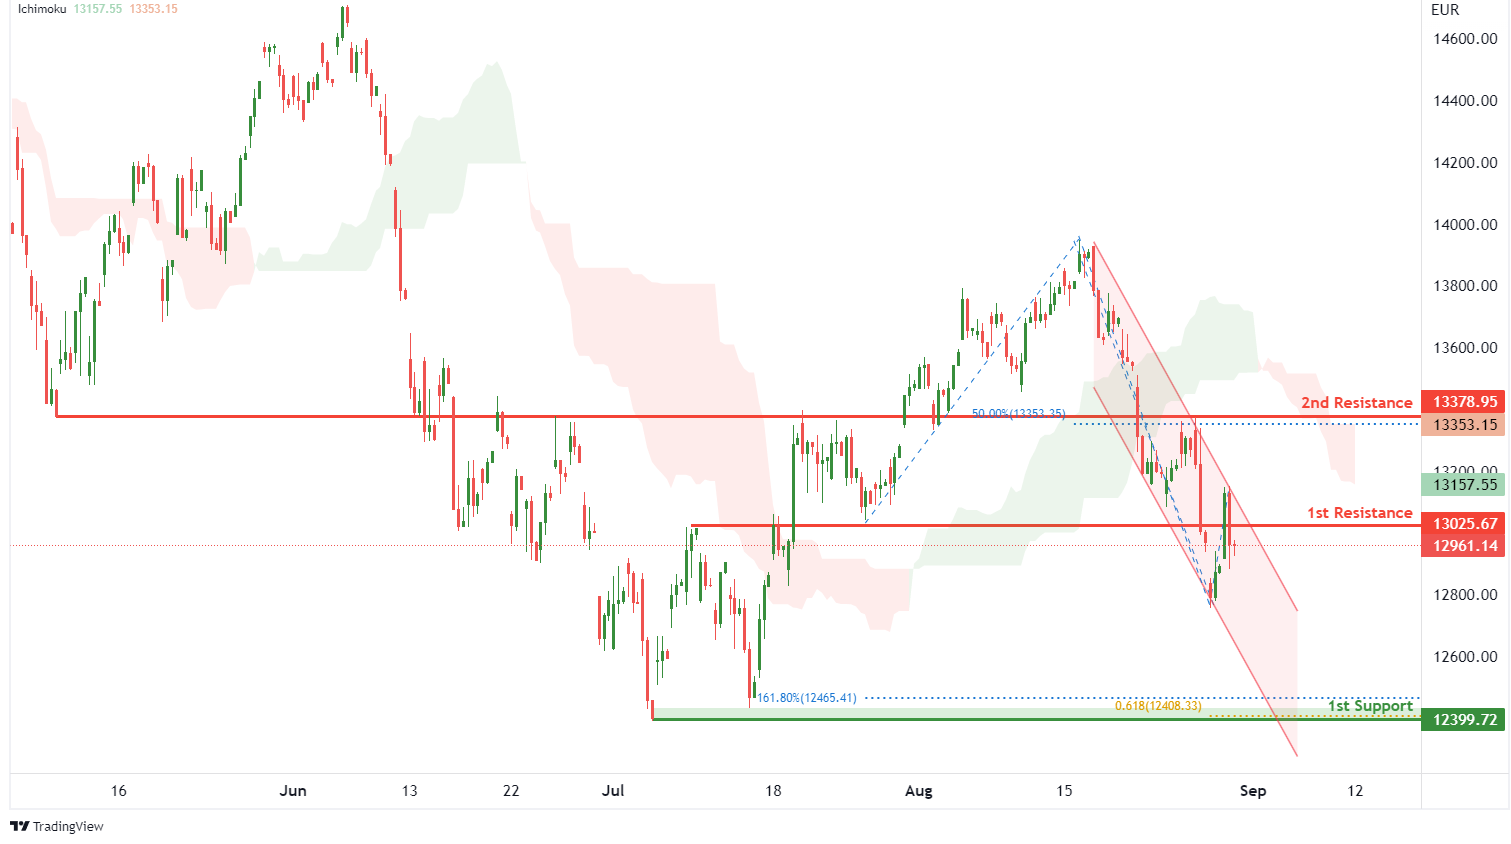
DAX:
On the H4, with price moving within a descending channel and below the ichimoku indicator, we have a bearish bias that price will drop from 1st resistance at 13025.67 where the pullback resistance is to the 1st support at 12399.72 where the swing low support, 61.8% fibonacci projection and 161.8% fibonacci extension are. Alternatively, price could rise to 2nd resistance at 13378.95 where the overlap resistance and 50% fibonacci retracement are.
Areas of consideration:
- H4 time frame, 1st resistance of 13025.67
- H4 time frame, 1st support at 12399.72
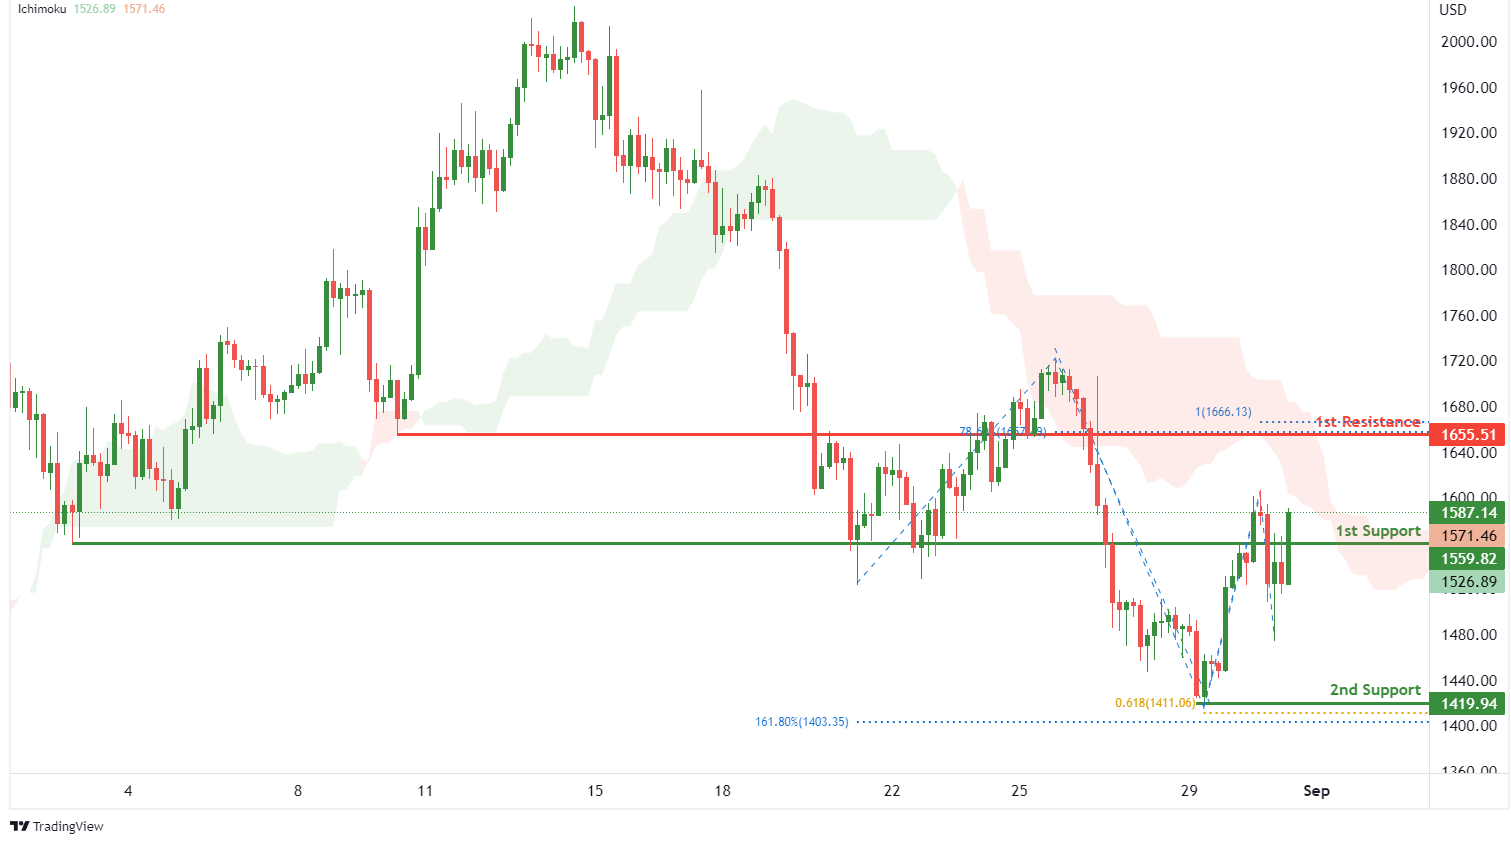
ETHUSD:
On the H4, with price moving below the ichimoku indicator, we have a bearish bias that price will drop to 1st support at 1559.82 where the overlap support is. Once there is downside confirmation of price breaking 1st support, we would expect bearish momentum to carry price to 2nd support at 1419.94 where the swing low support, 61.8% fibonacci projection and 161.8% fibonacci extension. Alternatively, price could rise to 1st resistance at 1655.51 where the pullback resistance, 100% fibonacci projection and 78.6% fibonacci retracement are.
Areas of consideration:
- H4 time frame, 1st resistance of 1655.51
- H4 time frame, 1st support at 1559.82
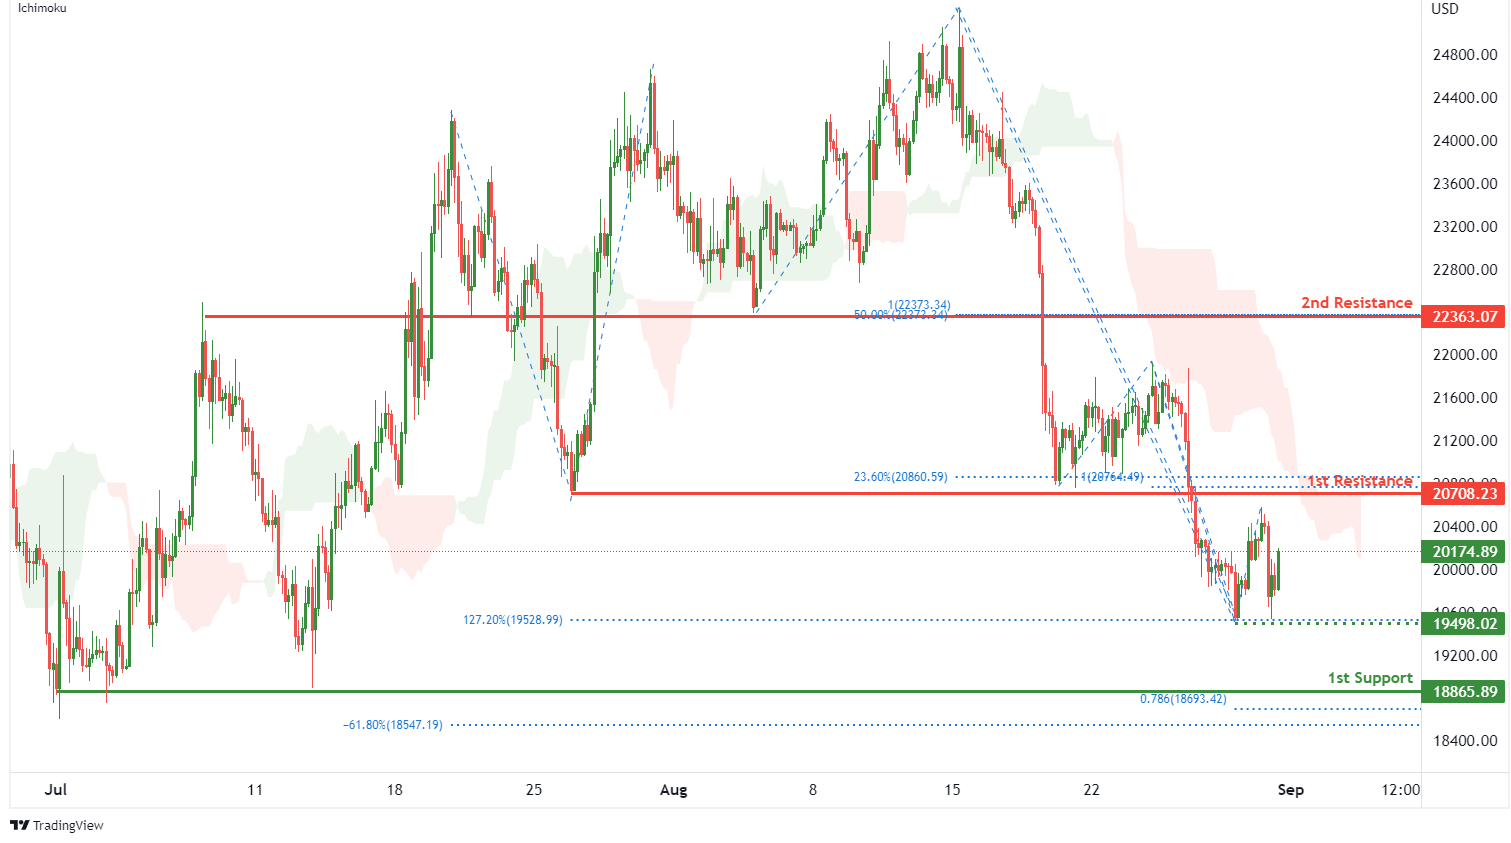
BTCUSD:
On the H4, with price moving below an ichimoku indicator, we have a bearish bias that price will drop from 1st resistance at 20708.23 where the pullback resistance, 100% fibonacci projection and 23.6% fibonacci retracement are to the 1st support at 18865.89 where the swing low support, 78.6% fibonacci projection and -61.8% fibonacci expansion are. Take note of intermediate support at 19498.02 where the 127.2% fibonacci extension and swing low support are. Alternatively, price could break 1st resistance structure and rise to 2nd resistance at 22363.07 where the overlap resistance, 100% fibonacci projection and 50% fibonacci retracement are.
Areas of consideration:
- H4 time frame, 1st resistance of 20708.23
- H4 time frame, 1st support at 18865.89
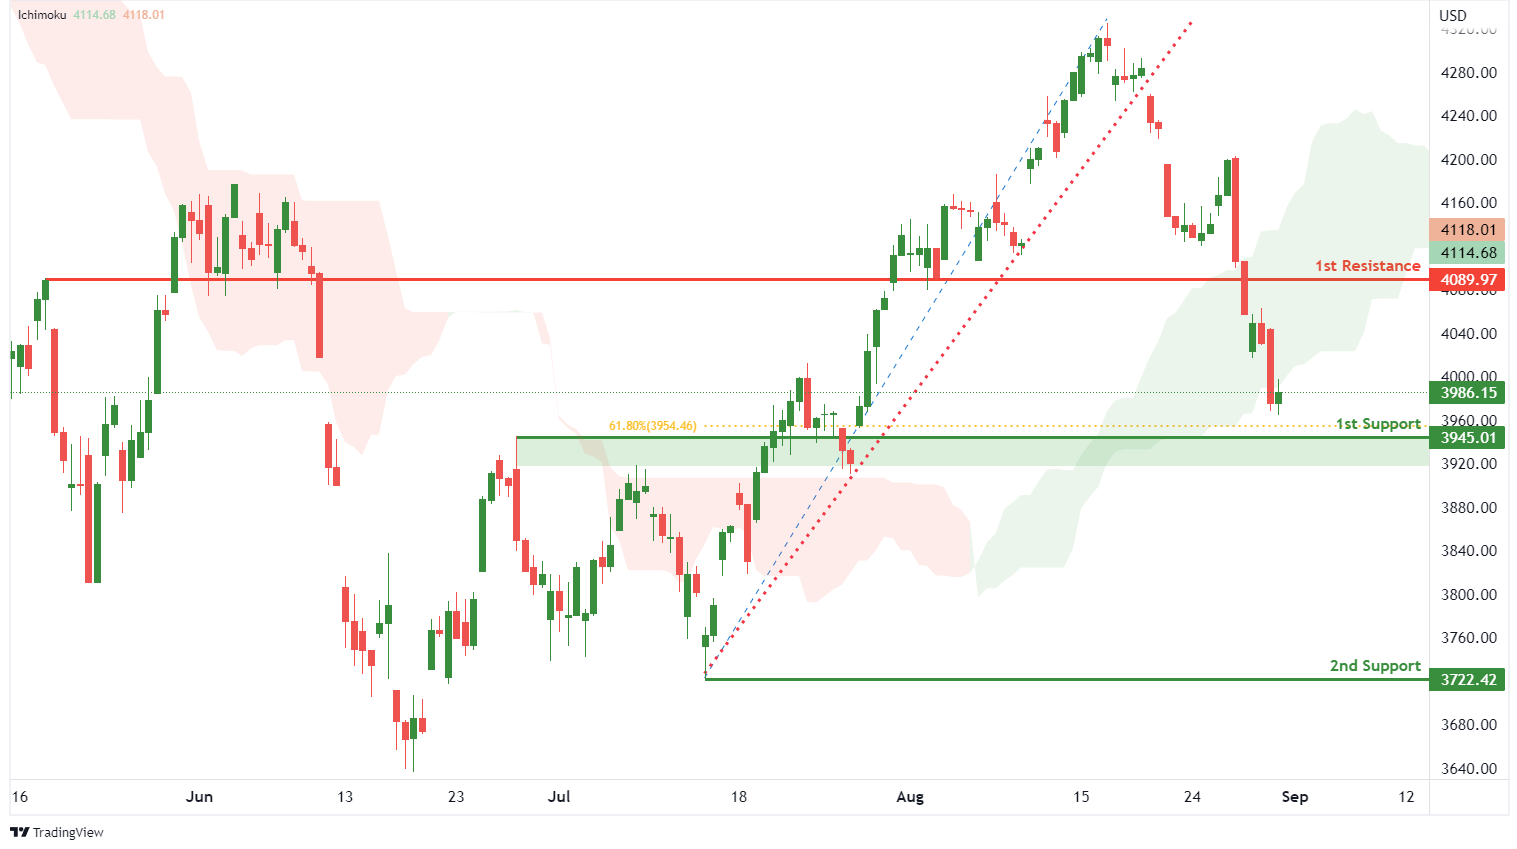
S&P 500:
On the H4, with prices breaking out of the ascending trendline and moving below the ichimoku indicator, we have a bearish bias that price will drop to 1st support at 3945.01 where the pullback support and 61.8% fibonacci retracement are. Once there is downside confirmation that price has broken 1st support structure, we would expect bearish momentum to carry price to 2nd support at 3722.42 where the swing low support is. Alternatively, price could rise to 1st resistance at 4089.97 where the pullback resistance is.
Areas of consideration:
- H4 time frame, 1st resistance of 4089.97
- H4 time frame, 1st support at 3945.01


