
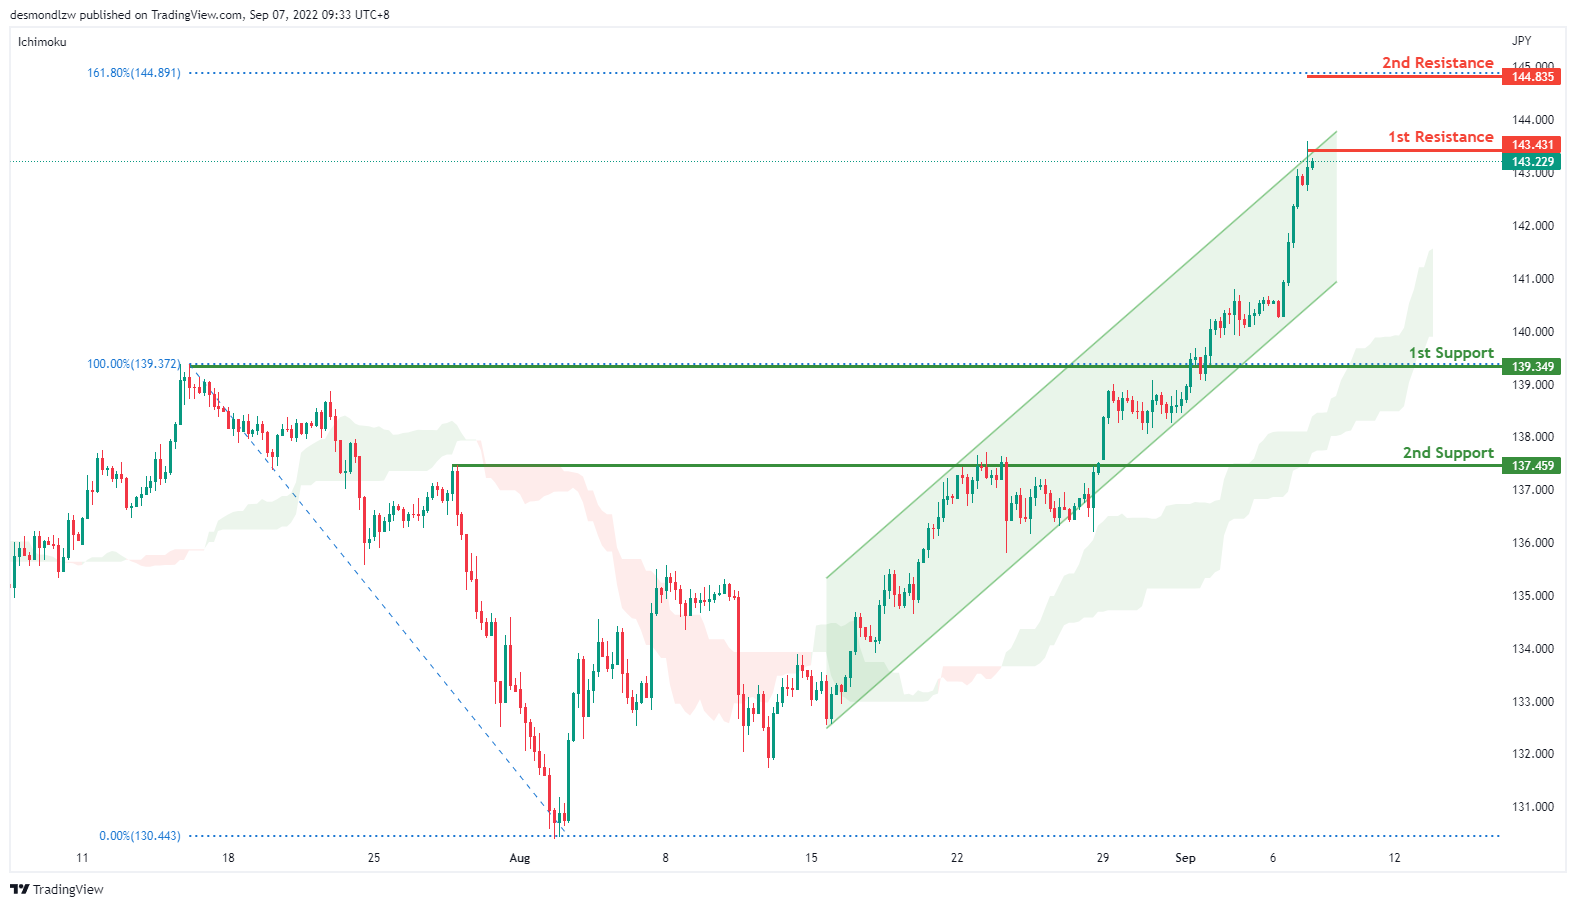
USD/JPY:
On the H4 chart, price has confirmed a bullish momentum breaking the previous high. We are bullish bias- Price is testing at the first resistance 143.431, if bullish momentum continues it should bring price to the second resistance at 144.815 where the 161.8% fibonacci extension sits. Alternatively, if price reverses, it might pull back to test the first support at 139.349 where the previous swing high sits then the second support at 138.459
Areas of consideration:
- H4 time frame, 1st resistance at 143.431
- H4 time frame, 1st support at 139.349
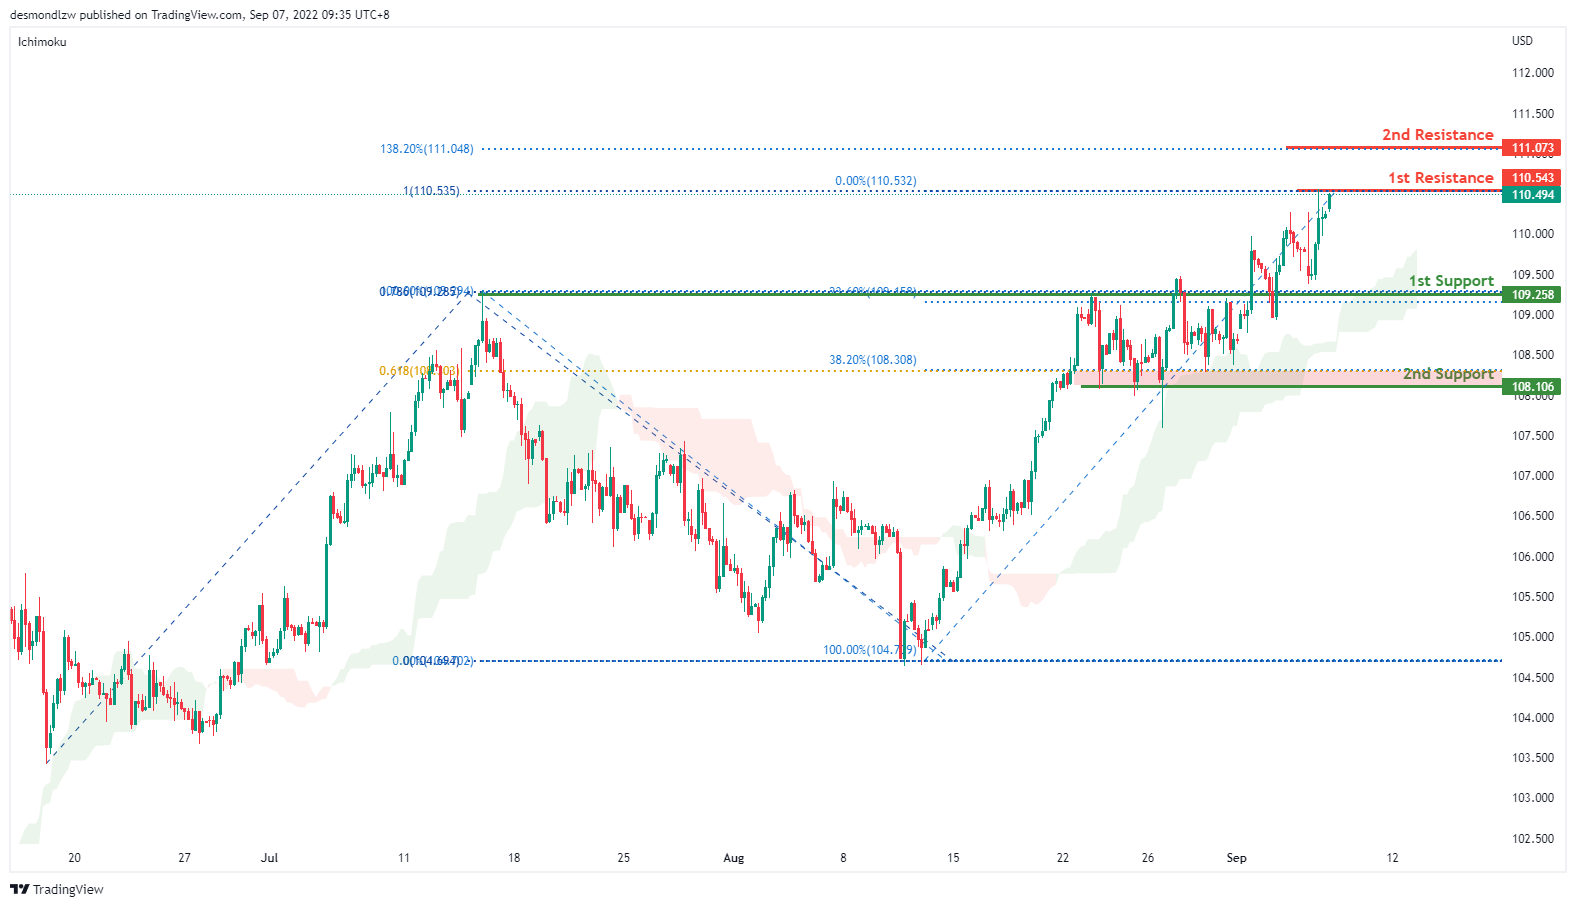
DXY:
On the H4, price seems to be ranging but it is still moving in an ascending trend and is in a bullish momentum. Price is testing at the first resistance 110.543 levels but if bullish momentum continues, it should bring price up to 111.073 where the 138.2% fibonacci extension sits. Alternatively, price might pull back to test the first support at 109.258 where the 23.6% retracement and previous swing high sits and subsequently the second support at 108.106 where the 38.2% retracement sits
Areas of consideration:
- H4 time frame, 1st resistance at 110.543
- H4 time frame, 1st support at 109.258
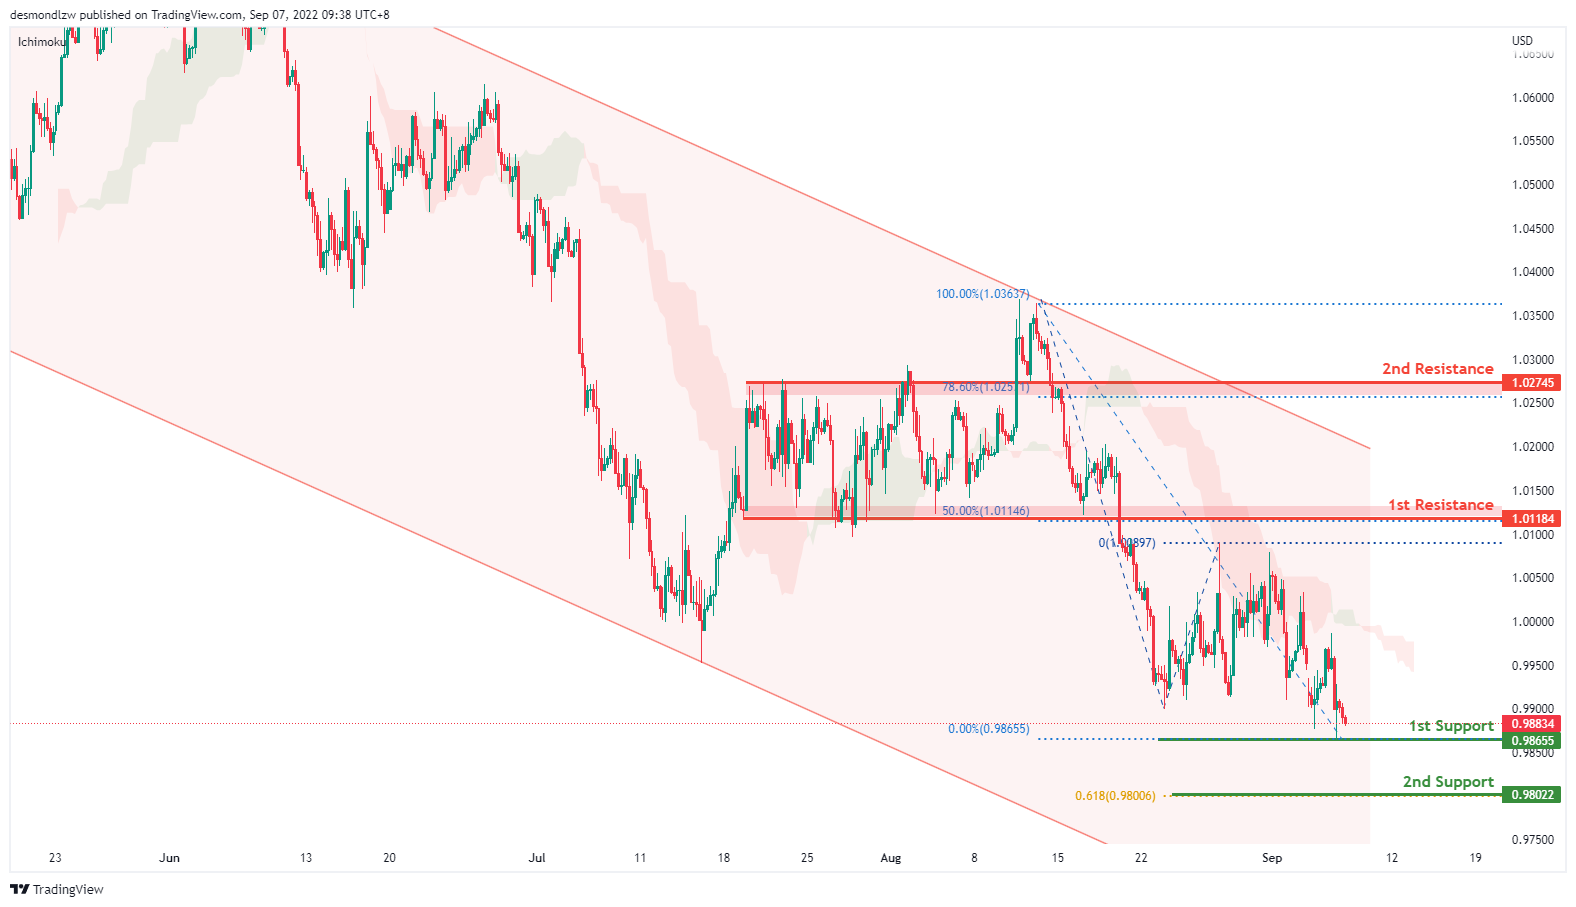
EUR/USD:
On the H4, price has broken the range and is moving in a descending trend – we are bearish bias. Price looks like it’s moving toward the first resistance at 0.9865 where the previous swing low sits and subsequently the second resistance at 0.9802 where the 61.8% projection sits. Alternatively if price rebounds, it might test the first resistance at 1.0118 where the 50% retracement sits and then the second resistance at 1.02745 where the 78.6% retracement and swing high sits.
Areas of consideration :
- H4 1st resistance at 1.0118
- H4 1st support at 0.9865
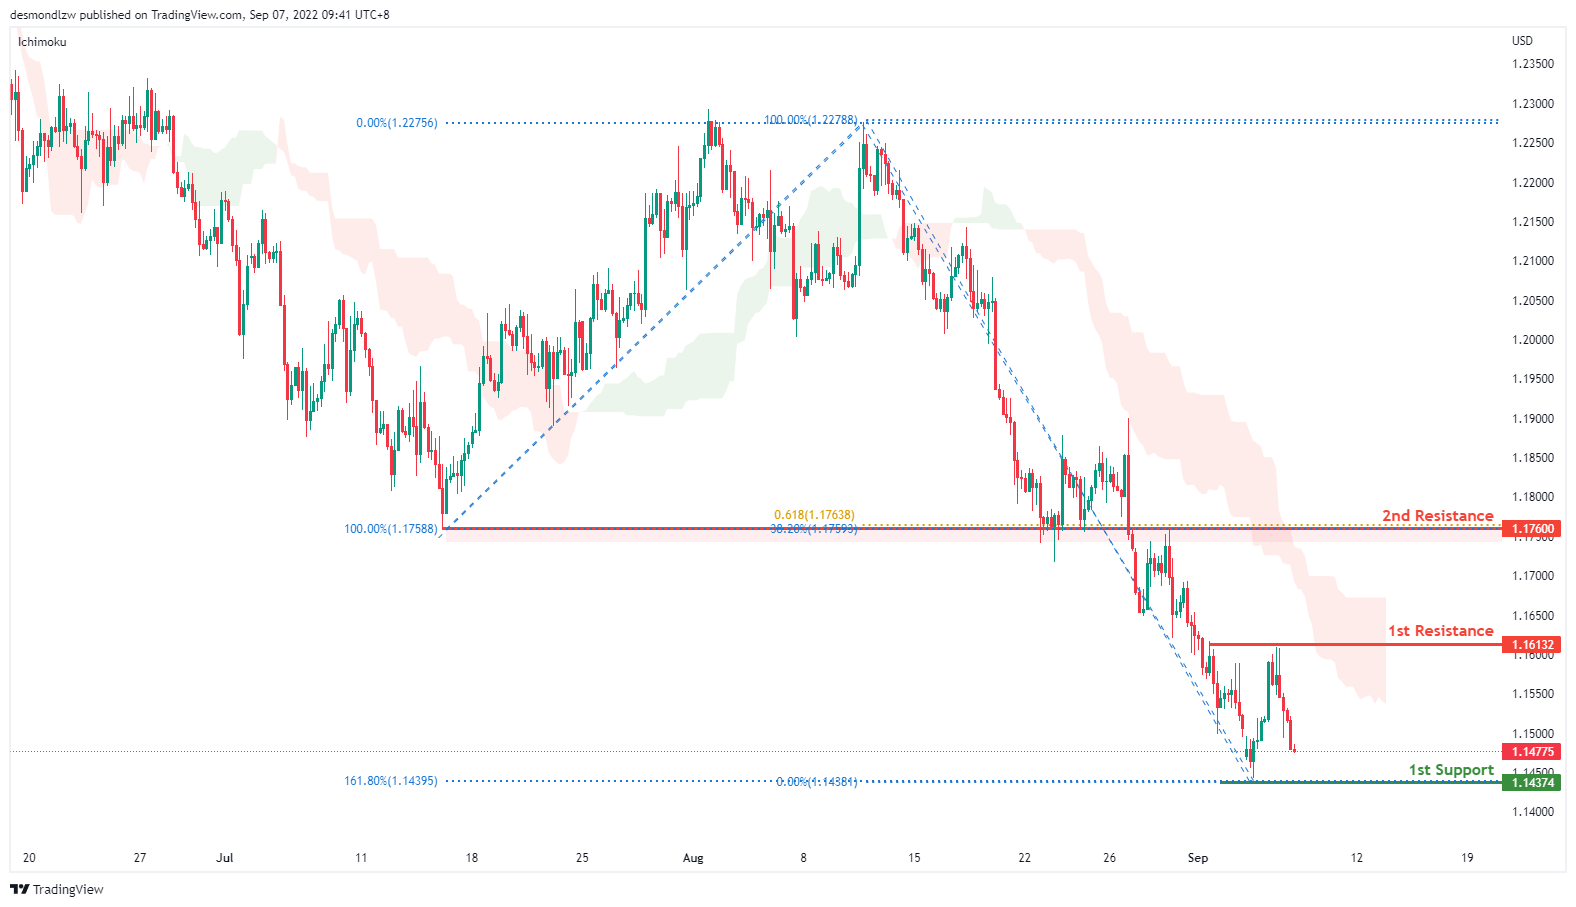
GBP/USD:
On the H4, prices seem to still be in a bearish momentum and respecting the ichimoku cloud. Prices have rebounded slightly but if bearish momentum continues it should move toward the first support at 1.1437 levels where the 161.8% extension sits. Alternatively, if it fails to break this level, it might look to test the first resistance at 1.1613 where the previous swing high sits subsequently the second resistance at 1.1760 level where the 61.8% projection and 38.2% retracement sits
Areas of consideration:
- H4 1st resistance at 1.163
- H4 1st support at 1.1437
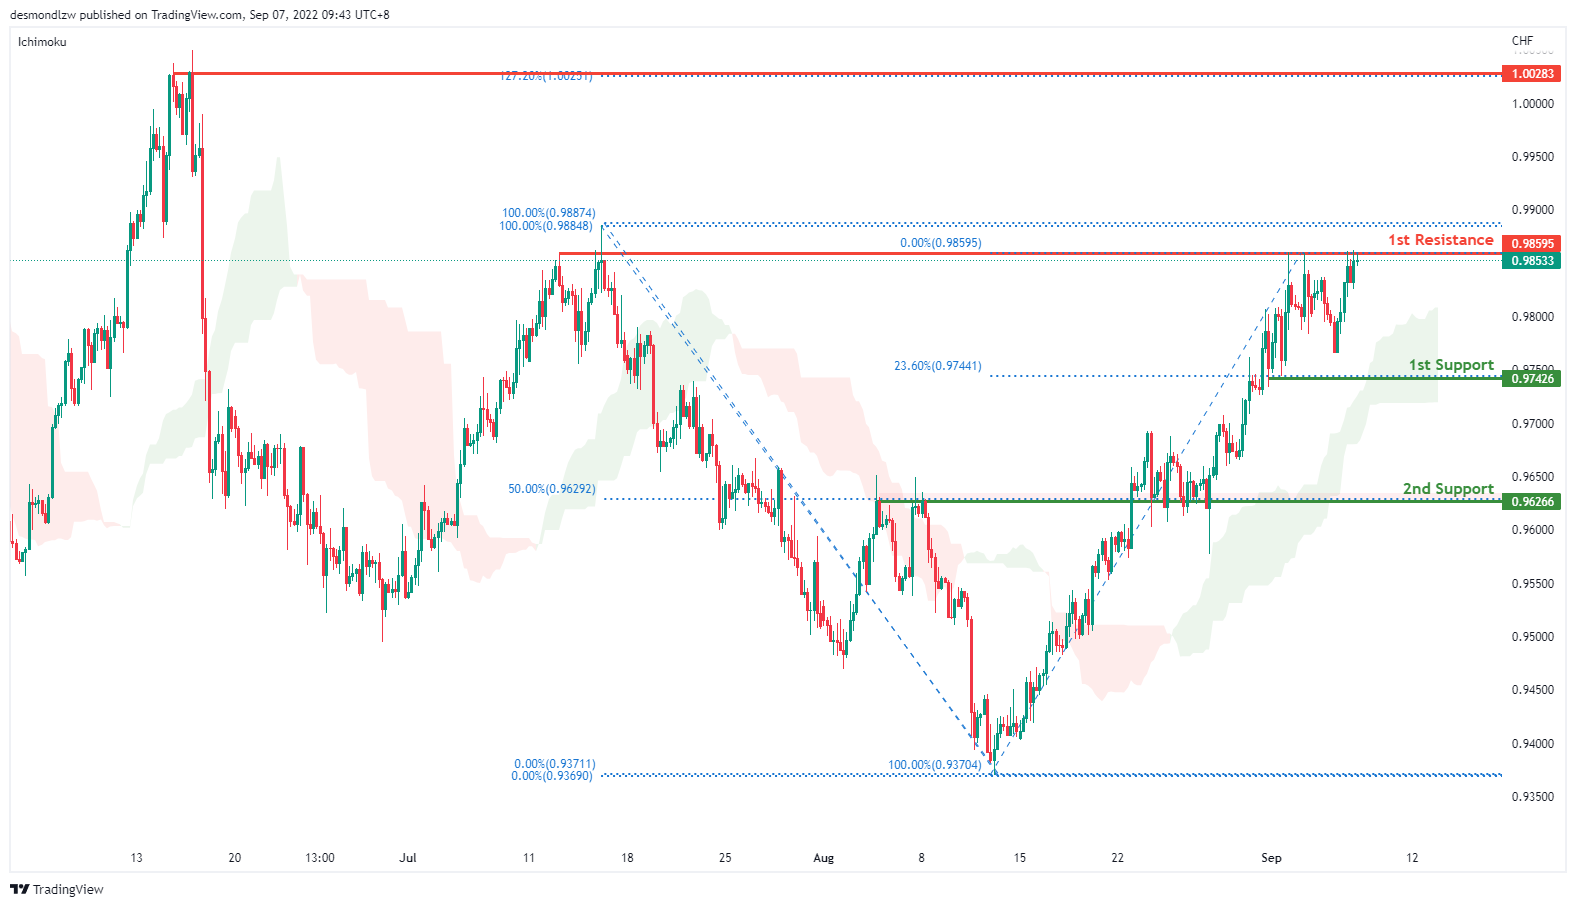
USD/CHF:
On the H4, with prices moving above the ichimoku cloud and breaking the descending trend, we are bullish. Price is testing the first resistance at 0.9859 where the previous swing high sits. If price do not break the first resistance, it could pull back to test the first support around the 0.9742 levels where the 23.6% retracement and swing low sits, subsequently the second support at 0.9626 where the 50% fibonacci retracement,78.6% projection and previous swing low sits
Areas of consideration
- H4 1st support at 0.9742
- H4 1st resistance at 0.9853
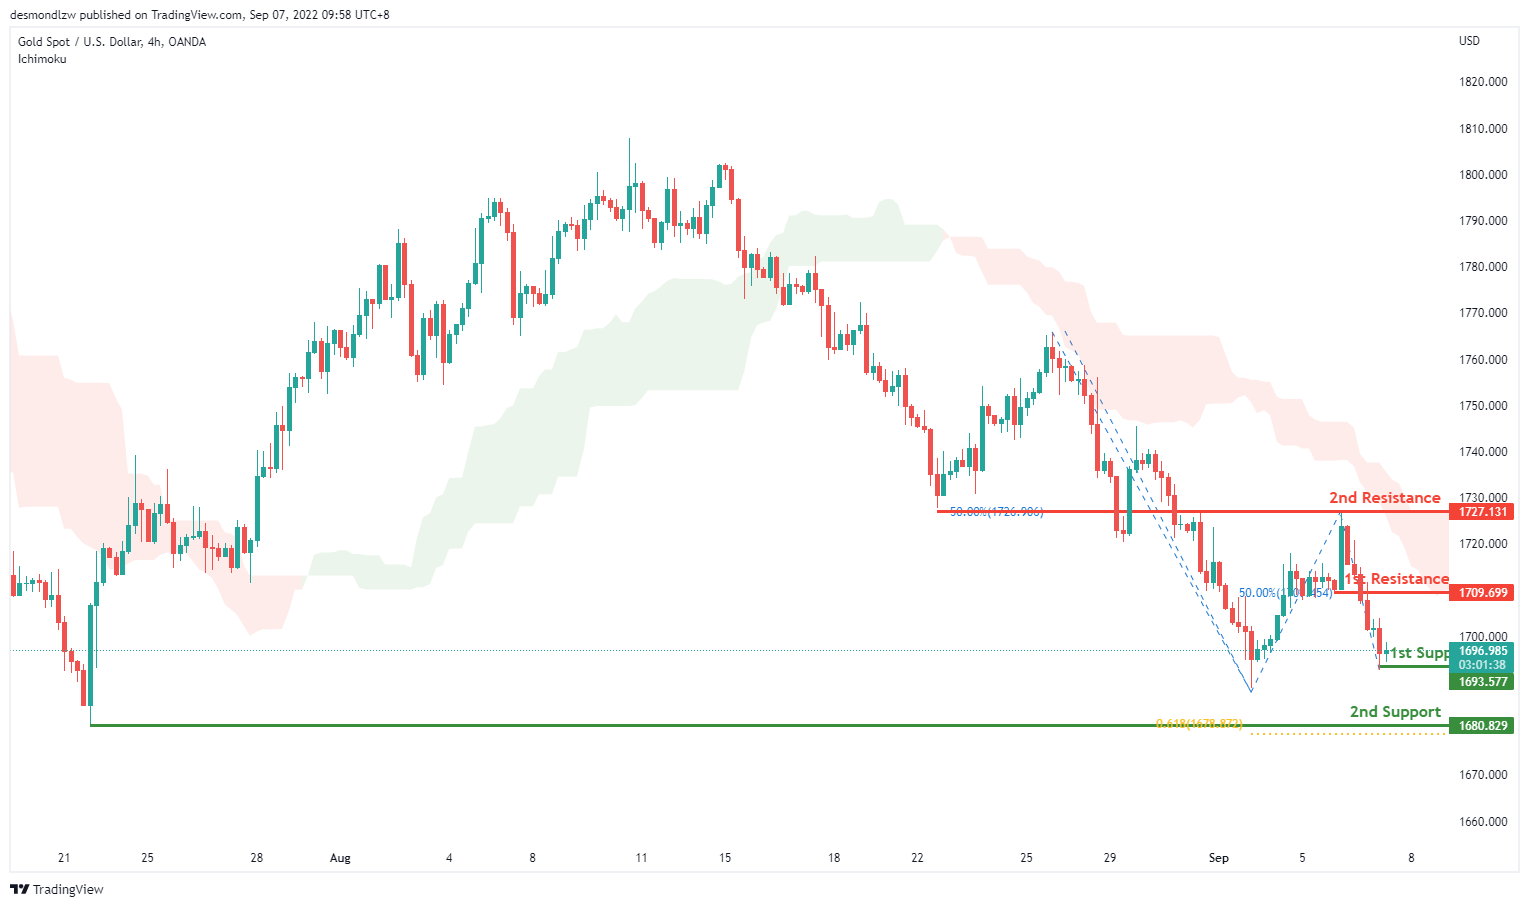
XAU/USD (GOLD):
On the H4, with prices below ichimoku cloud, we have a bearish bias that the price may drop to the 1st support at 1693.577, where the swing low is. If the price can break this support line, the next support level could be at 1680.829, where the significant swing low and 61.8% fibonacci projection are. Alternatively, the price may pull back from the 1st support and rise to the 1st resistance at 1709.699, where the 50% fibonacci retracement is. If the price can break the 1st resistance, next resistance could be at 1727.131, where the swing high and 50% fibonacci retracement are.
Areas of consideration:
- H4 time frame, 1st support at 1693.577
- H4 time frame, 2nd support at 1680.829
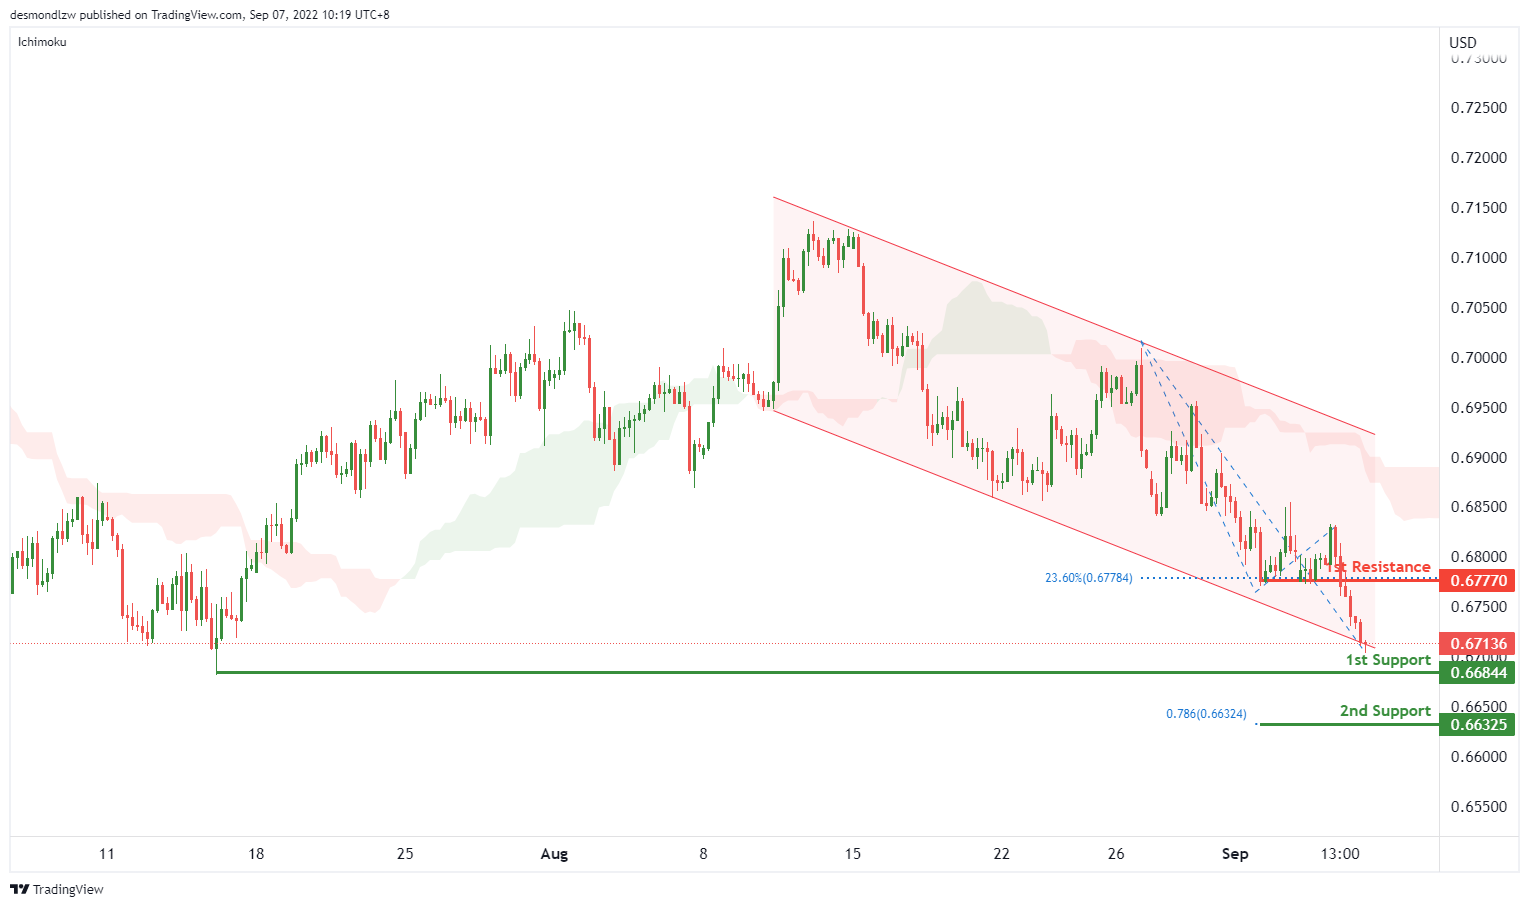
AUD/USD:
On the H4, with the price moving below the ichimoku cloud and moving within the descending channel, we have a bearish bias that the price may drop from the 1st support at 0.66844, which is in line with the swing low to the 2nd support at 0.66325, where the 78.6% fibonacci projection is. Alternatively, the price may rise to the 1st resistance 0.67770, where the 23.6% fibonacci retracement is.
Areas of consideration
- H4 1st support at 0.66844
- H4 2nd support at 0.66325
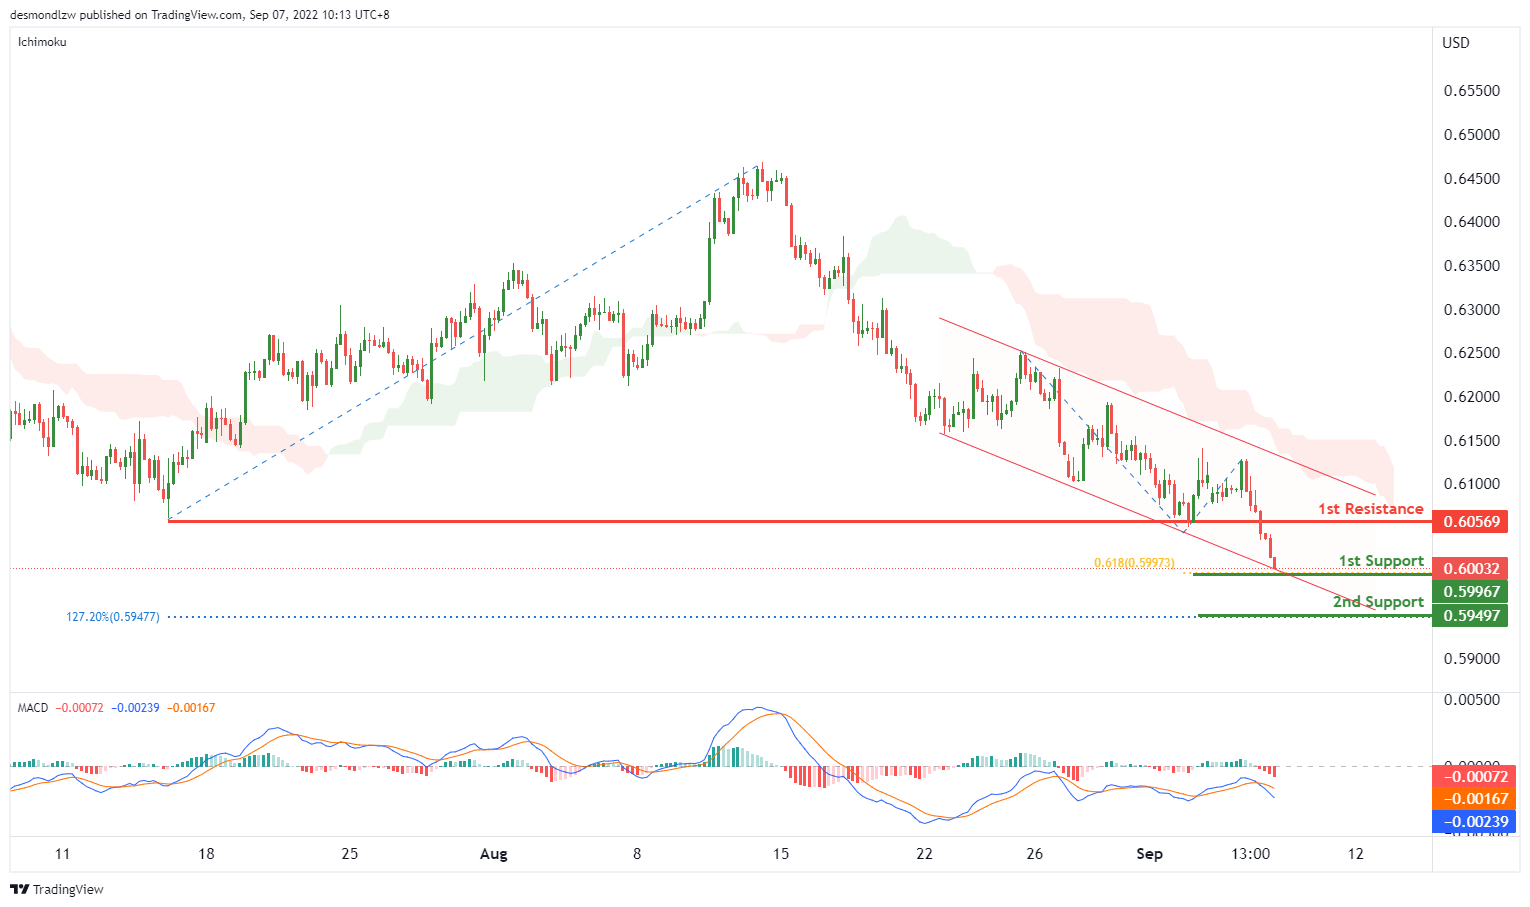
NZD/USD:
On the H4, with price moving within the descending channel, below ichimoku indicators and MACD showing a death cross, we have a bearish bias that the price may drop from the 1st support at 0.59967, which is in line with the 61.8% fibonacci projection. If the price can break the 1st support, the next support could be at 0.59497, where the 127.2% fibonacci extension is. Alternatively, the price may pull back from the 1st support and rise to the 1st resistance at 0.60569, where the previous swing lows are.
Areas of consideration:
- H4 time frame, 1st support at 0.59967
- H4 time frame, 2nd support at 0.59497
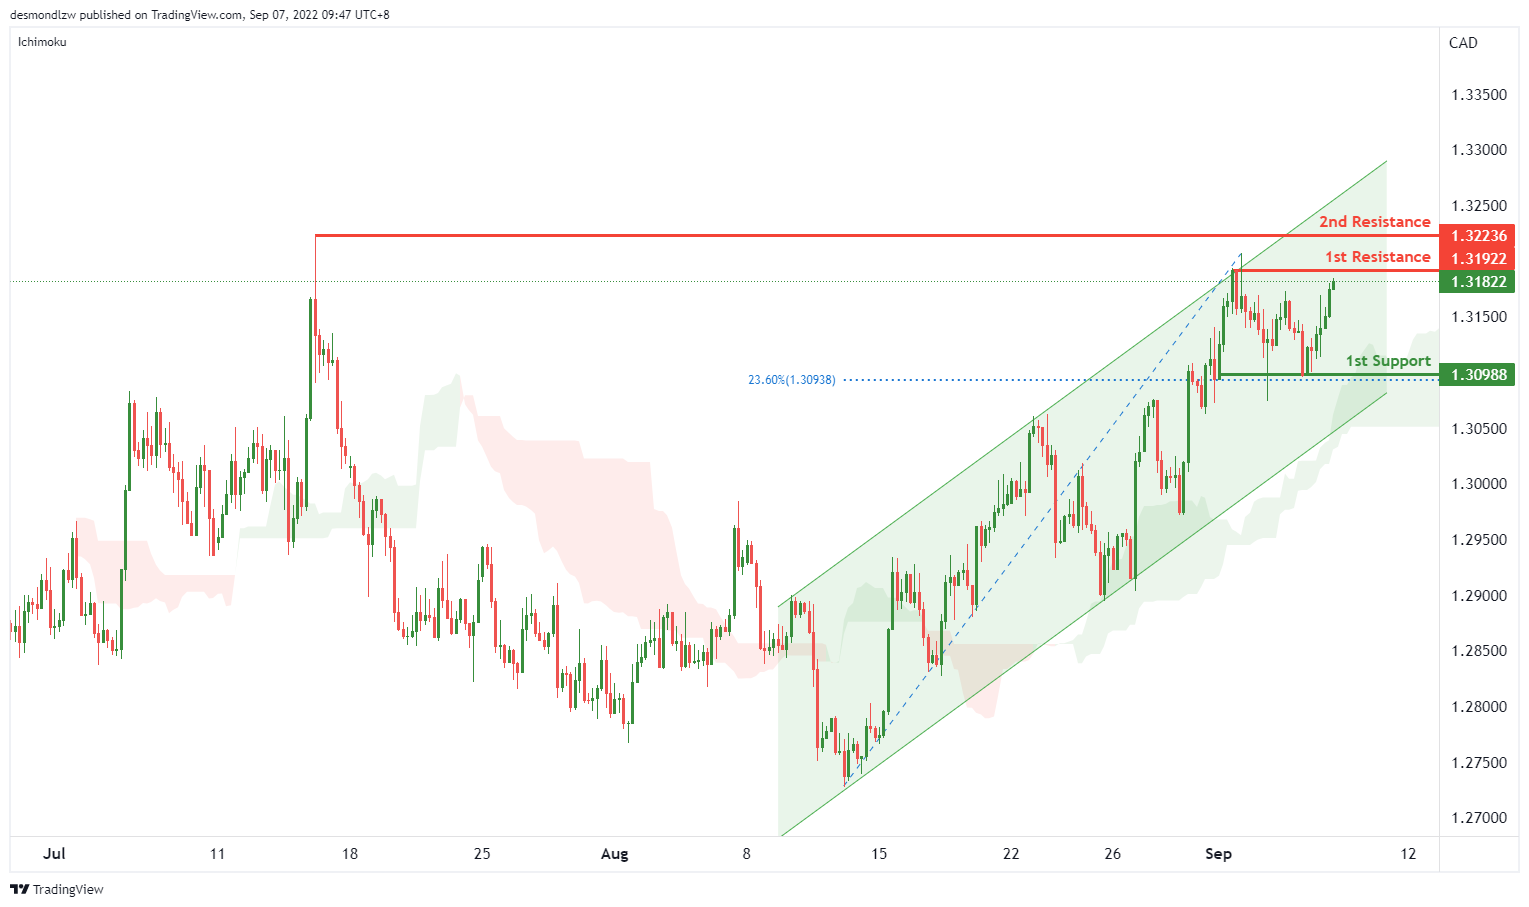
USD/CAD:
On the H4, with the price moving within the ascending channel, above ichimoku cloud, we have a bullish bias that the price may rise from the 1st resistance at 1.31922, where the swing high is to the 2nd resistance at 1.32236, where the significant swing high is. Alternatively, the price may drop to the 1st support at 1.30988, where the 23.6% fibonacci retracement and previous swing lows are
Areas of consideration:
- H4 time frame, 1st resistance at 1.31922
- H4 time frame, 2nd resistance at 1.32236
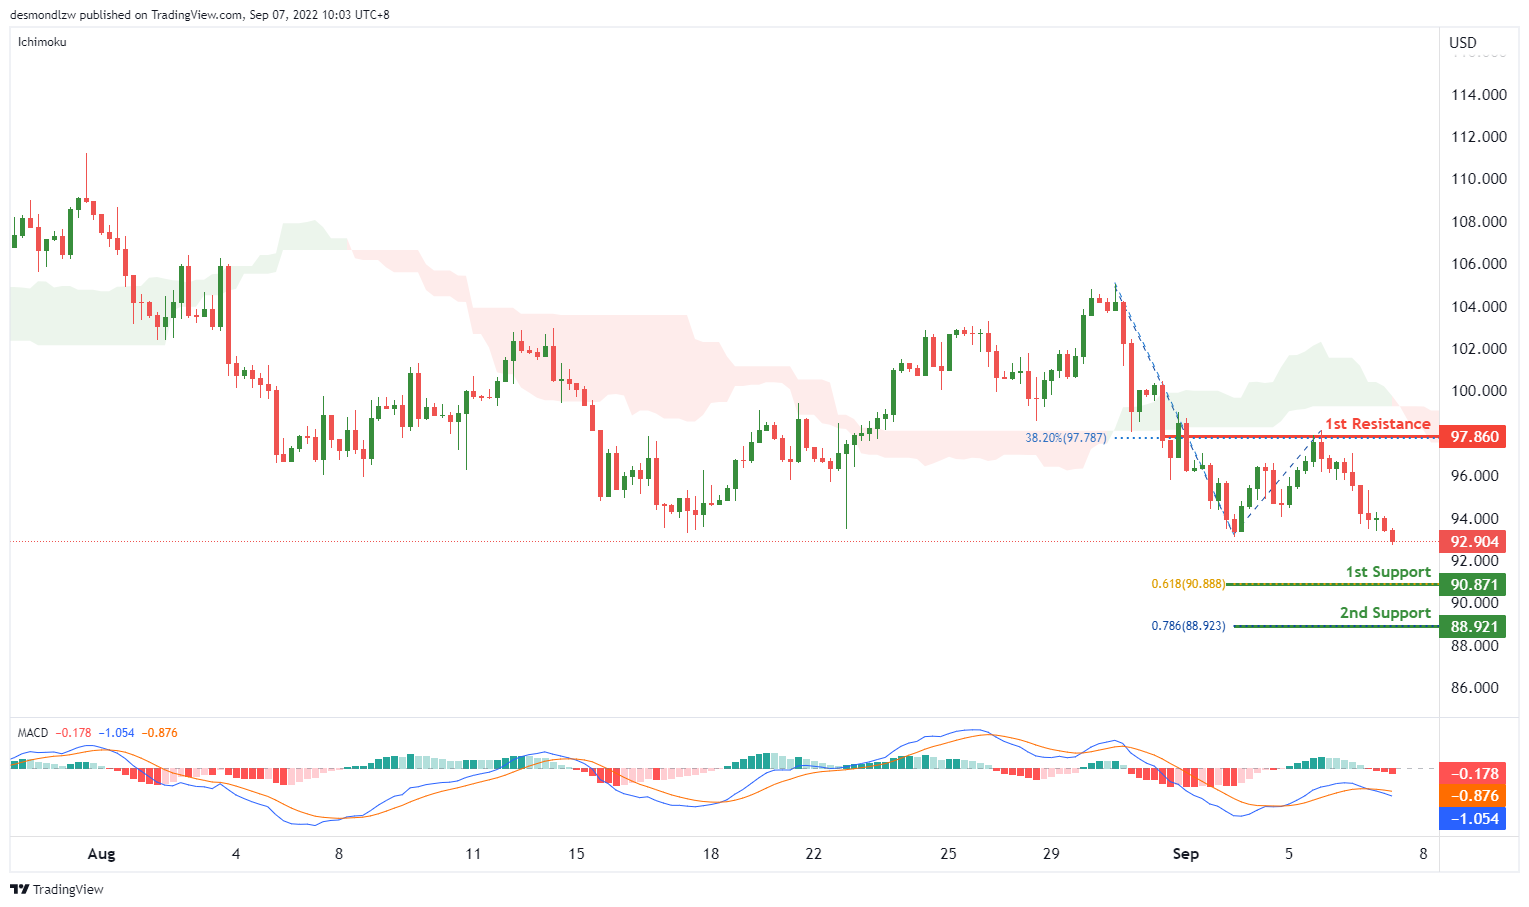
OIL:
On the H4, with price below ichimoku cloud and MACD showing a death cross, we have a bearish bias that the price may drop to the 1st support at 90.971, where the 61.8% fibonacci retracement is. If the price could break the 1st support, the 2nd support could be at 88.921, where the 78.6% fibonacci retracement is. Alternatively, the price may pull back to the 1st resistance at 97.860, where the 38.2% fibonacci retracement and swing high are.
Areas of consideration:
- H4 time frame, 1st support at 90.971
- H4 time frame, 2nd support at 88.921
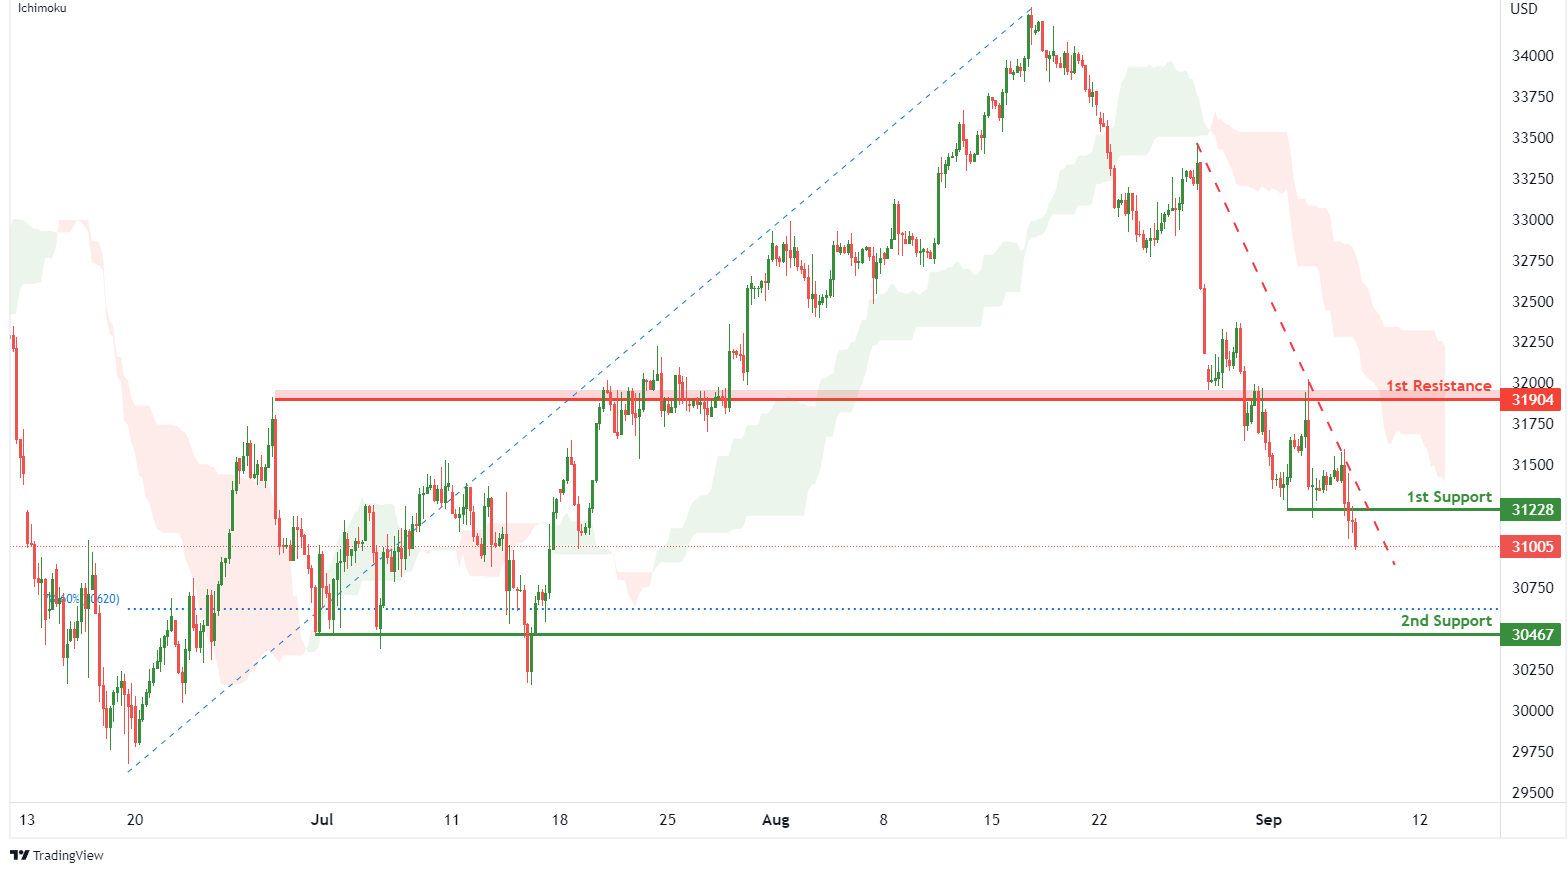
Dow Jones Industrial Average:
On the H4, with price moving along the descending trendline and below the ichimoku indicator, we have a bearish bias that price will drop from 1st support at 31228 where the pullback support is to the 2nd support at 30467 where the pullback support and 78.6% fibonacci retracement are. Alternatively, price could break 1st support structure and rise to 1st resistance at 31904 where the overlap resistance is.
Areas of consideration:
- H4 time frame, 1st resistance of 31904
- H4 time frame, 1st support at 31228
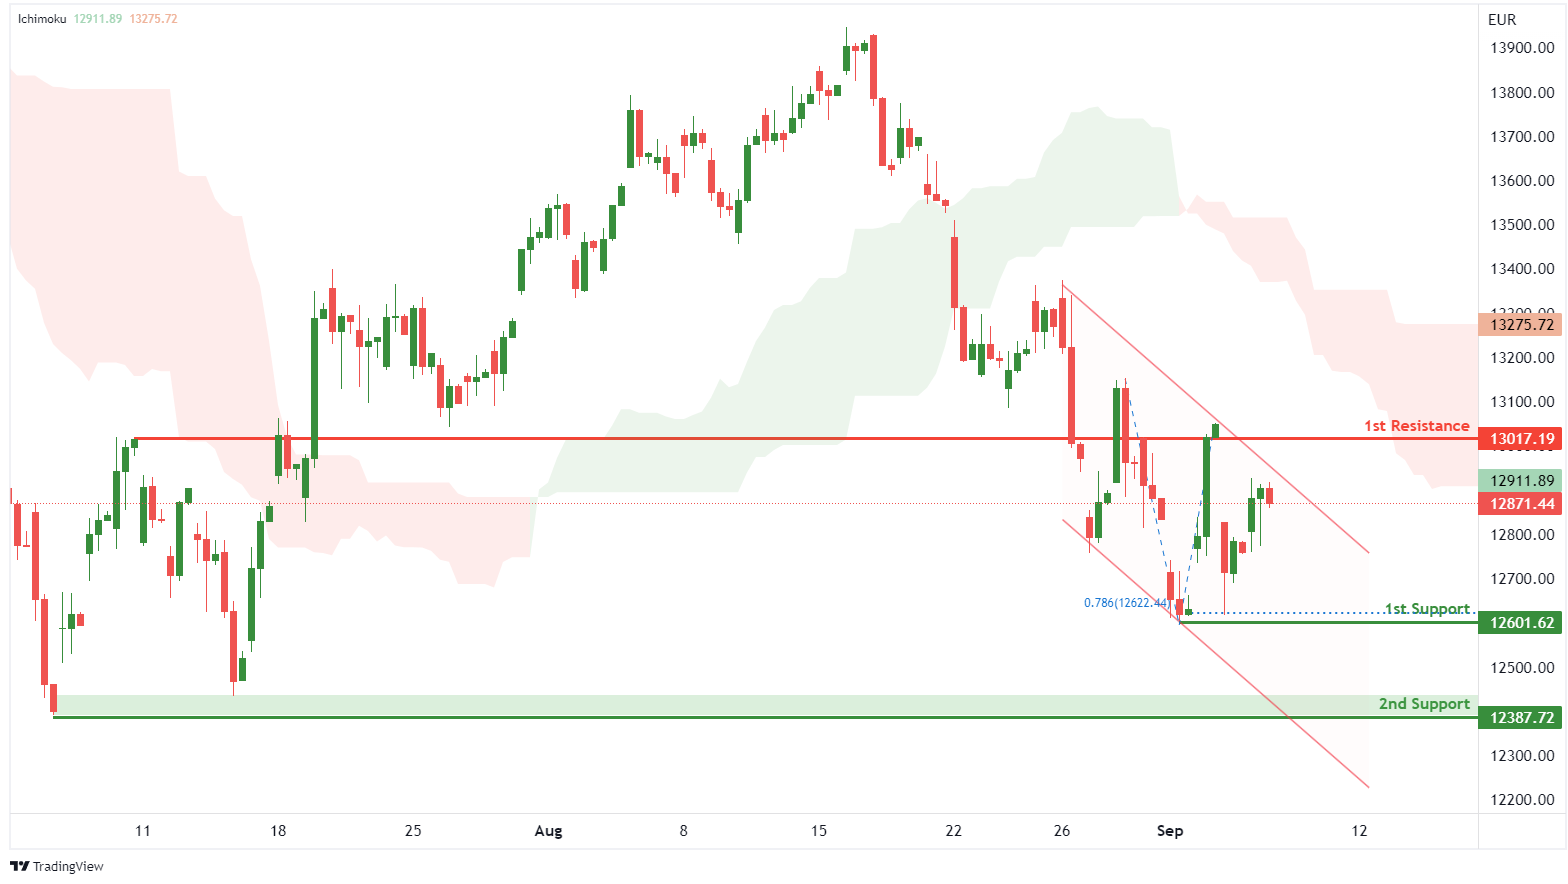
DAX:
On the H4, with price moving within the descending channel and below the ichimoku indicator, we have a bearish bias that price will drop to 1st support at 12601.62 where the pullback support and 78.6% fibonacci projection are. Once there is downside confirmation that price has broken 1st support structure, we would expect bearish momentum to carry price to 2nd support at 12387.72 where the swing low support is. Alternatively, price could rise to 1st resistance at 13017.19 where the pullback resistance is.
Areas of consideration:
- H4 time frame, 1st resistance of 13017.19
- H4 time frame, 1st support at 12601.62
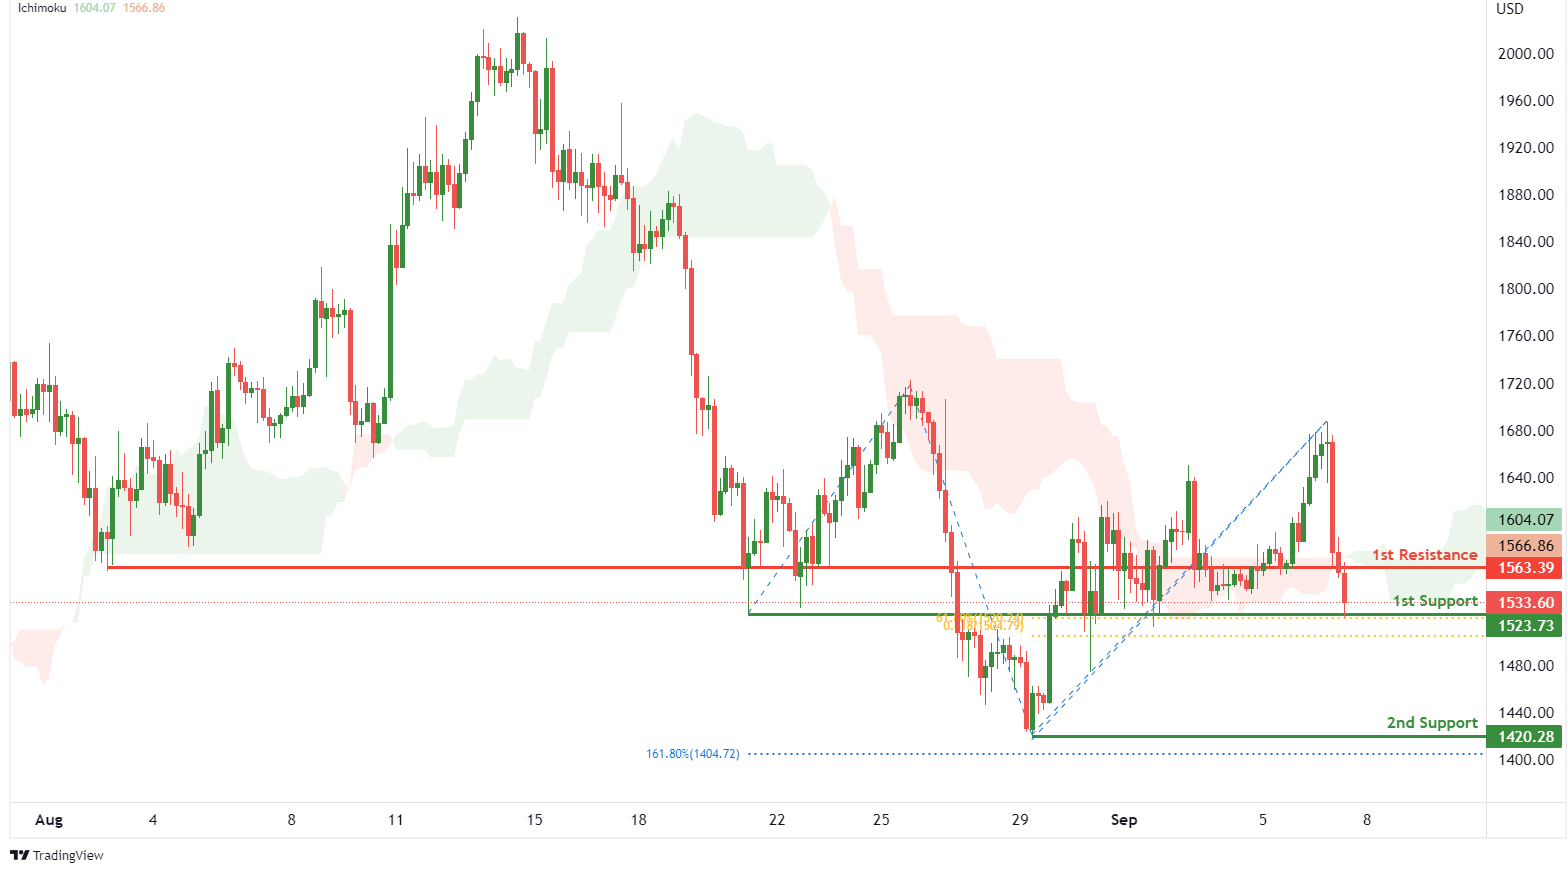
ETHUSD:
On the H4, with price moving below the ichimoku indicator, we have a bearish bias that price will drop to 1st support at 1523.73 where the pullback support, 61.8% fibonacci retracement and 61.8% fibonacci projection are. Once there is downside confirmation that price has broken 1st support structure, we would expect bearish momentum to carry price to the 2nd support at 1420.38 where the swing low support and 161.8% fibonacci extension are. Alternatively, price could rise to 1st resistance at 1563.39 where the overlap resistance is.
Areas of consideration:
- H4 time frame, 1st resistance of 1563.39
- H4 time frame, 1st support at 1523.73
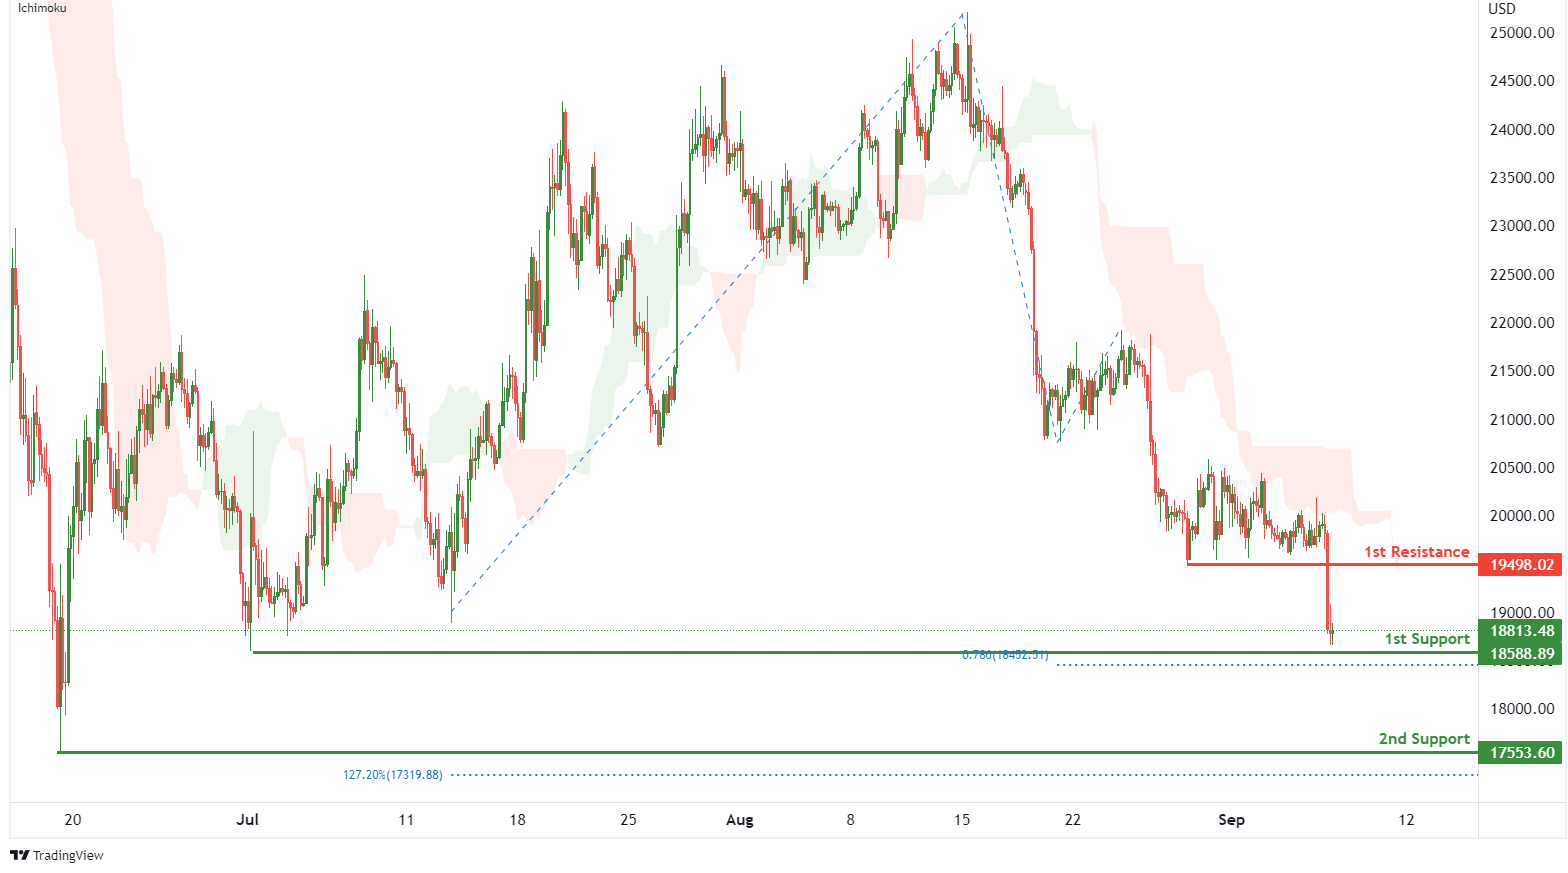
BTCUSD:
On the H4, with price moving below an ichimoku indicator, we have a bearish bias that price will drop to 1st support at 18588.89 where the swing low support and 78.6% fibonacci projection are. Once there is downside confirmation that price has broken 1st support structure, we would expect bearish momentum to carry price to 2nd support at 17553.60 where the swing low support and 127.2% fibonacci extension. Alternatively, price could rise to 1st resistance at 19498.02 where the pullback resistance is.
Areas of consideration:
- H4 time frame, 1st resistance of 19498.02
- H4 time frame, 1st support at 18588.89
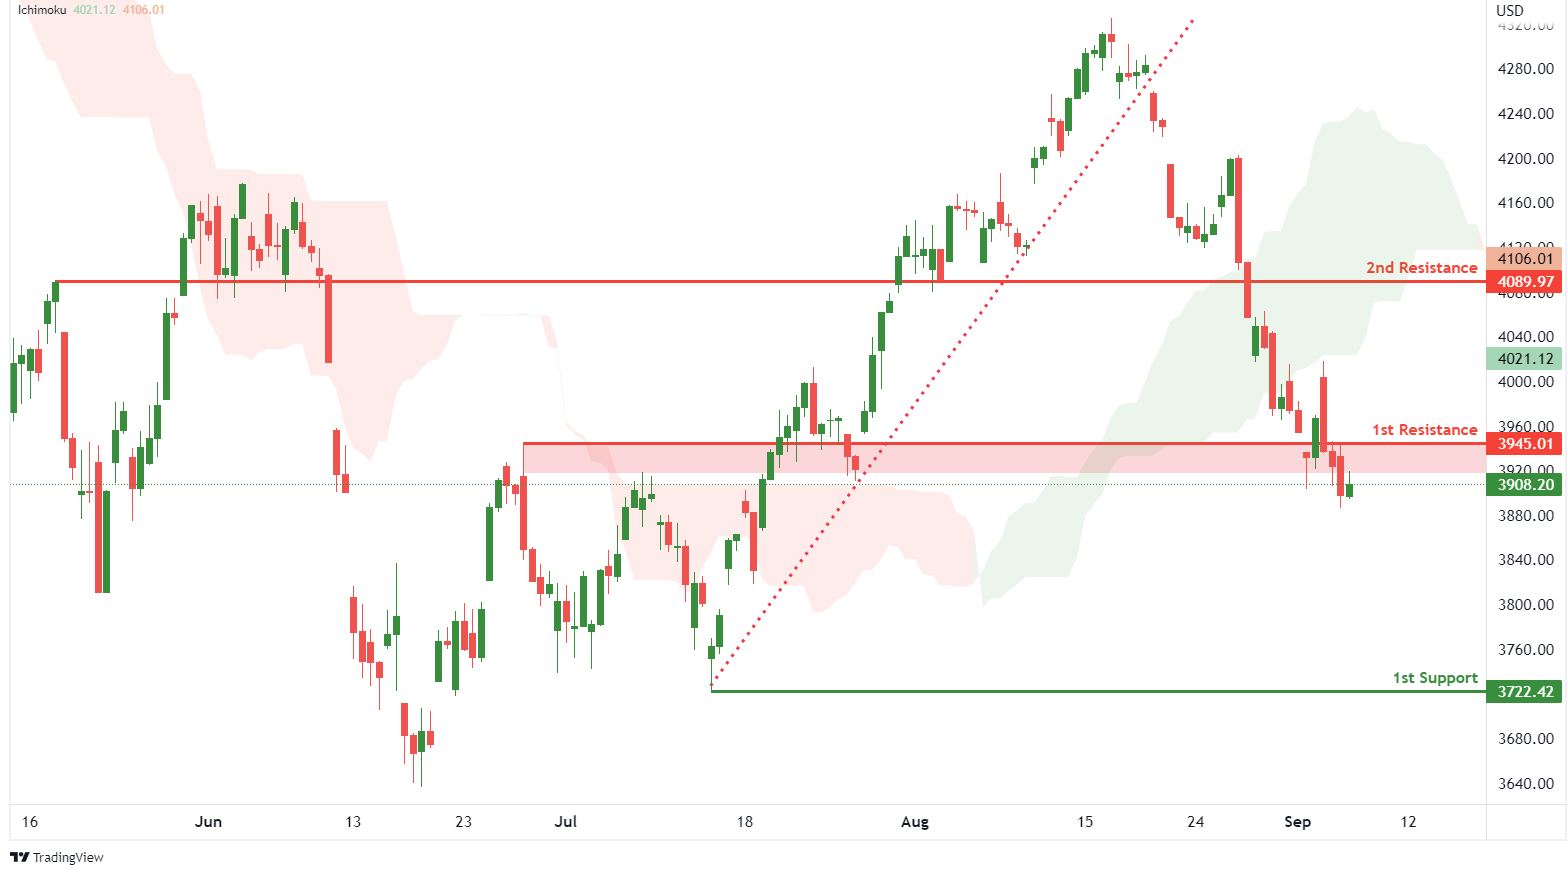
S&P 500:
On the H4, with prices breaking out of the ascending trendline and moving below the ichimoku indicator, we have a bearish bias that the price will drop from 1st resistance at 3945.01 where the pullback resistance is to the 1st support at 3722.42 where the swing low support is. Alternatively, price could break 1st resistance structure and rise to 2nd resistance at 4089.97 where the pullback resistance is.
Areas of consideration:
- H4 time frame, 1st resistance of 3945.01
- H4 time frame, 1st support at 3722.42


