
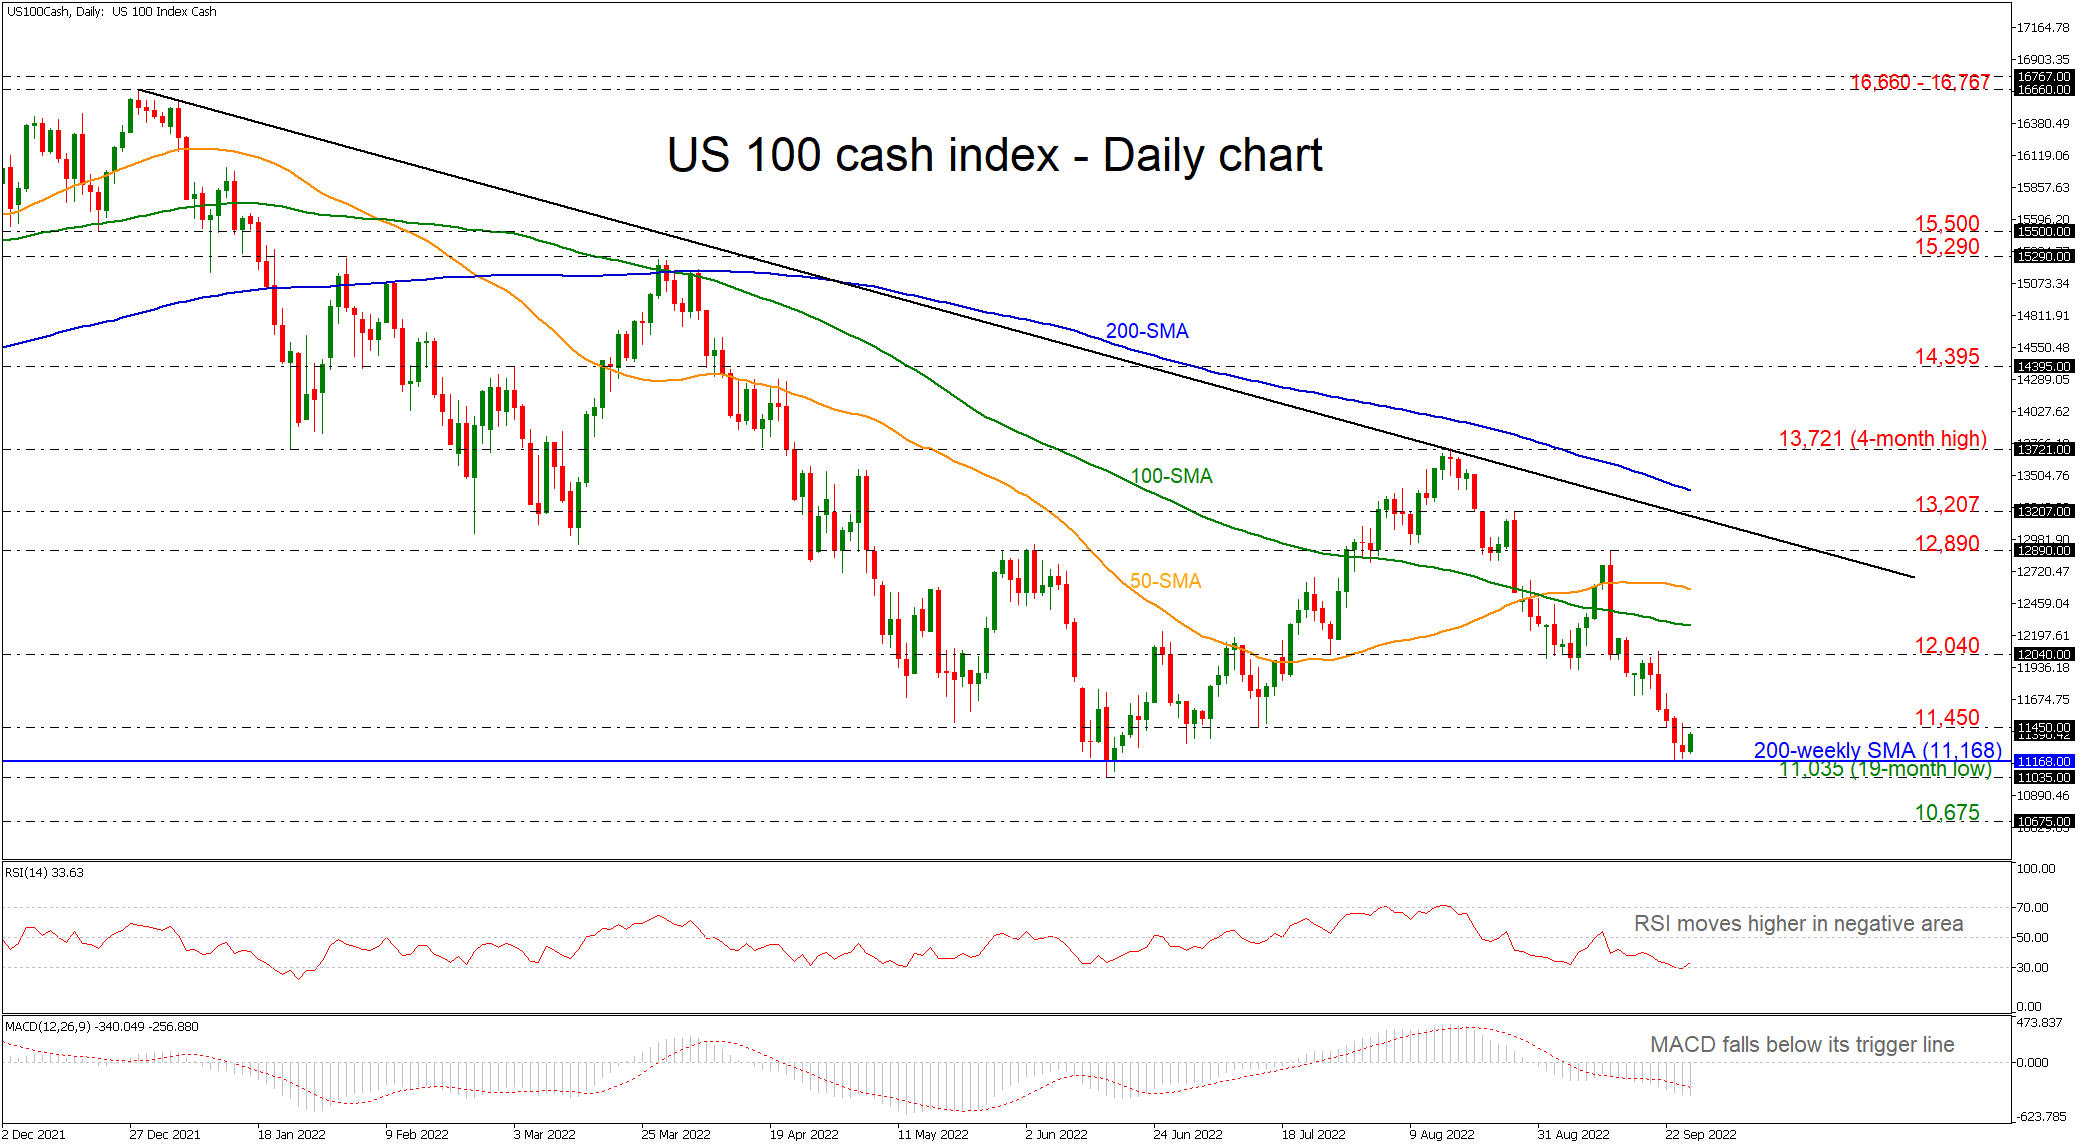
The US 100 cash index is finding strong support level at the 200-weekly simple moving average (SMA) at 11,168, but any declines below that line would suggest sharp losses in the long-term. The RSI is reversing higher near the oversold zone, while the MACD is extending its negative momentum below its trigger and zero lines.
Should buyers drive above the 11,450 level, they could encounter initial strengthened resistance from the 12,040 barrier and the 100-day SMA at 12,278 ahead of the 50-day SMA at 12,566. A step above may meet further constrictions from the 12,890 resistance before meeting the long-term descending trend line.
Otherwise, if sellers take control again, initial support could come from the 200-weekly SMA before tumbling towards the 19-month trough of 11,035. Diving further, immediate limitations may arise from the 10,675 mark, registered in September 2020.
All in all, the US 100 index is rebounding off the weekly SMA at the moment; however, the broader outlook is still bearish.


