
USD/JPY:
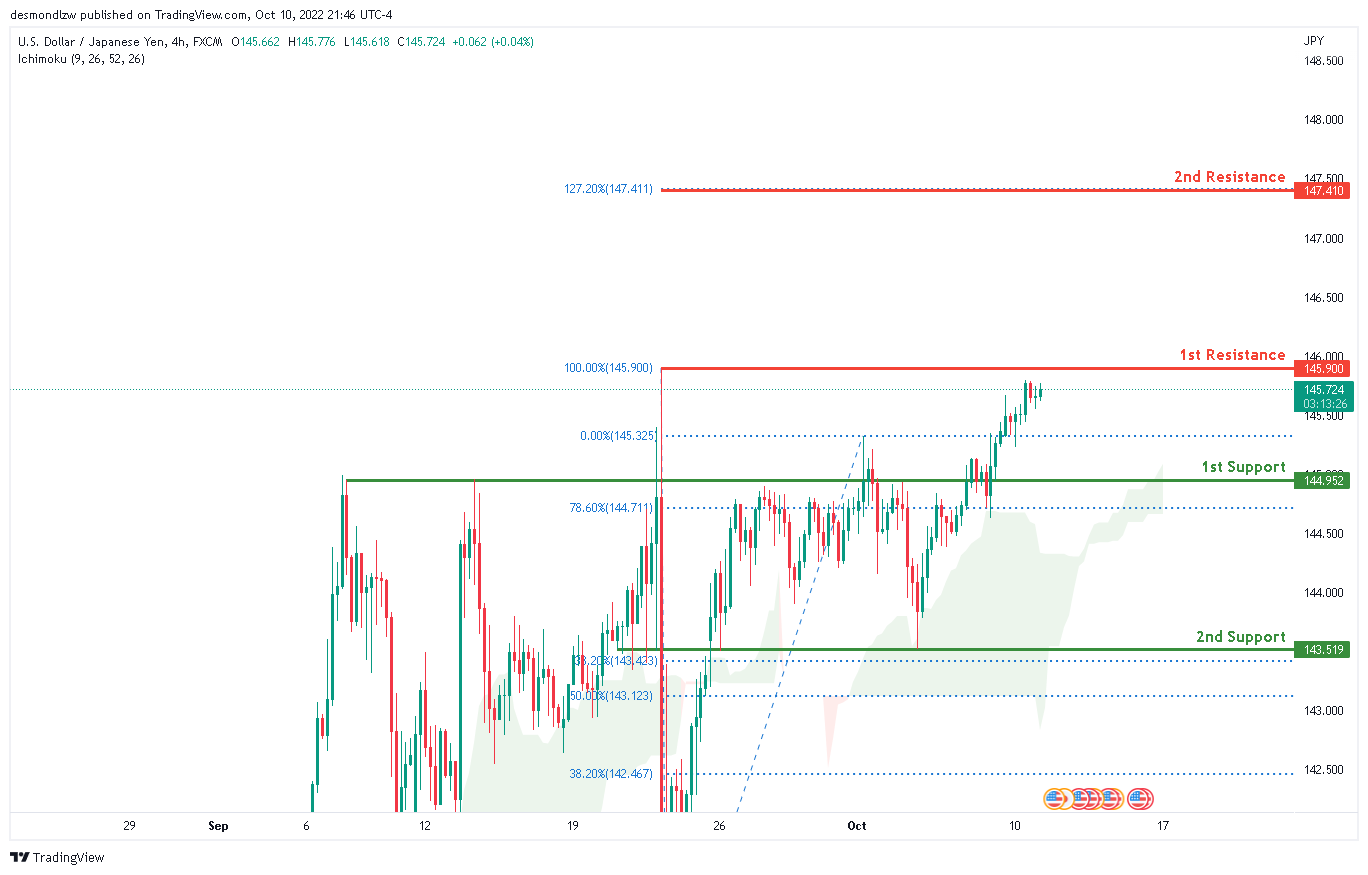
Looking at the H4 chart, the current overall bias for USDJPY is bullish . To add confluence to this bias, the price is currently above the Ichimoku cloud which indicates a bullish market. Overnight, the price has continued it’s bullish momentum upwards.. If the bullish momentum continues, expect price to possibly head towards the 1st resistance line at 145.900, where the 100% Fibonaaci line is located.
Areas of consideration:
- H4 time frame, 1st resistance at 145.900
- H4 time frame, 1st support at 144.952
DXY:
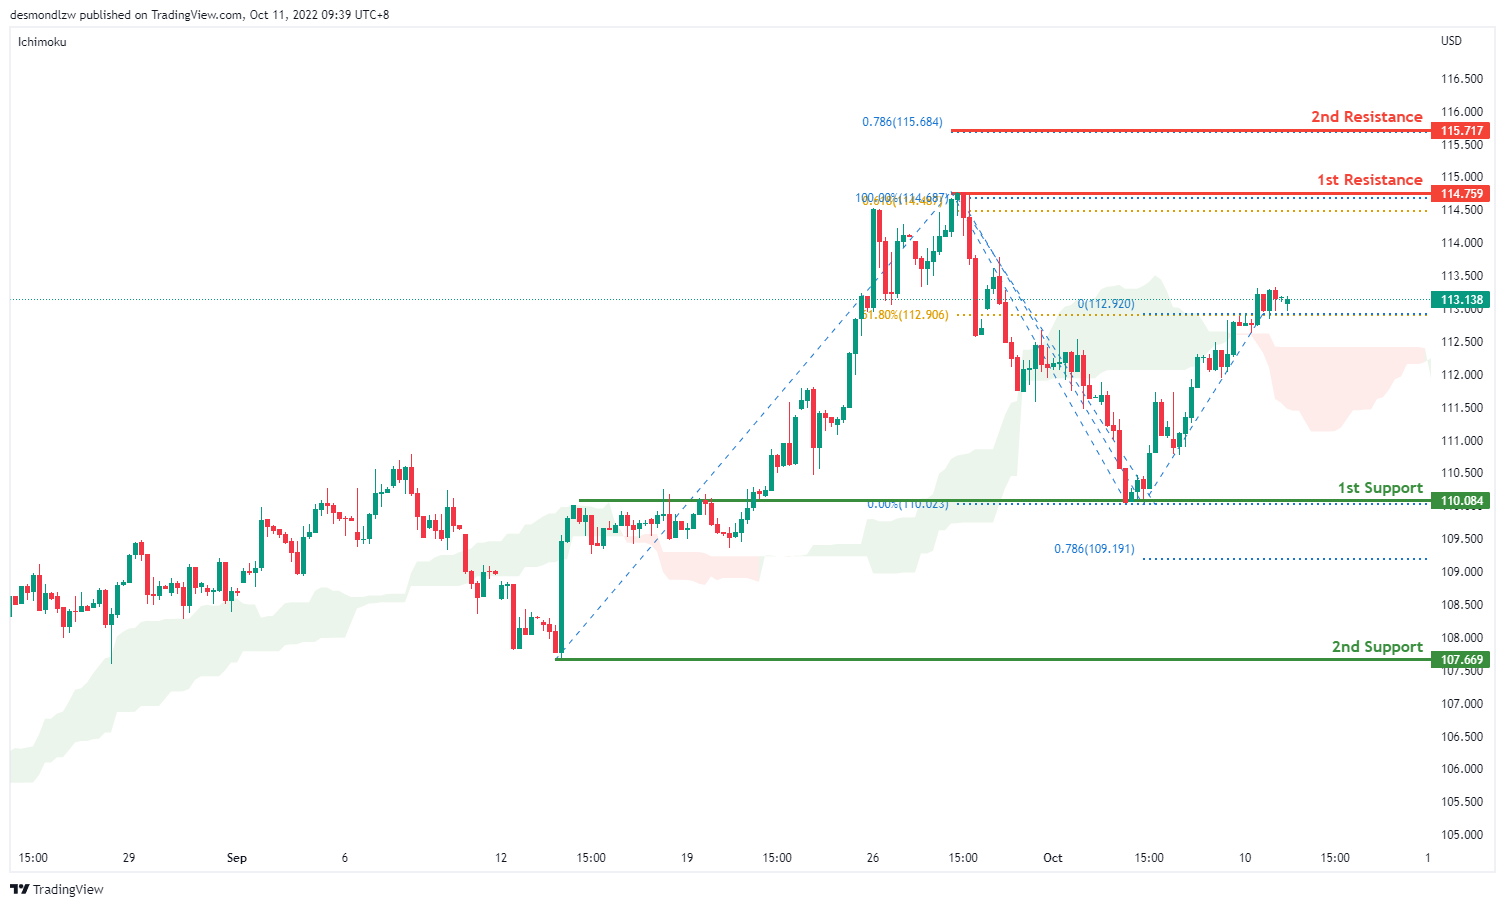
On the H4 chart, prices are moving in an ascending trend signalling slight bullish momentum. It is currently moving towards the first resistance at 114.719 where the previous swing high sits. If bullish momentum continues it will bring price to 115.717 where the 78.6% projection. Alternatively, prices could test the first support at 110.084 where the swing low sits. if it breaks this level, bearish momentum will bring price to second support at 107.669
Areas of consideration:
- H4 time frame, 1st resistance at 114.759
- H4 time frame, 1st support at 110.084
EUR/USD:
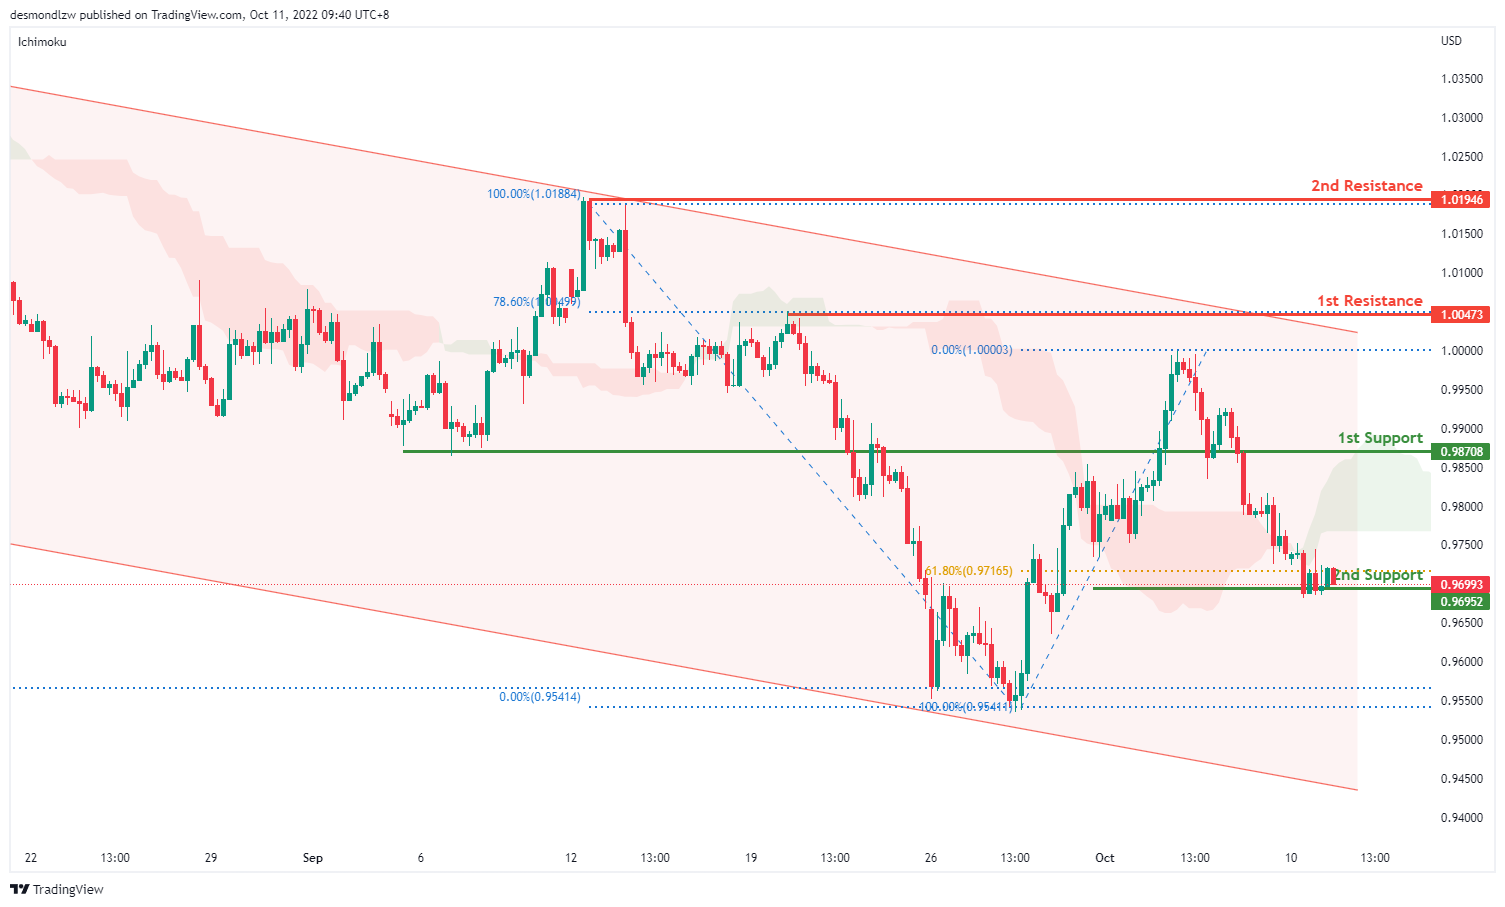
On the H4, price is moving within the descending trendline in a descending manner, with the price moving below ichimoku cloud,- we are bearish biased. Price is testing the first support at 0.9695 where the 61.8% retracement sits. If it breaks this level, bearish momentum will bring price to the second support at 0.9545 where the swing low and 161.8% extension sit. Alternatively, price may test the first resistance at 1.0047 where the 78.6% retracement sits. If price breaks this level, it may test the second resistance at 1.0194, where the previous swing high sits
Areas of consideration :
- H4 1st resistance at 1.0047
- H4 2nd resistance at 1.0194
GBP/USD:
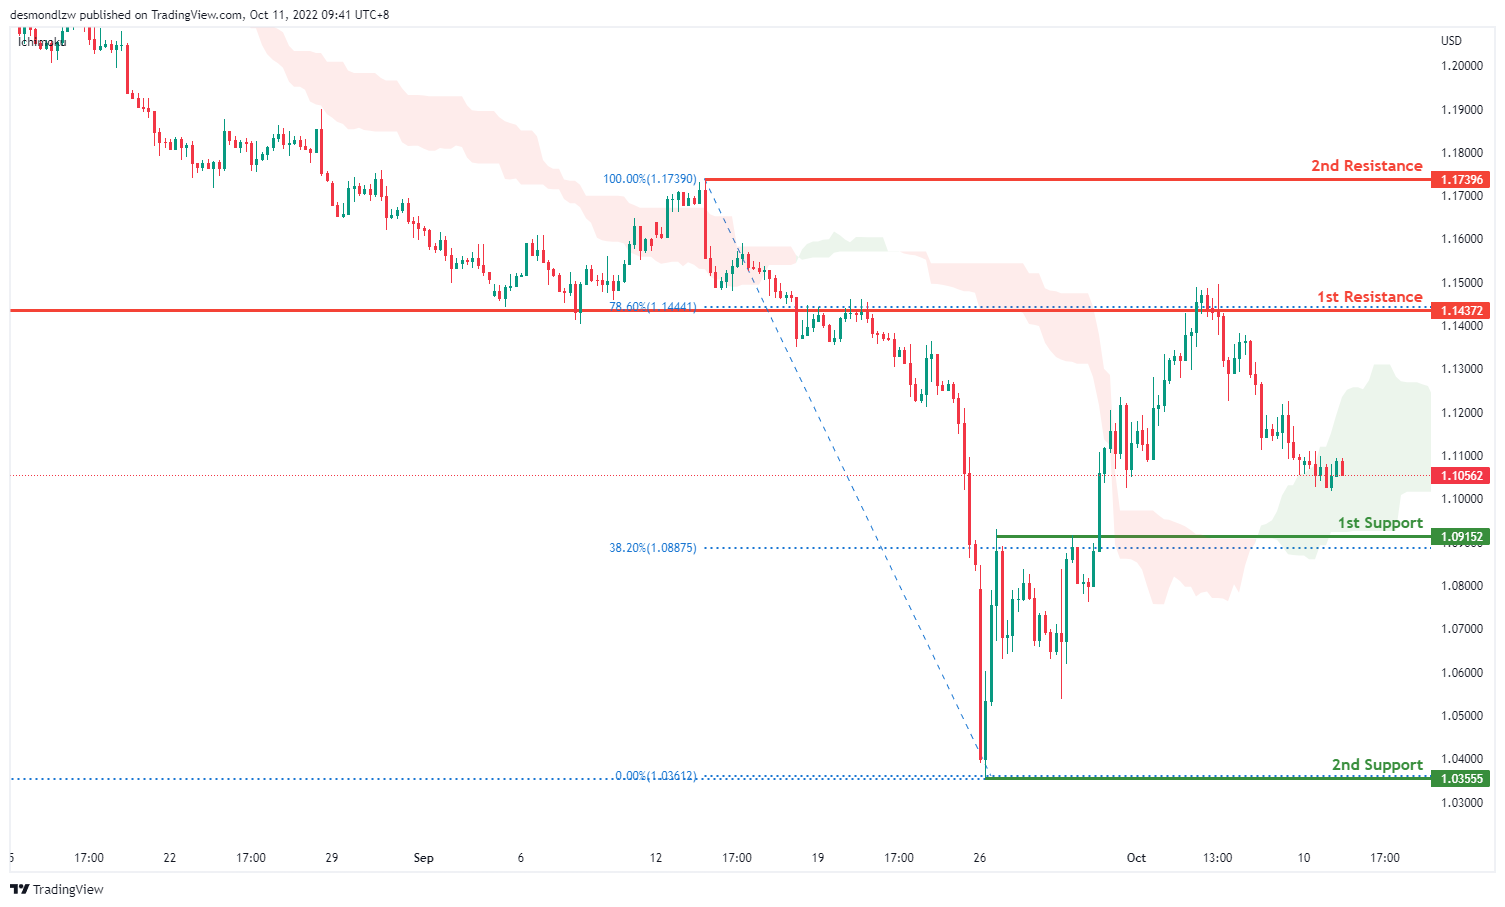
On the H4, price has rejected the first resistance and is moving in a descending trend hence we are bearish bias- price might break the ichimoku to test the first support at 1.0915 where the 38.2% retracement sits. If it breaks this level, bearish momentum will bring price to the second support at 1.0355 where the previous swing low sits. Alternatively price can test the first resistance at 1.1437 where the 78.6% retracement and overlap resistance sit. Subsequently the second resistance at 1.1739
Areas of consideration:
- H4 1st support at 1.0915
- H4 1st resistance at 1.1437
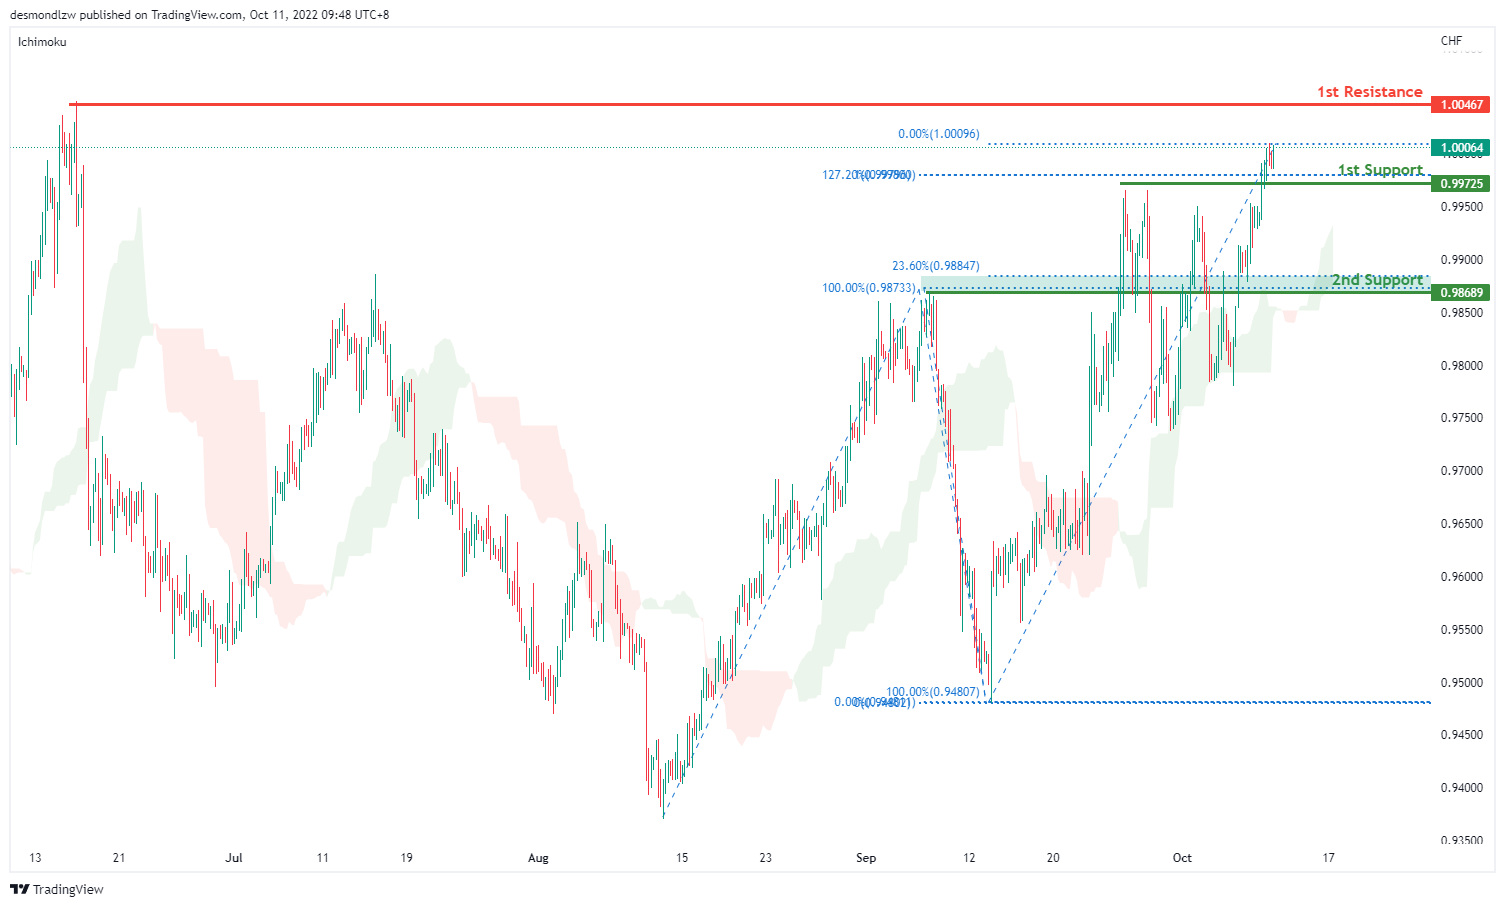
USD/CHF:
USDCHF is in a strong bullish trend on the H4 chart. Price is trading above the Ichimoku cloud signalling a bullish trend. Price looks like it’s moving toward the first resistance 1.0046 where the previous swing high sits. Alternatively price can test the first support at 0.9972 where the 127.2% extension and swing high sits then the second support at 0.9868 where the overlap support and 23.6% retracement sits
Areas of consideration
- H4 1st support at 0.9972
- H4 1st resistance at 1.0046
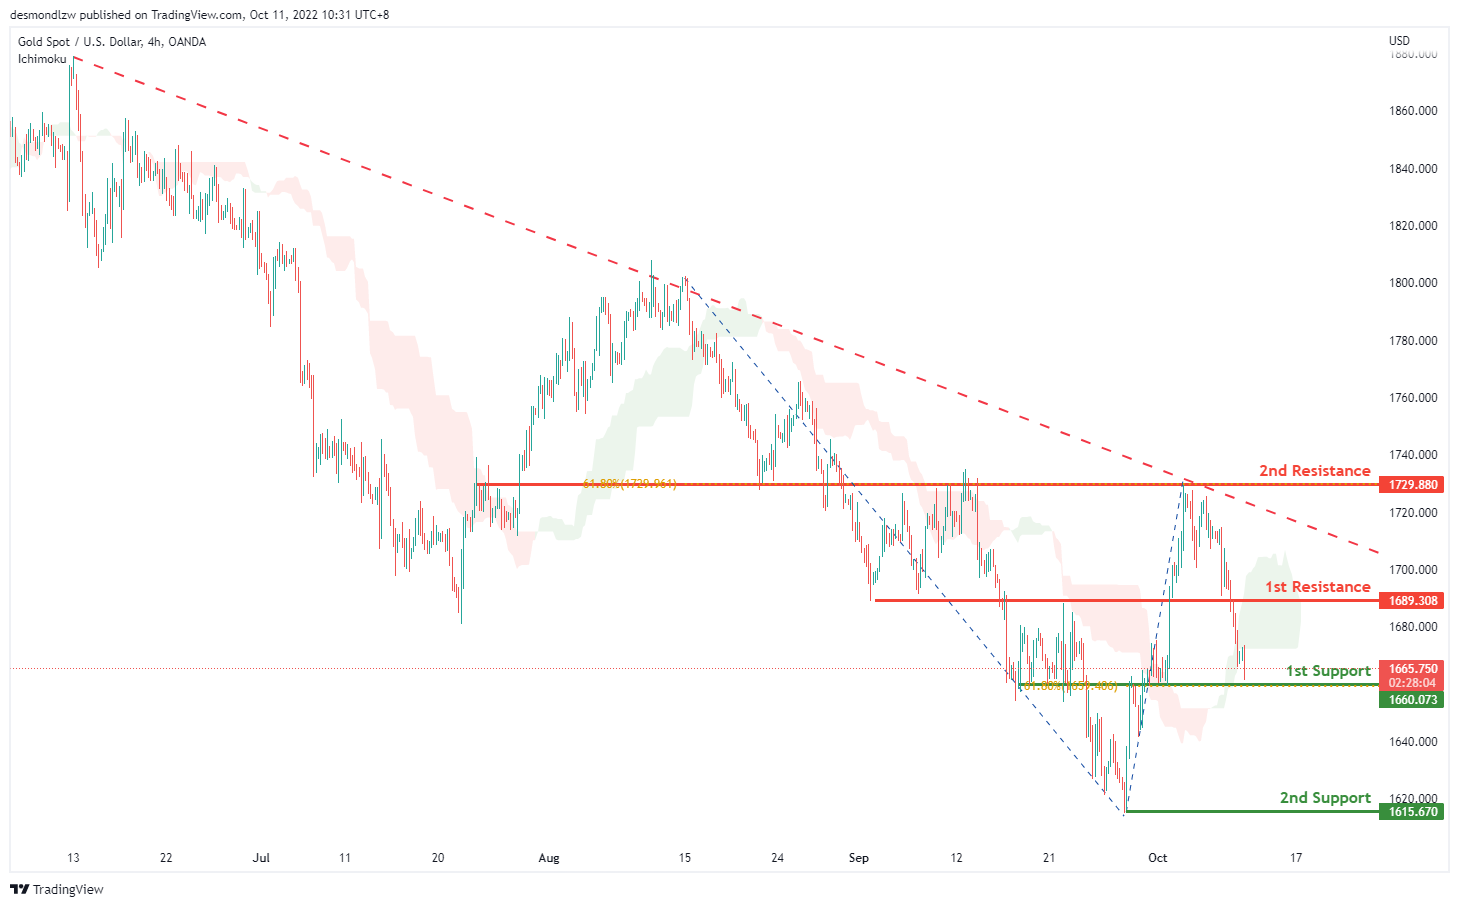
XAU/USD (GOLD):
On the H4, price is dropping to test the 1st support at 1665.160, which is in line with the 61.8% fibonacci retracement and overlap support, as the price is above ichimoku cloud, we can expect the price bounce off from here and rise to the 1st resistance at 1689.308, which is in line with the overlap resistance. If the 1st resistance is broken, we can expect the price rise to the 2nd resistance at 1729.880, where the 61.8% fibonacci retracement and previous swing high is. Alternatively, the price may break the 1st support and drop to the 2nd support at 1615.670, where the swing low is.
Areas of consideration:
- H4 time frame, 1st support at 1665.160
- H4 time frame, 2nd resistance at 1729.880
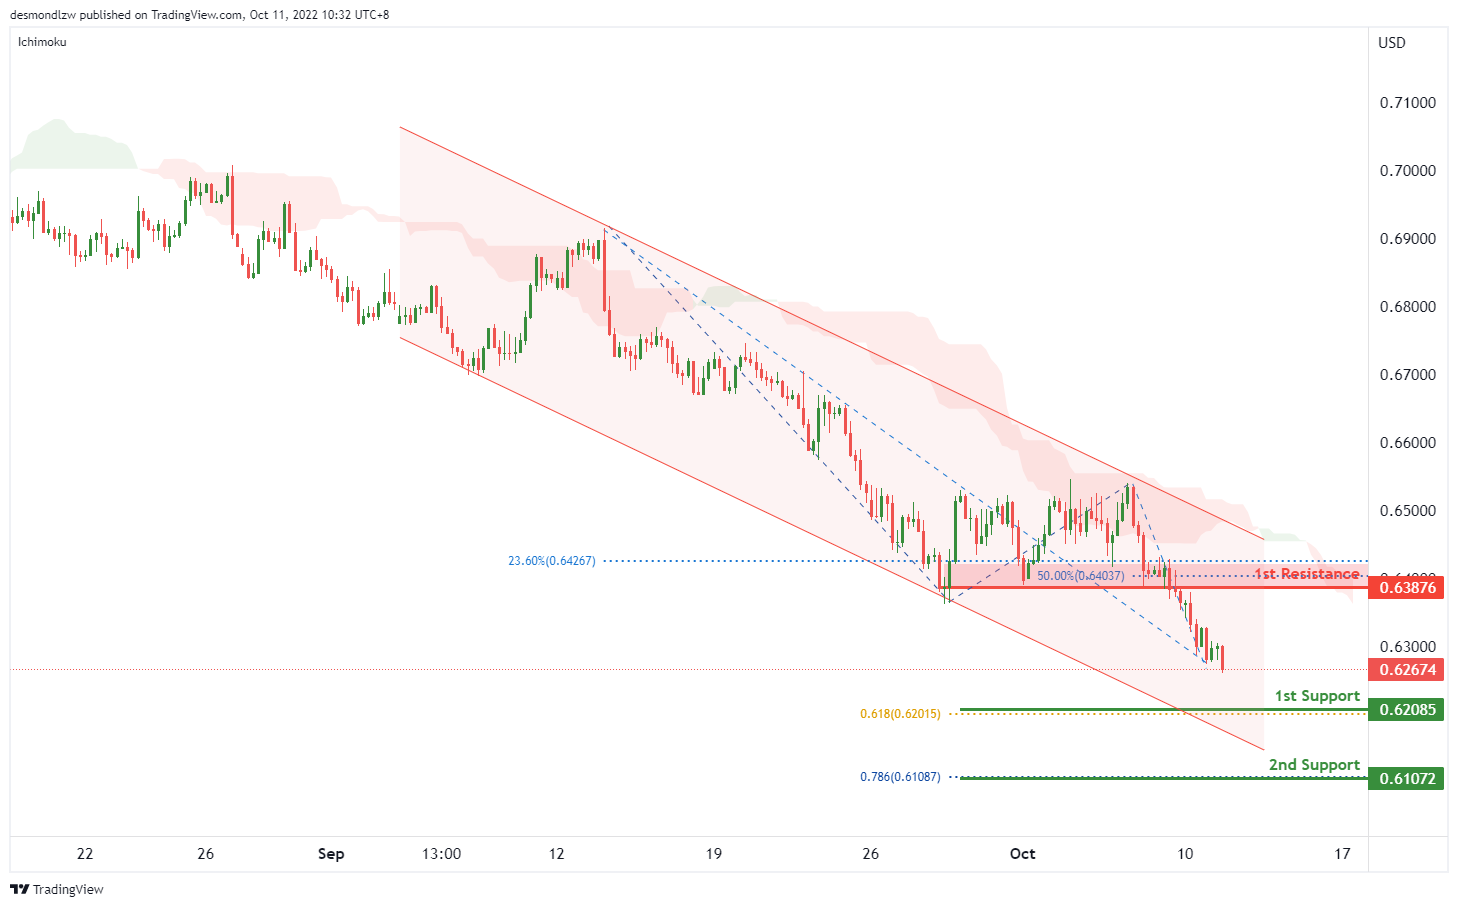
AUD/USD:
On the H4, the price is moving within the descending channel and below ichimoku cloud, we have a bearish bias that the price may drop to the 1st support at 0.62085, which is in line with the 61.8% fibonacci projection. If the 1st support is broken, the 2nd support could be at 0.61072, where the 78.6% fibonacci projection is. Alternatively, the price may rise to the 1st resistance at 0.63876, which is in line with the 23.6% fibonacci retracement and 50% fibonacci retracement.
Areas of consideration
- H4, 1st support at 0.63509,
- H4, 2nd support at 0.61072
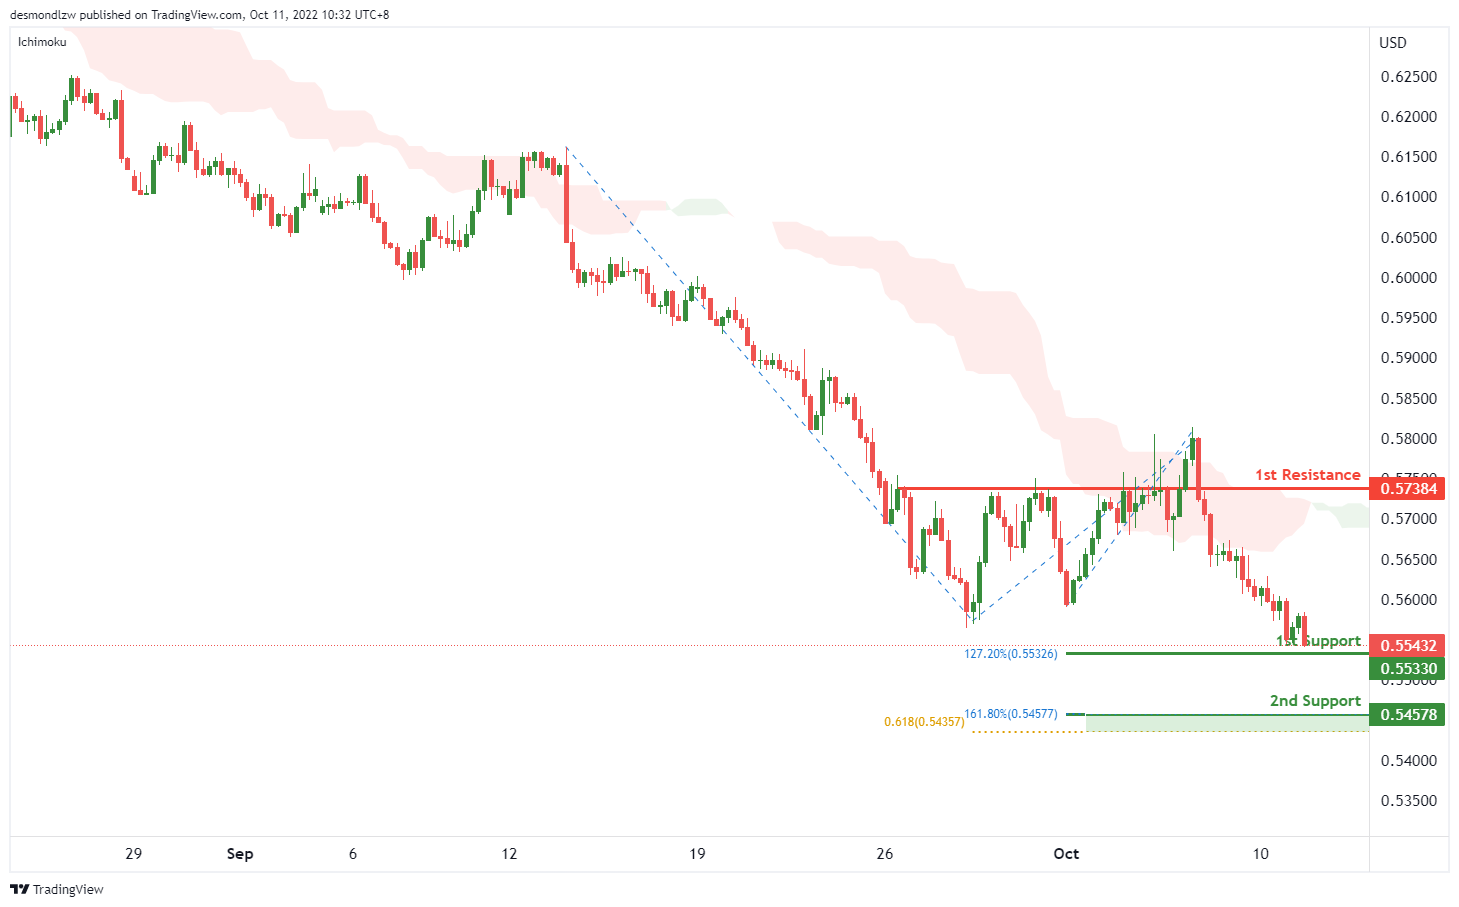
NZD/USD:
On the H4, the price is below ichimoku cloud and testing the 1st support at 0.55330, which is in line with the 127.2% fibonacci extension, if the price can break this level, we can expect the price drop to the 2nd support at 0.54578, which is in line with the 161.8% fibonacci extension and 61.8% fibonacci projection. ALternatively, the price may bounce off from the 1st support and rise to the 1st resistance at 0.57384, where the previous swing highs are.
Areas of consideration:
- H4 time frame, 1st support at 0.55330
- H4 time frame, 2nd support at 0.54578
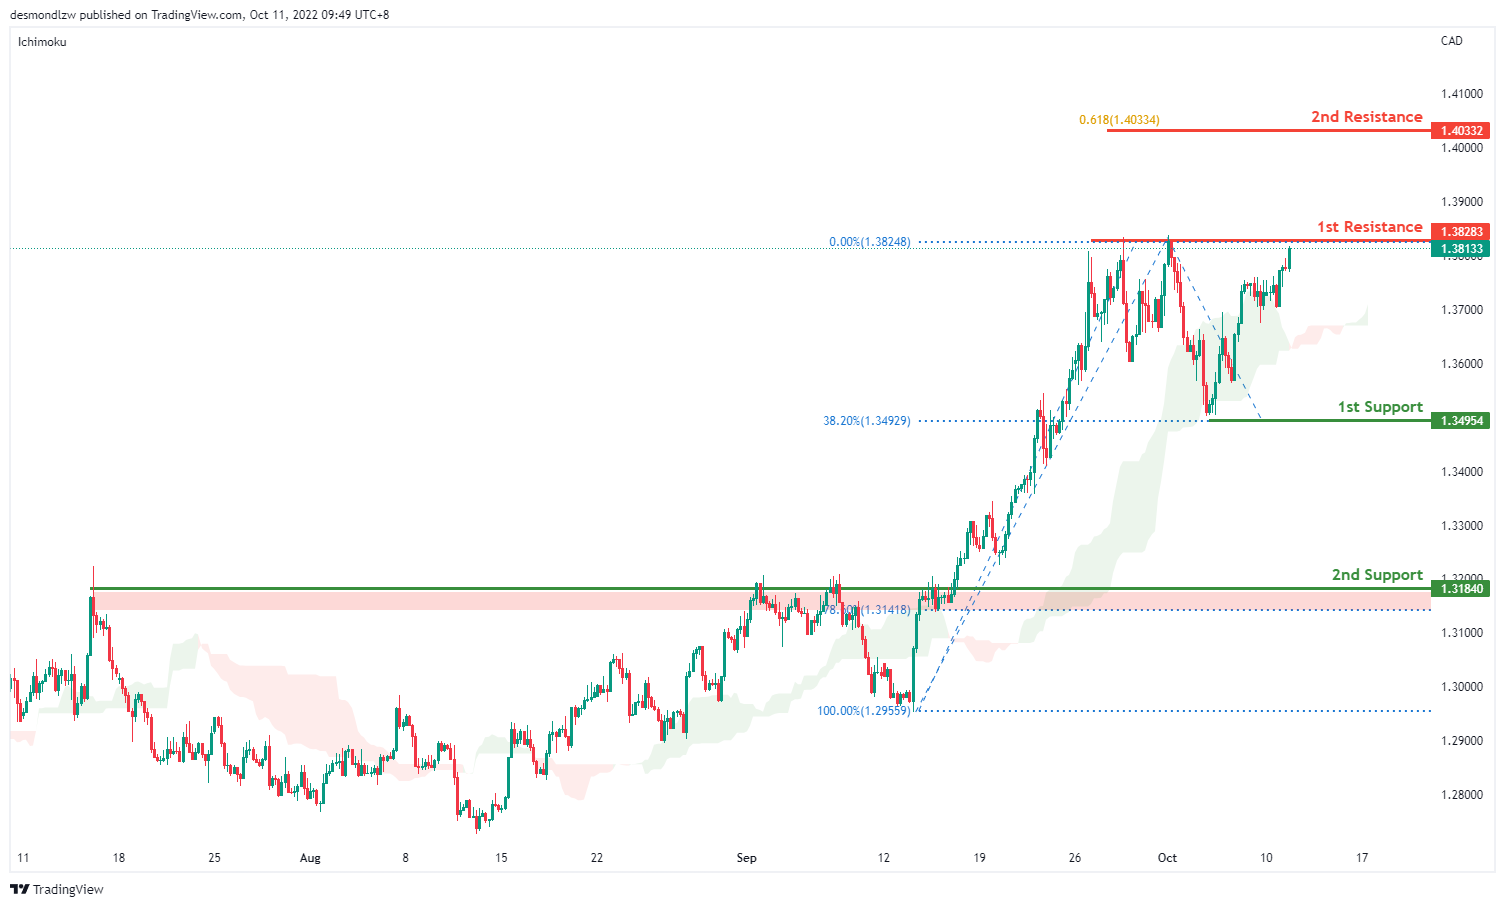
USD/CAD:
On the H4, the price trades higher near the 1st resistance of 1.3832 which is the previous swing high level. With the price trading above the ichimoku cloud, we have a short term bullish bias. The price could break the first resistance to test the second resistance at 1.4033 where the 61.8% projection sits. Alternatively it could fall to the 1st support at 1.3495 which is in line with the 38.2% retracement level and the previous swing low subsequently the second support at 1.3184 where the overlap support sits
Areas of consideration:
- H4 time frame, 1st resistance at 1.3828
- H4 time frame, 1st support at 1.3495
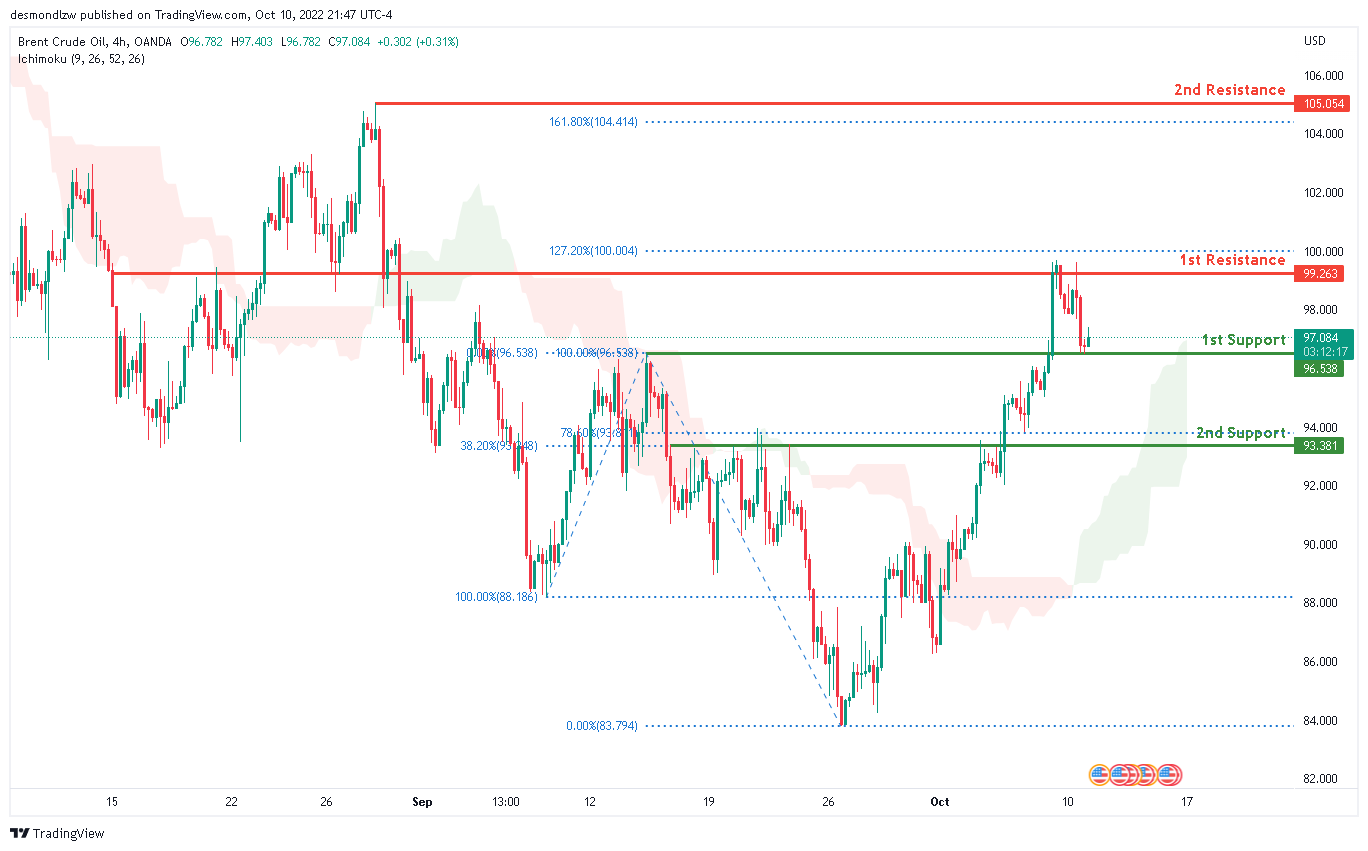
OIL:
Looking at the H4 chart, the current overall bias for Oil is bullish . To add confluence to this bias, the price is currently above the Ichimoku cloud which indicates a bullish market. Overnight, price has retraced backdownards.. If the bullish momentum continues, expect price to possibly head towards the 1st resistance line at 99.263, where the 127.2% Fibonaaci extension line is located.
Areas of consideration:
- H4 time frame, 1st resistance at 99.263
- H4 time frame, 1st support at 96.538
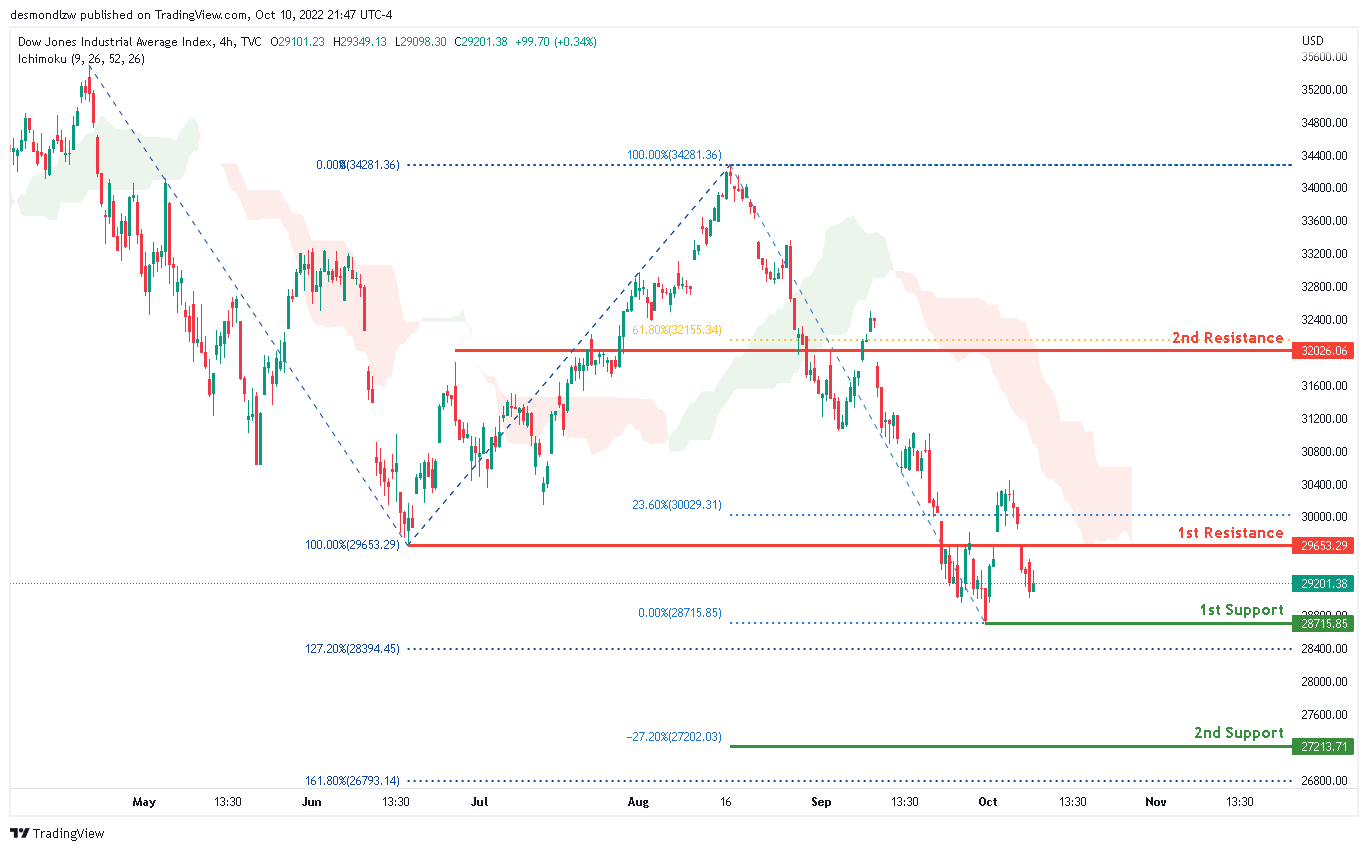
Dow Jones Industrial Average:
Looking at the H4 chart, the current overall bias for Oil is bearish. To add confluence to this bias, the price is currently below the Ichimoku cloud which indicates a bearish market. Overnight, price has continued it’s bearish momentum downwards… If the bearish momentum continues, expect price to possibly head towards the 1st support line at 29653.29, where the 0% Fibonacci line and 127.2% Fibonacci extension line is located.
Areas of consideration:
- H4 time frame, 1st support at 28715.85
- H4 time frame, 1st resistance at 29653.29
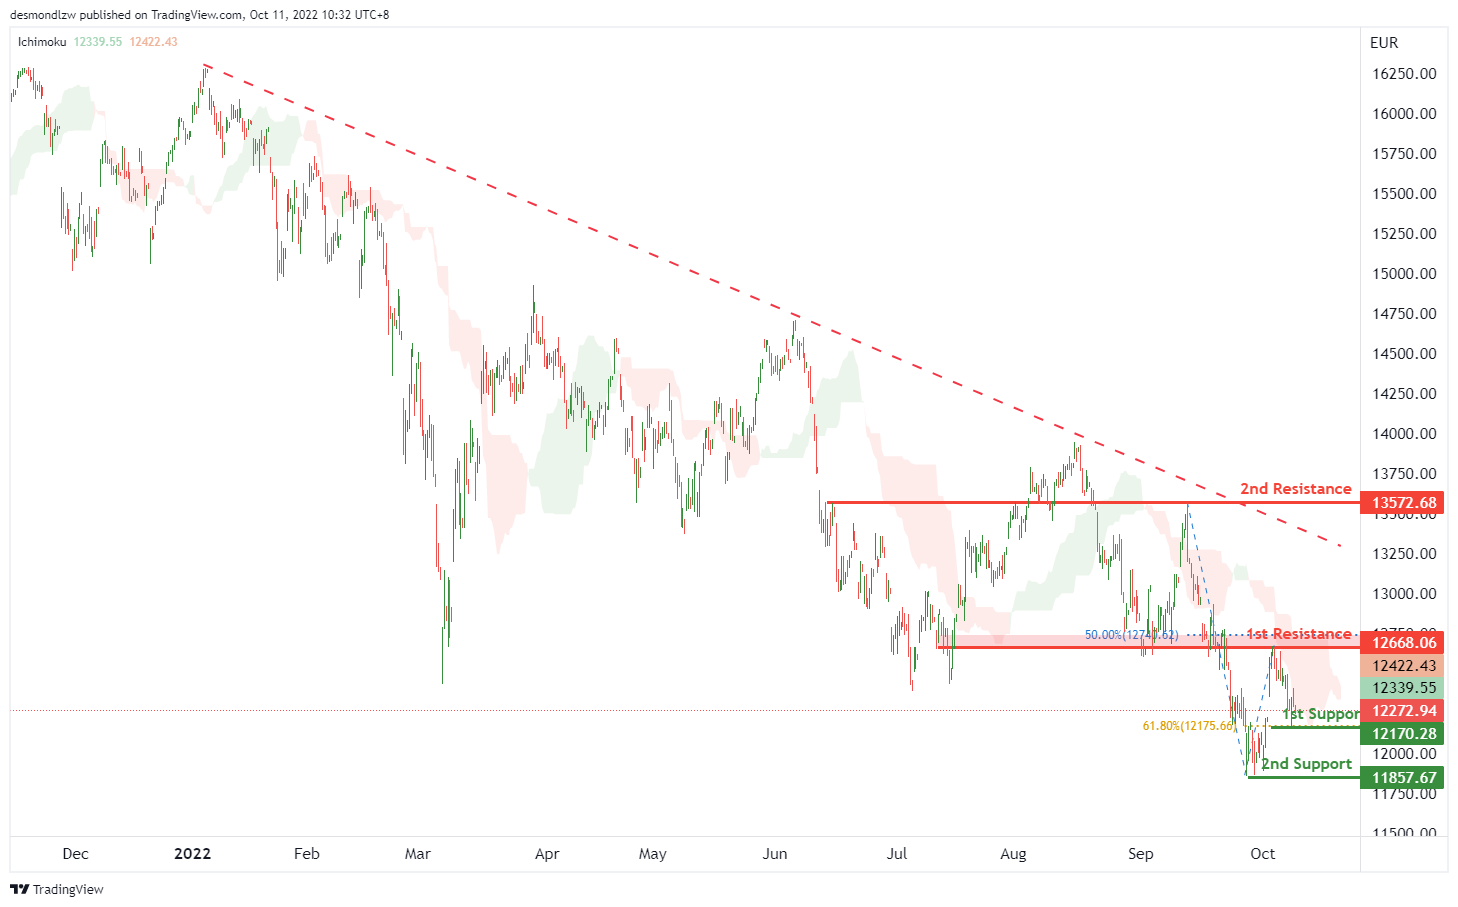
DAX:
On the H4, with the price moving below ichimoku cloud and long term descending trendline, we have a bearish bias that the price may break the 1st support at 12170.28, which is in line with the 61.8% fibonacci retracement. If the 1st support is broken, the 2nd support could be at 11857.67, which is in line with the swing low. Alternatively, the price may rise to the 1st resistance at 12668.06, which is in line with the 50% fibonacci retracement and overlap resistance, if the 1st resistance is broken, the 2nd resistance could be at 13572.68, where the previous swing high is.
Areas of consideration:
- H4 time frame, 1st support at 12170.28
- H4 time frame, 2nd support at 11857.67
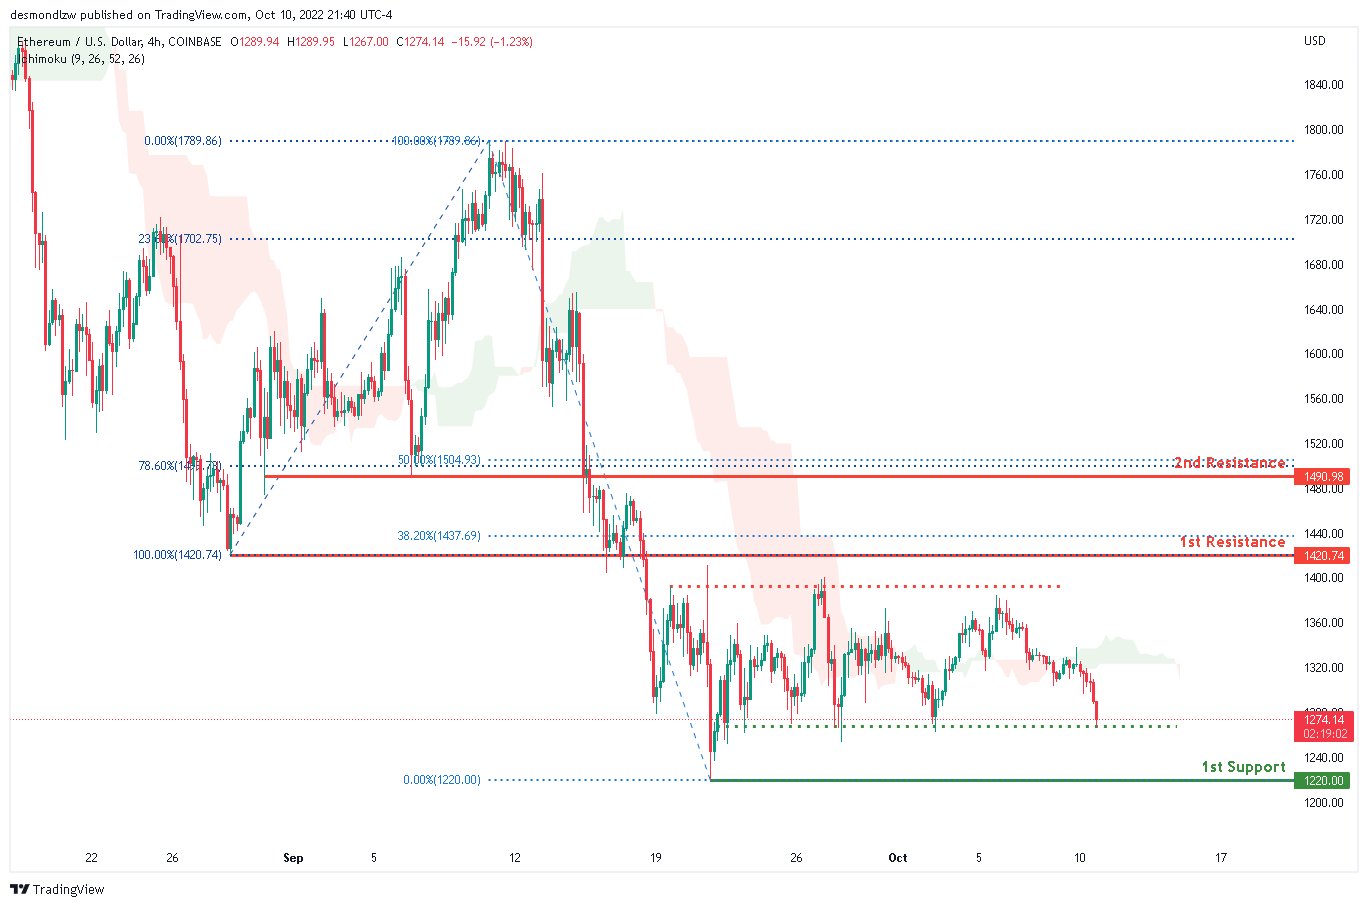
ETHUSD:
Looking at the H4 chart, the current overall bias for ETHUSD is bearish. To add confluence to this bias, the price is currently under the Ichimoku cloud which indicates a bearish market. Overnight, the price has continued it’s bearish momentum downwards.. If the bearish momentum continues, expect price to possibly head towards the 1st support line at 1220.00, where the 0% Fibonaaci line is located.
Areas of consideration:
- H4 time frame, 1st resistance of 1420.74
- H4 time frame, 1st support at 1220.00
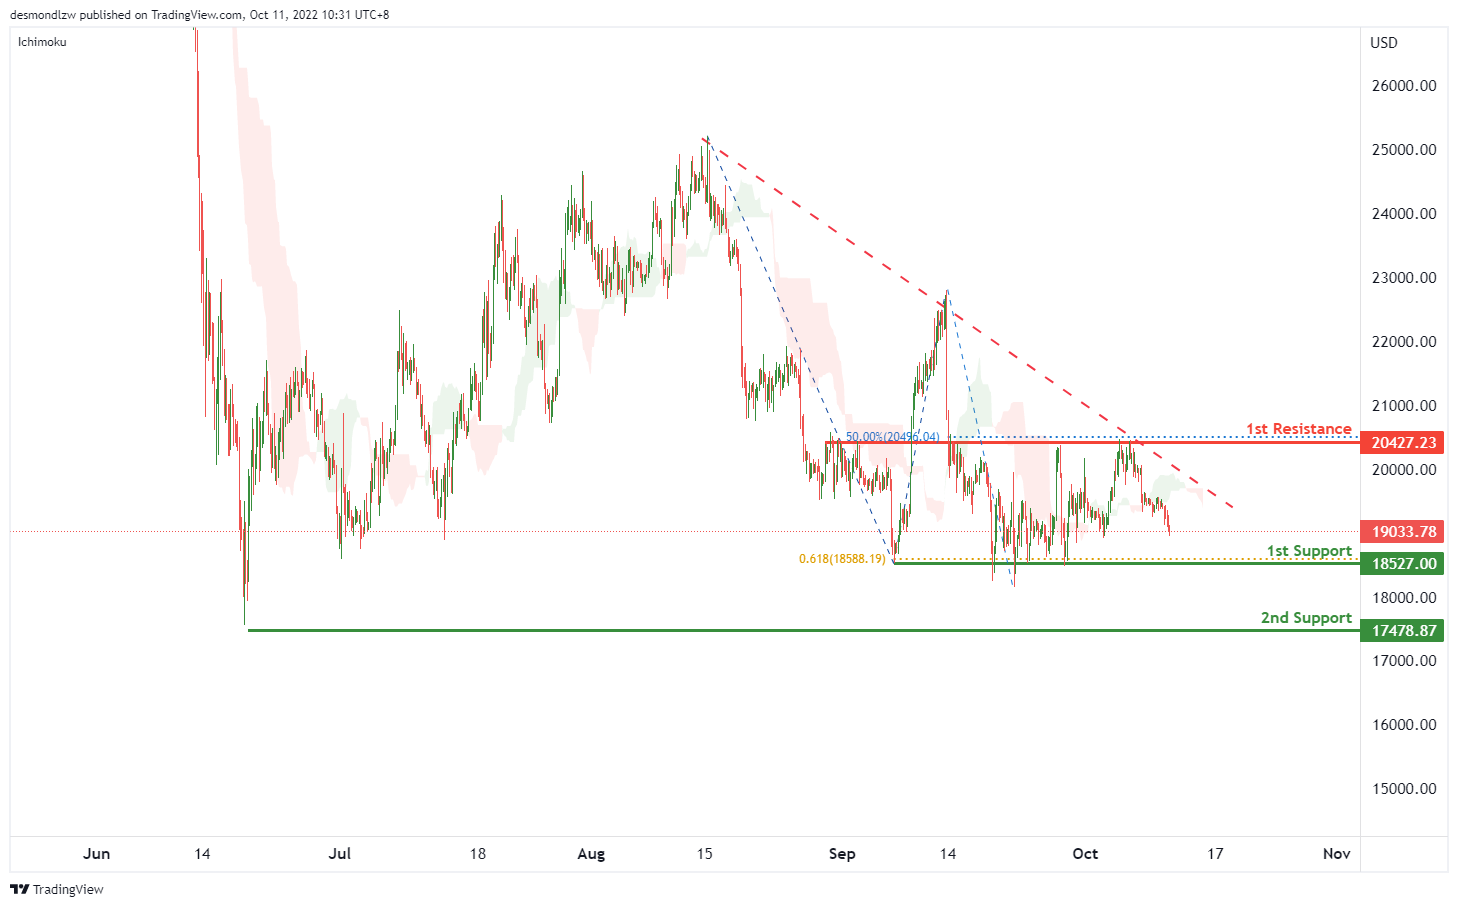
BTCUSD:
On the H4, price is showing a descending trendline and below the ichimoku cloud, we can expect the price drop to test the 1st support at 18527.00, which is in line with the swing lows and 61.8% fibonacci projection. If the 1st support is broken, we can expect the price drop to the 2nd support at 17475.87, where the previous swing low is. Alternatively, the price may rise to the 1st resistance at 20427.23, where the overlap resistance and 50% fibonacci retracement are.
Areas of consideration:
- H4 time frame, 1st support at 18527.00
- H4 time frame, 2nd support at 17475.87
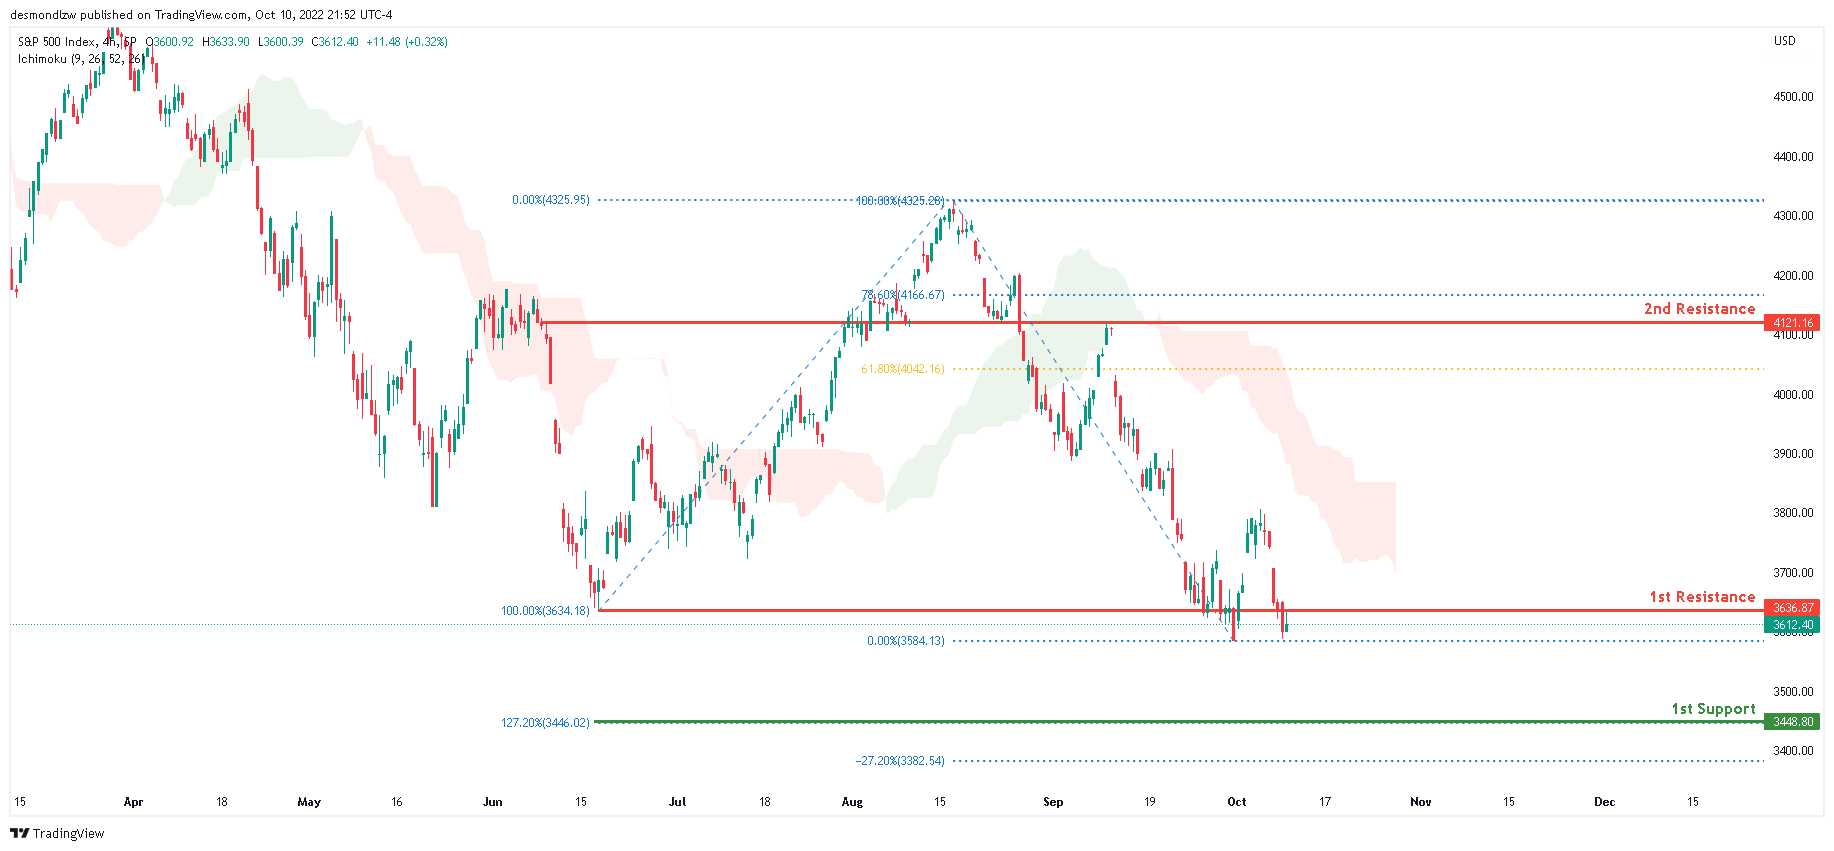
S&P 500:
Looking at the H4 chart, the current overall bias for S&P500 is bearish. To add confluence to this bias, the price is currently under the Ichimoku cloud which indicates a bearish market. Overnight, the price has closed under the 1st resistance line at 3636.87, where the 100% Fibonacci line and previous swing low is located. If the bearish momentum continues, expect price to possibly head towards the 1st support line at 3448.80, where the 127.2% Fibonaaci line is located.
Areas of consideration:
- H4 time frame, 1st support at 3448.80
- H4 time frame, 1st resistance at 3636.87


