
USD/JPY:
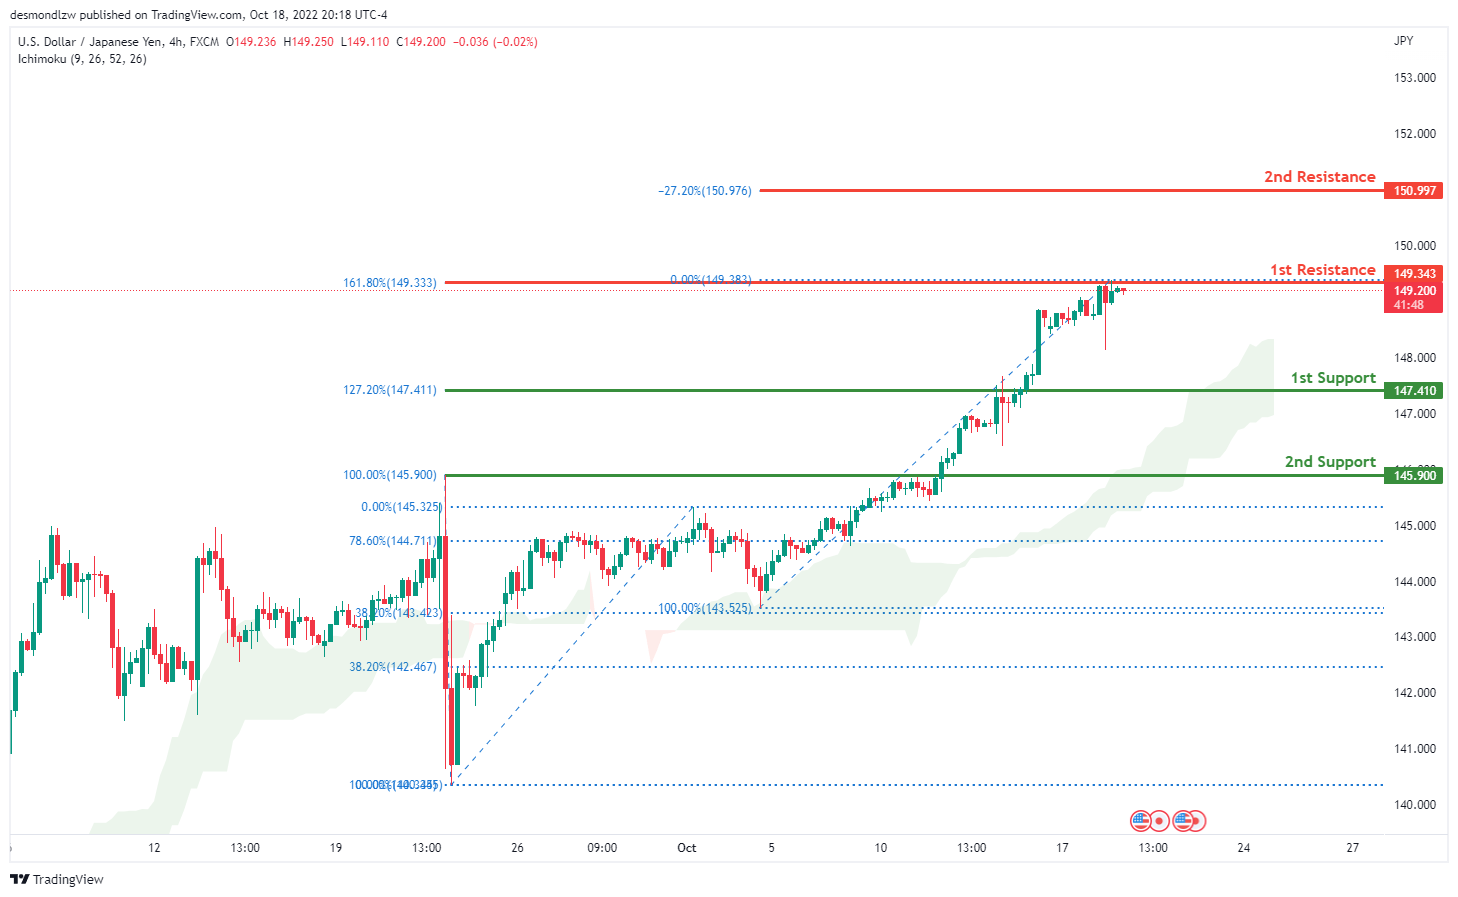
The current general bias for USDJPY on the H4 chart is bullish. To add to this bias, the price is currently trading above the Ichimoku cloud, indicating a bullish market. Price has maintained its strong bullish momentum and crossed the key level at 149.00 with price currently at the 1st resistance at 149.313 where the 161.8% Fibonacci extension is located. If this strong bullish momentum continues, expect price to continue towards the 2nd resistance at 150.997 where the -27.2% Fibonacci expansion is located.
Areas of consideration:
- H4 time frame, 1st resistance at 147.410
- H4 time frame, 2nd resistance at 150.997
- H4 time frame, 1st support at 145.900
DXY:
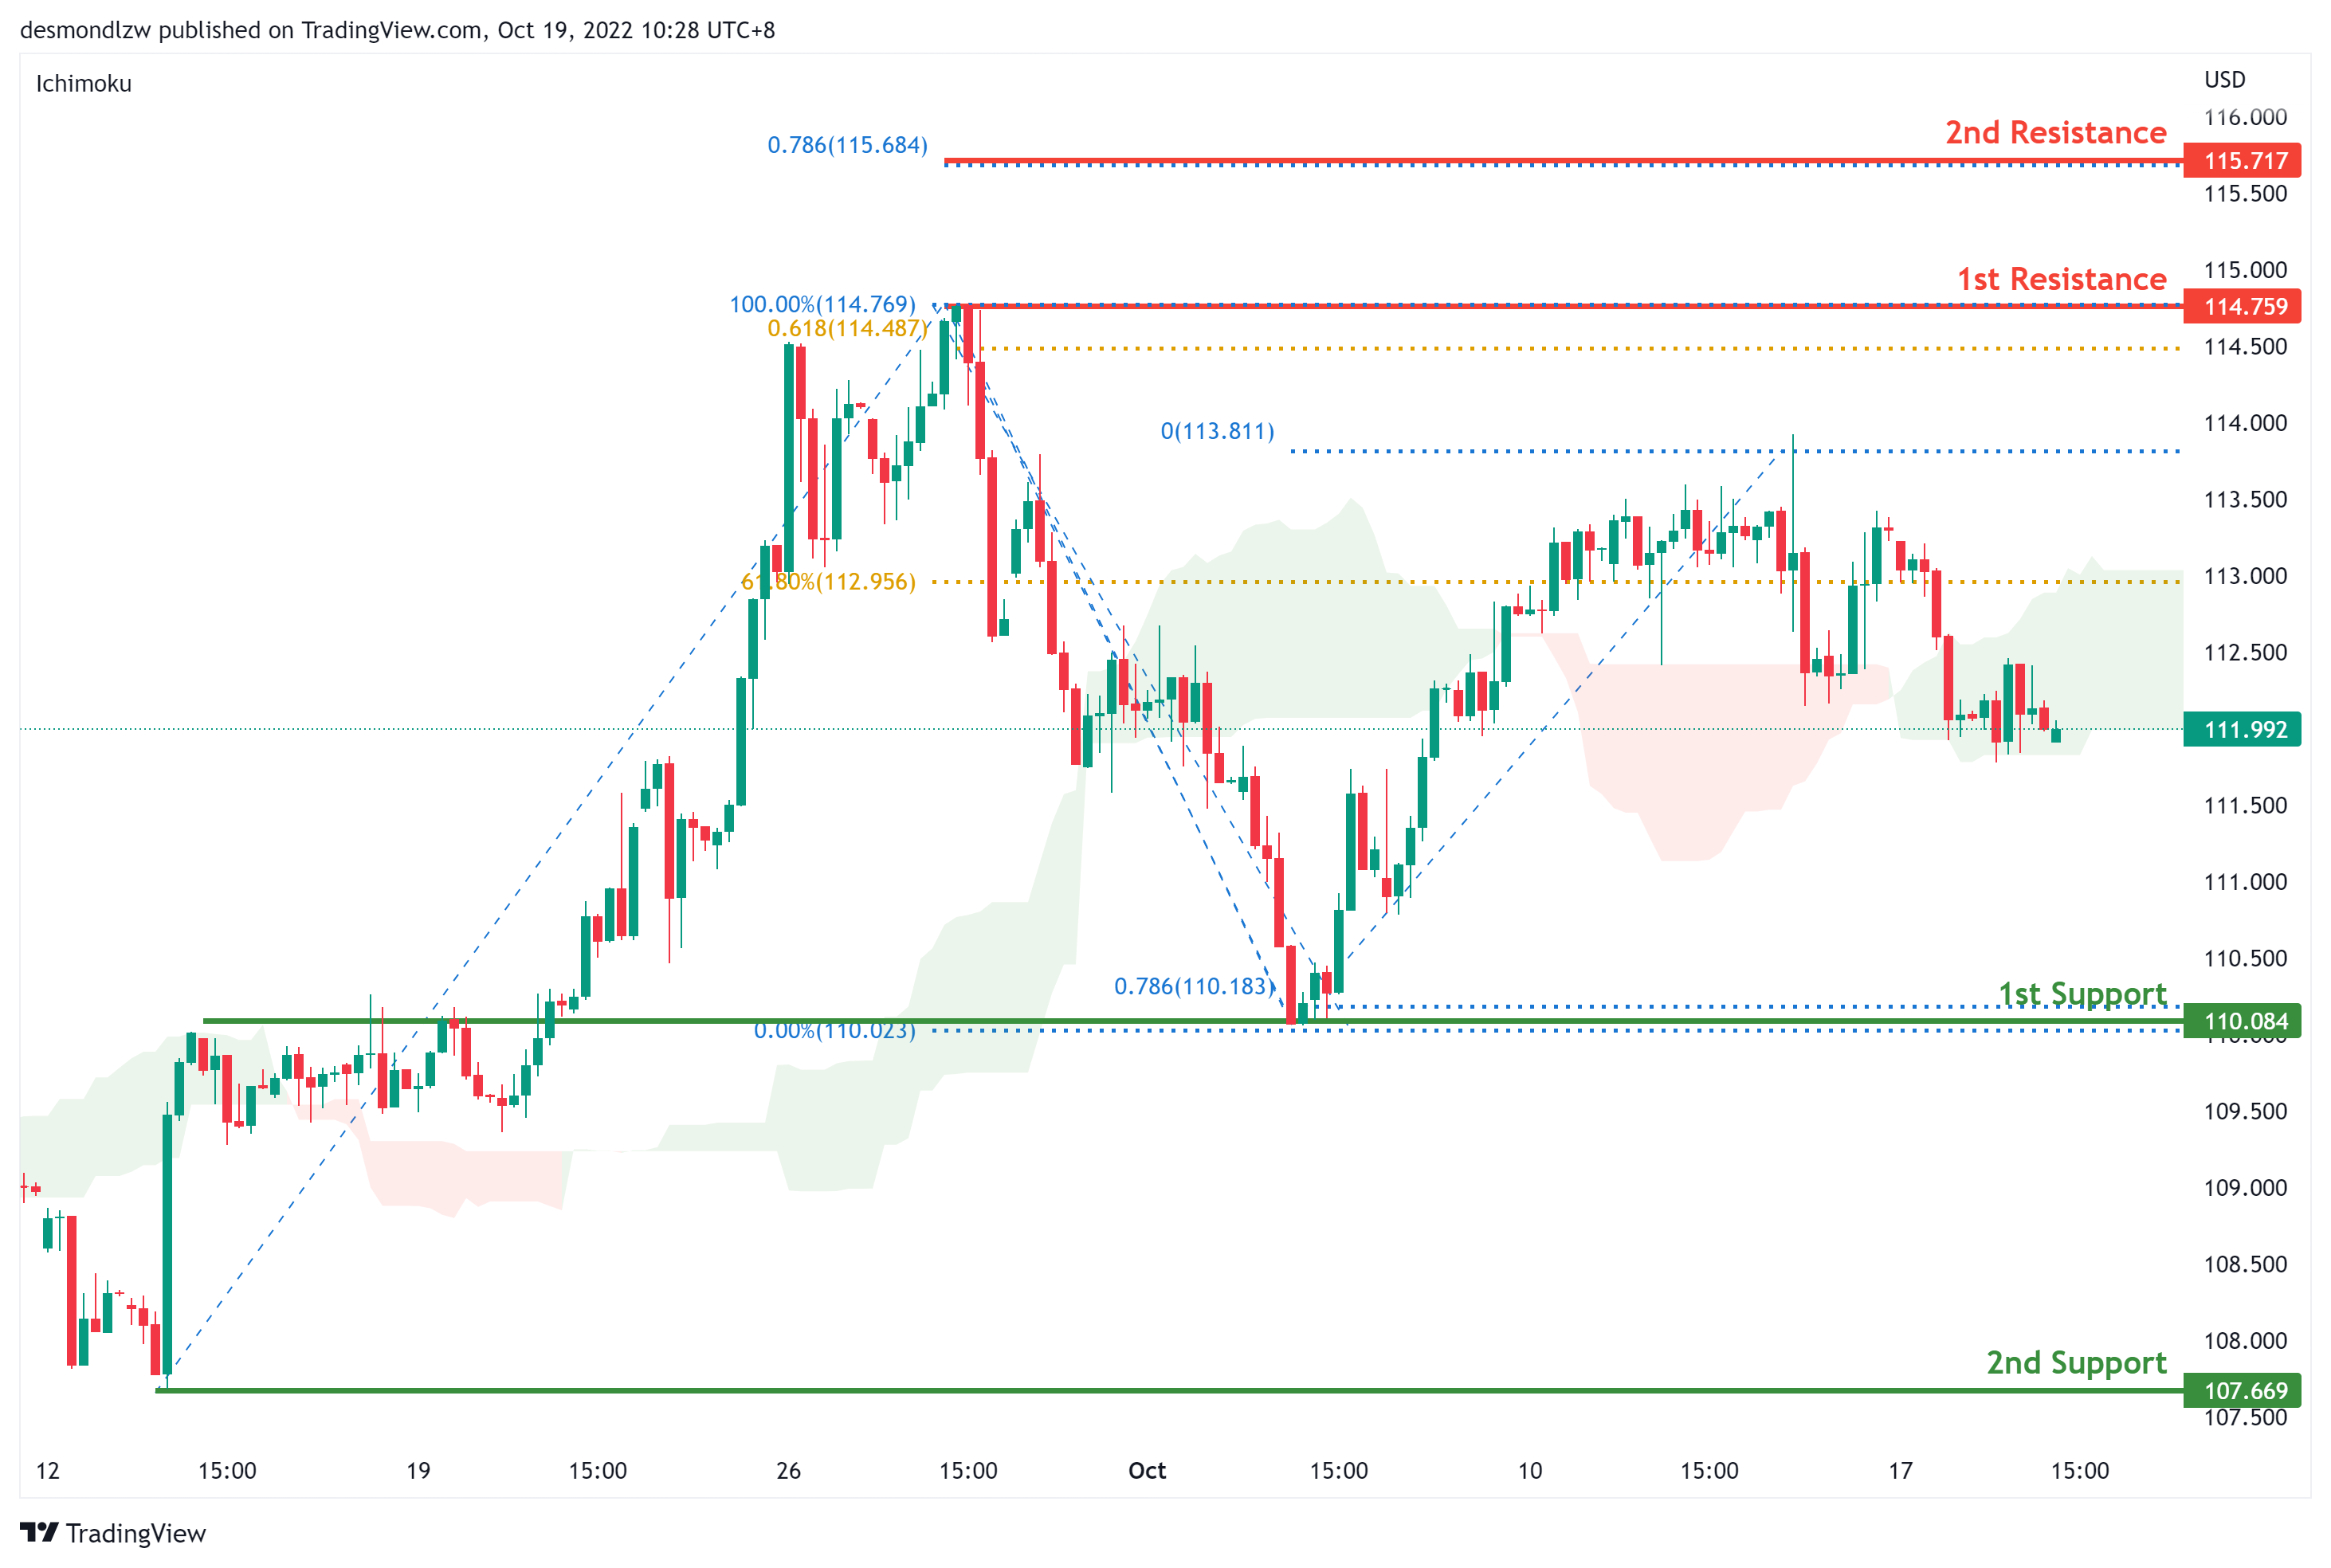
On the H4 chart, prices are moving in a descending trend signalling a bearish momentum. Prices are moving towards the first support at 110.084 where the swing low sits. if it breaks this level, bearish momentum will bring price to second support at 107.669. Alternatively if bullish momentum continues it will bring price to 114.759 and if it breaks this level, bullish momentum will carry price to 115.717 where the 78.6% projection.
Areas of consideration:
- H4 time frame, 1st resistance at 114.759
- H4 time frame, 1st support at 110.084
EUR/USD:
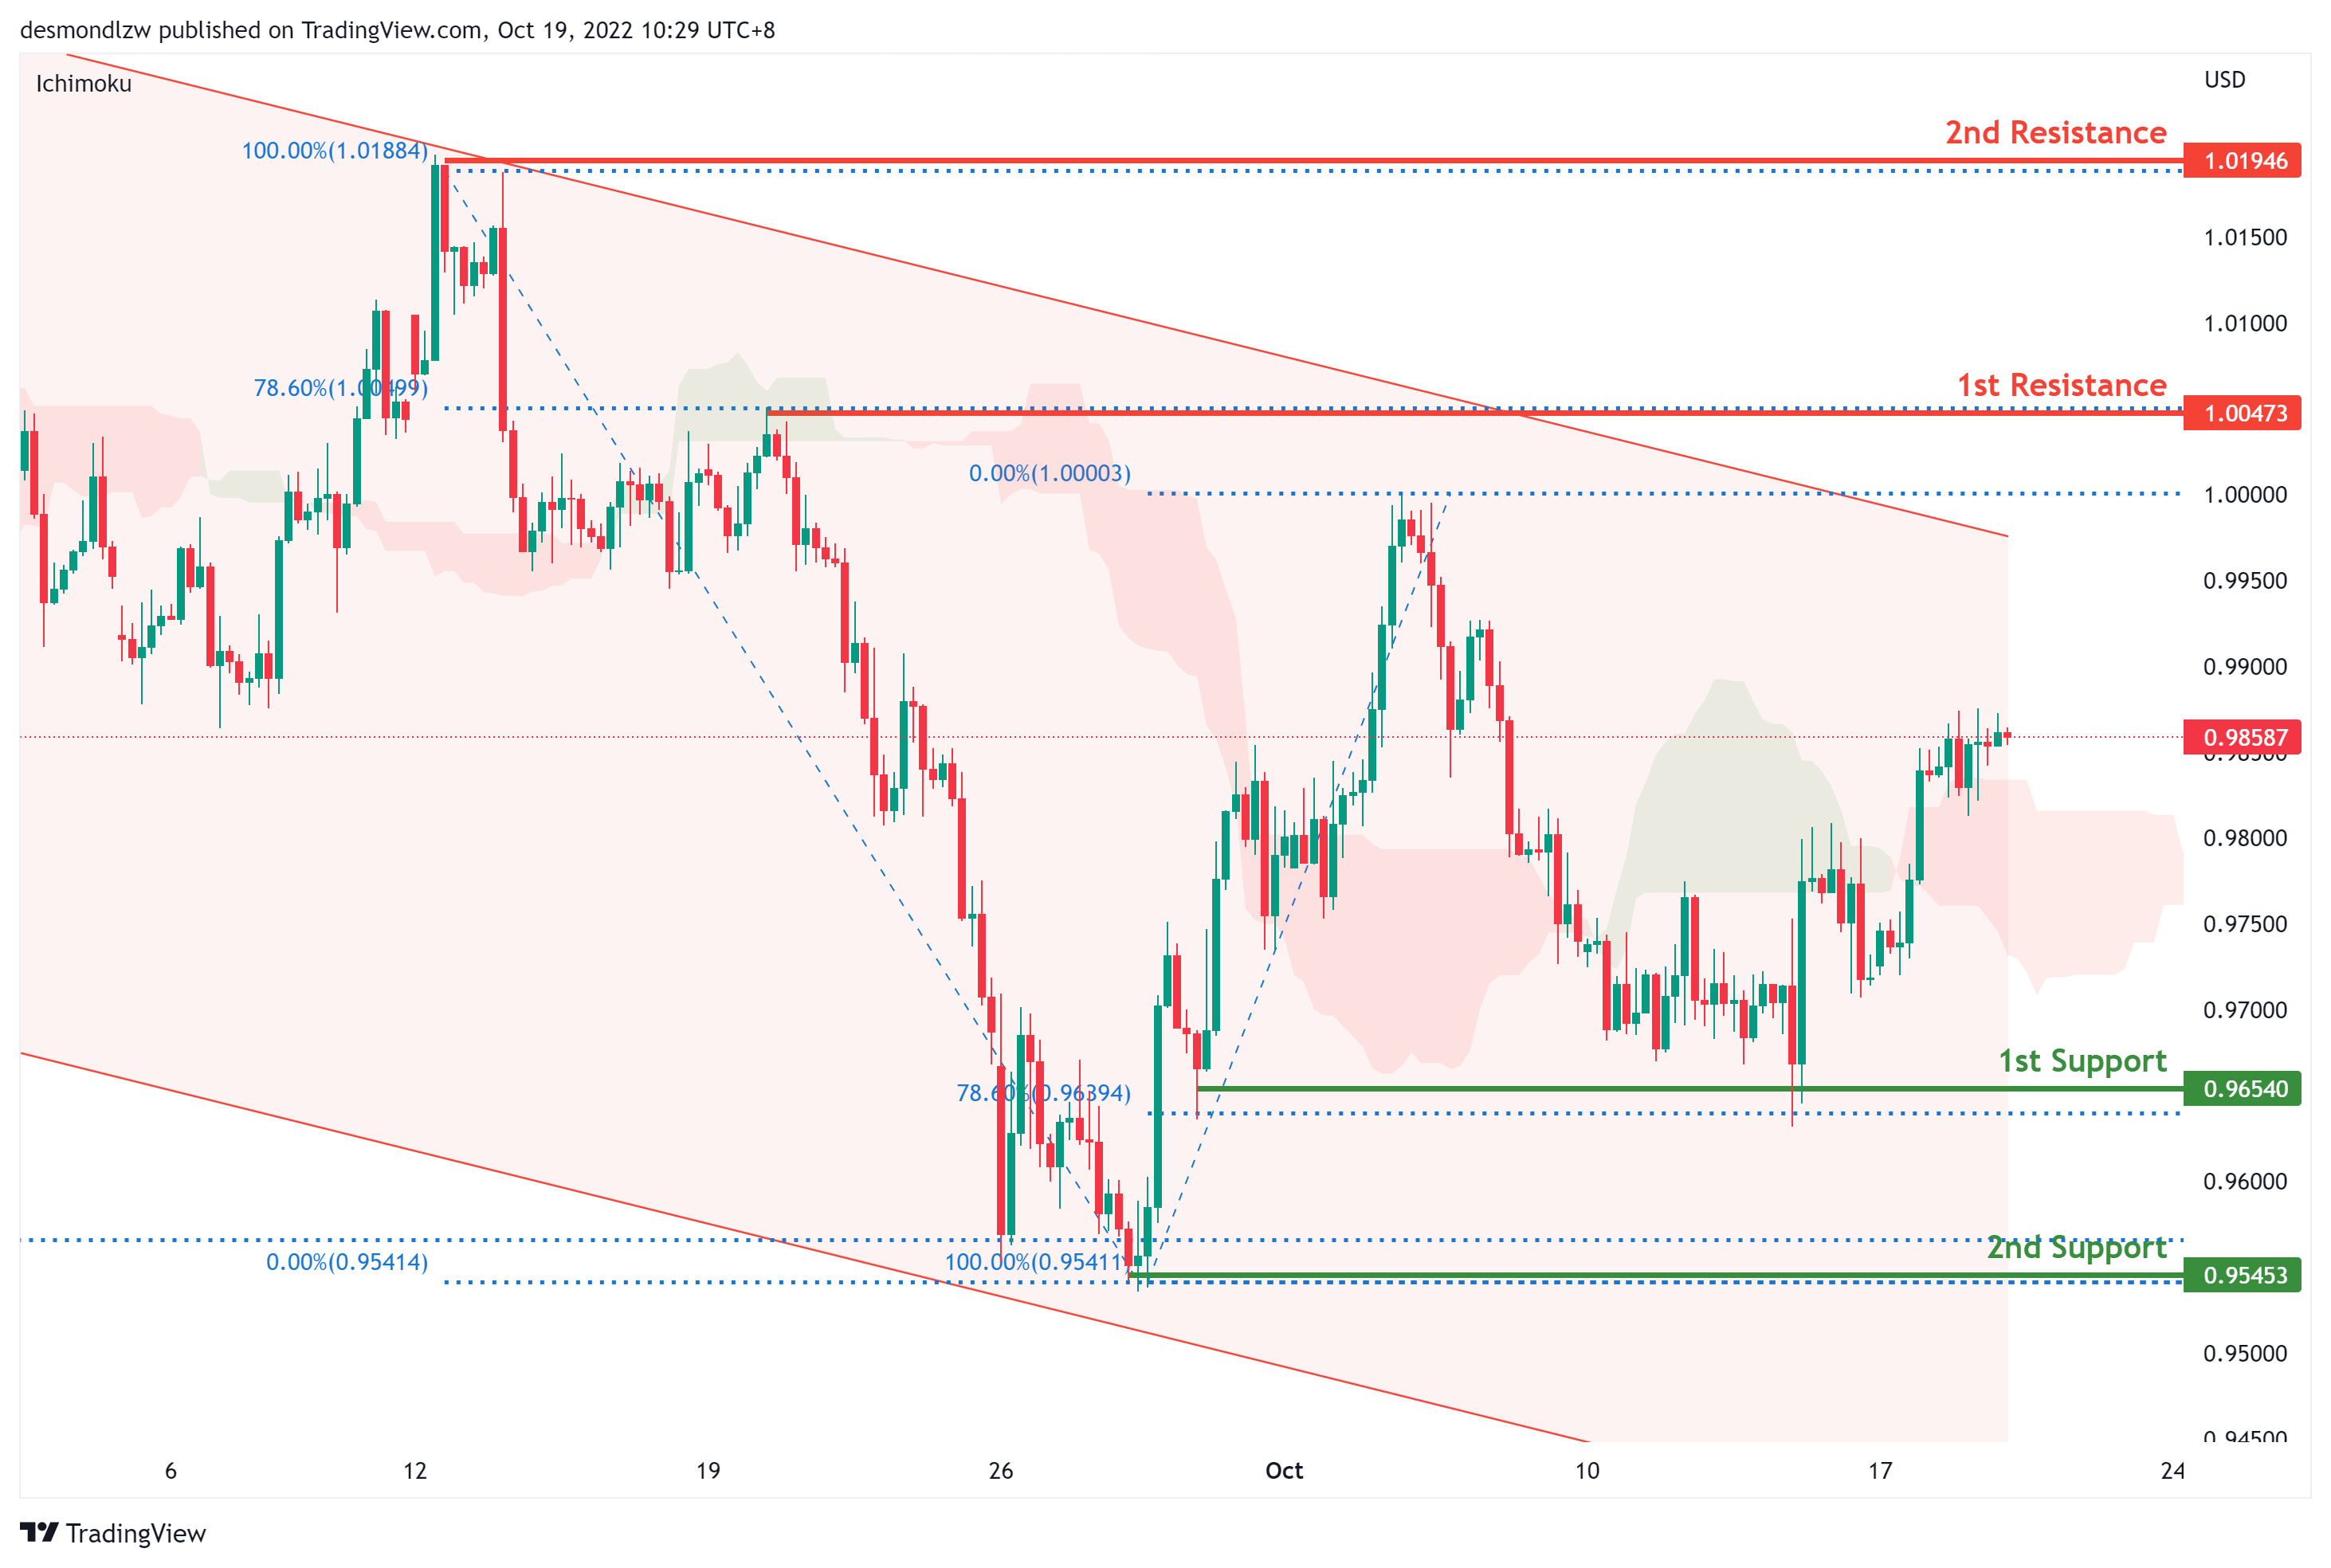
On the H4, price is moving within the descending trendline in a descending manner, with the price moving below ichimoku cloud- we are still overall bearish biased. Price has bounced off the first support hence it might test the first resistance at 1.0047 where the 78.6% retracement sits. If price breaks this level, it may test the second resistance at 1.0194, where the previous swing high sits. Alternatively, bearish momentum might bring price to 0.9695 where the 78.6% retracement sits. if it breaks this level, price would test the second support at 0.9545 where the swing low and 161.8% extension sit.
Areas of consideration :
- H4 1st resistance at 1.0047
- H4 2nd resistance at 1.0194
GBP/USD:
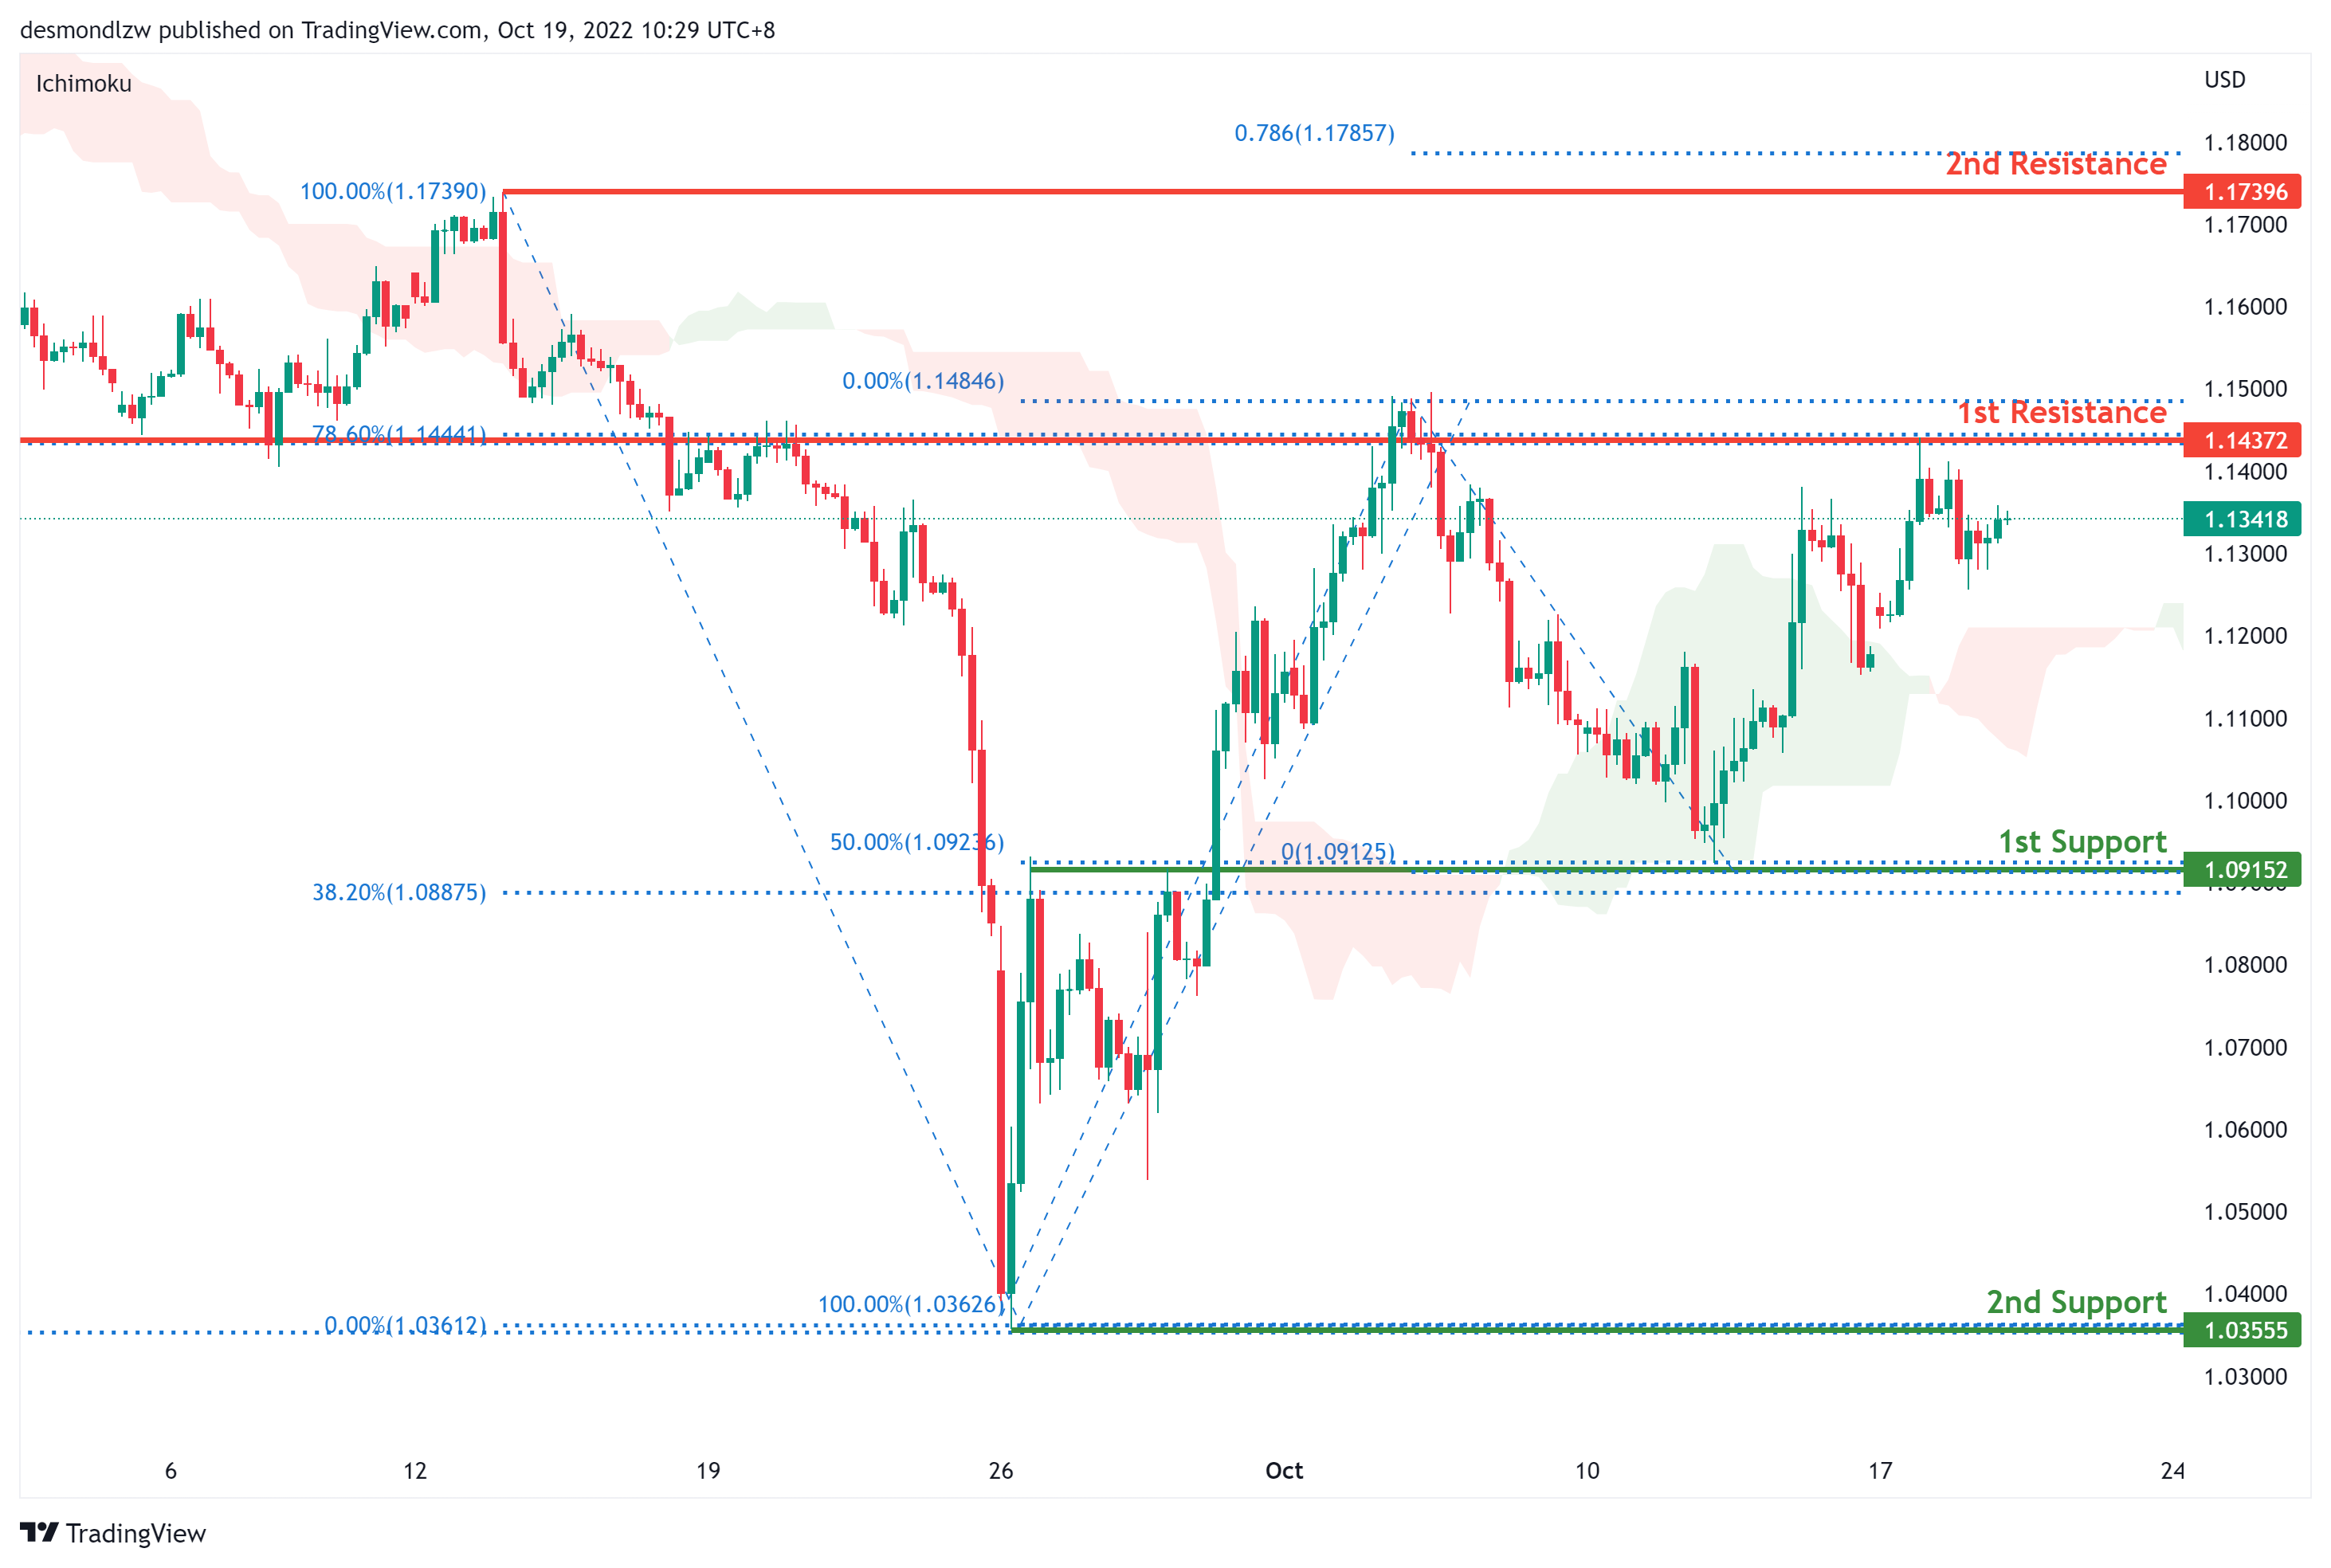
On the H4, price has rejected the resistance and is moving in a descending trend hence we are slightly bearish bias- price looks like its moving toward the first support at 1.0915 where the 50% retracement sits, bearish momentum will bring price to the second support at 1.0355 where the previous swing low sits. Alternatively, price could test the first resistance at 1.1437 where the 78.6% retracement and overlap resistance sit. If it breaks this level, it should test the second resistance at 1.1739.
Areas of consideration:
- H4 1st support at 1.0915
- H4 1st resistance at 1.1437
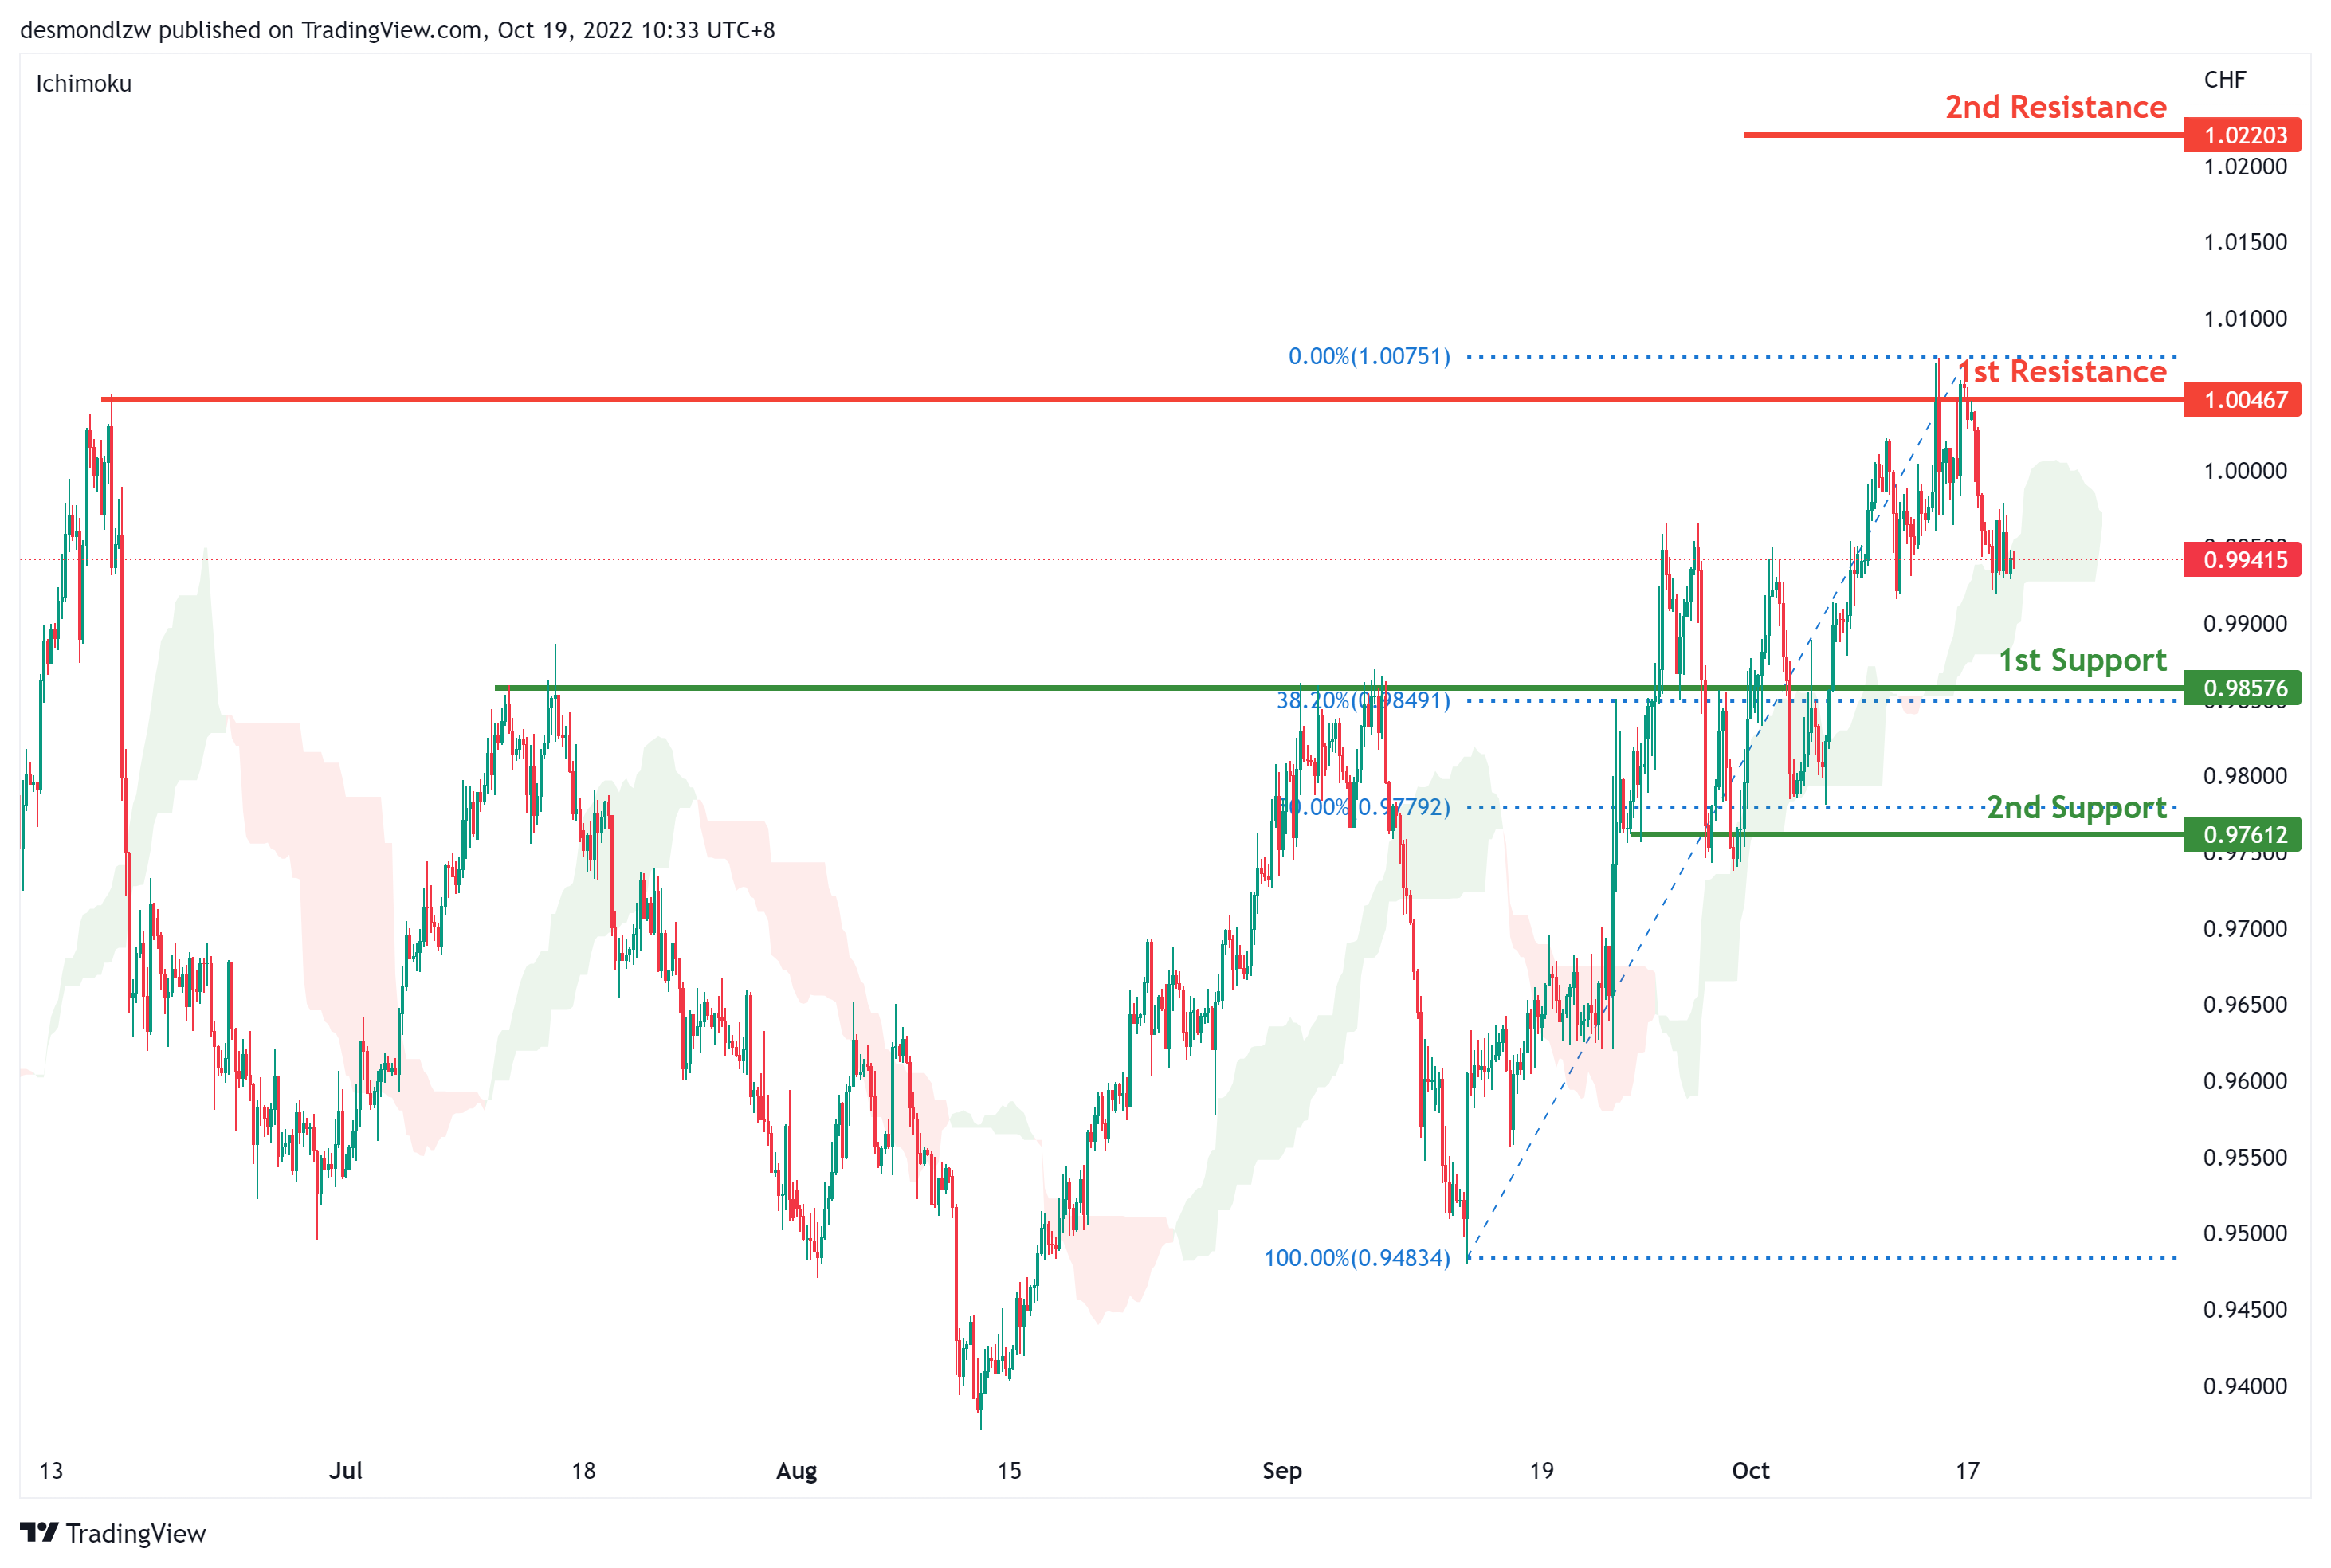
USD/CHF:
USDCHF is in a strong bullish trend on the H4 chart. Price is trading above the Ichimoku cloud signalling a bullish trend. Price has tested the first resistance at 1.0046 where the previous swing high sits and it’s pulling back slightly. Bullish momentum could potentially drive price up to 1.0220. But if bearish momentum continues, price can test the first support at 0.9868 where the overlap support and 23.6% retracement sits then the second support at 0.9757 where the 50% retracement sits
Areas of consideration
- H4 1st support at 0.9868
- H4 1st resistance at 1.0046
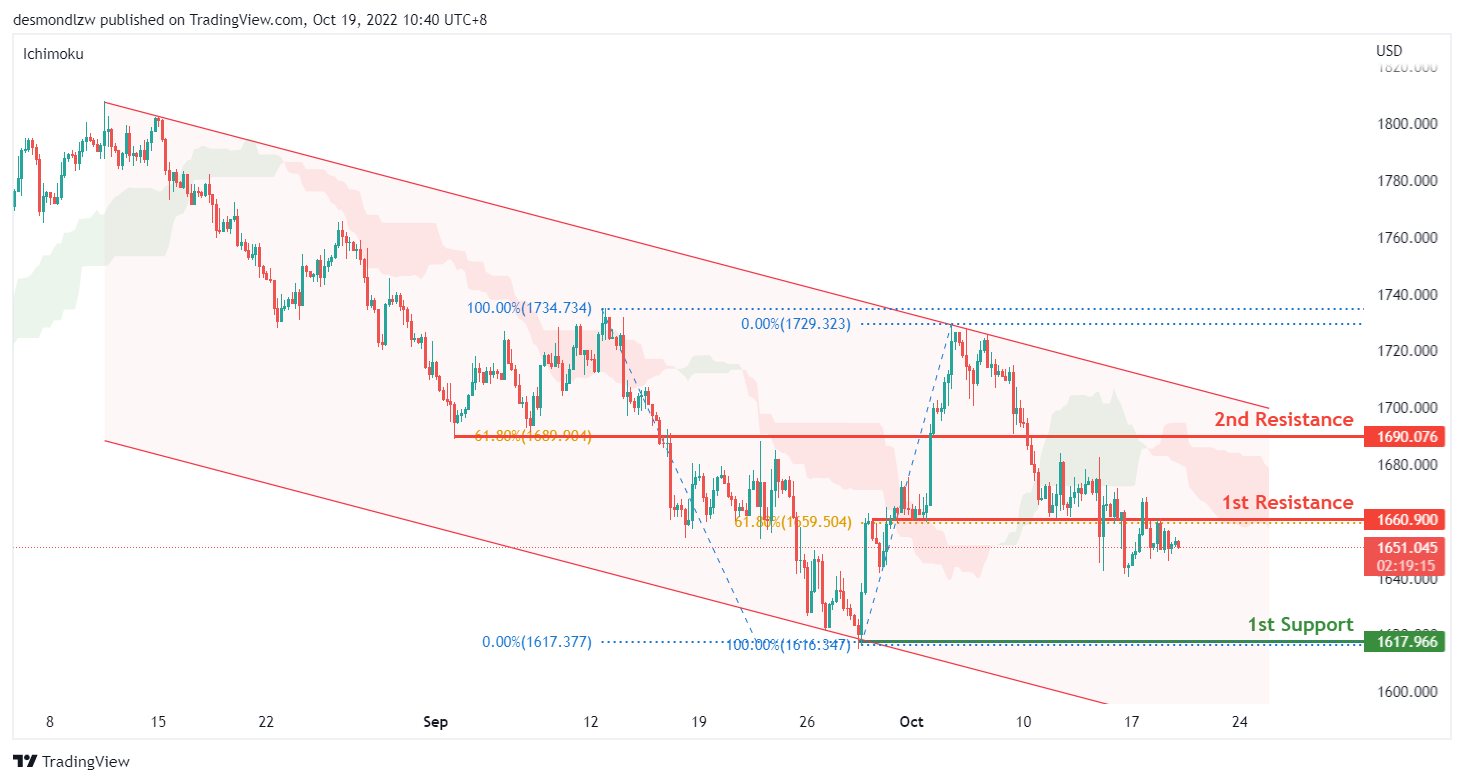
XAU/USD (GOLD):
On the H4, price continues to trade below the 1st resistance at 1660.90 which is in line with the 61.8% fibonacci retracement and overlap support. As the price is still within the descending channel, we could expect the price to reverse from the 1st resistance to drop to the 1st support 1617.96, where the previous swing low is. Alternatively, the price may break through the 1st resistance and rise to test the 2nd resistance at 1690, where the 61.8% fibonacci retracement and overlap support is.
Areas of consideration:
- H4 time frame, 1st support at 1617.96
- H4 time frame, 1st resistance at 1660.90
- H4 time frame, 2nd resistance at 1690
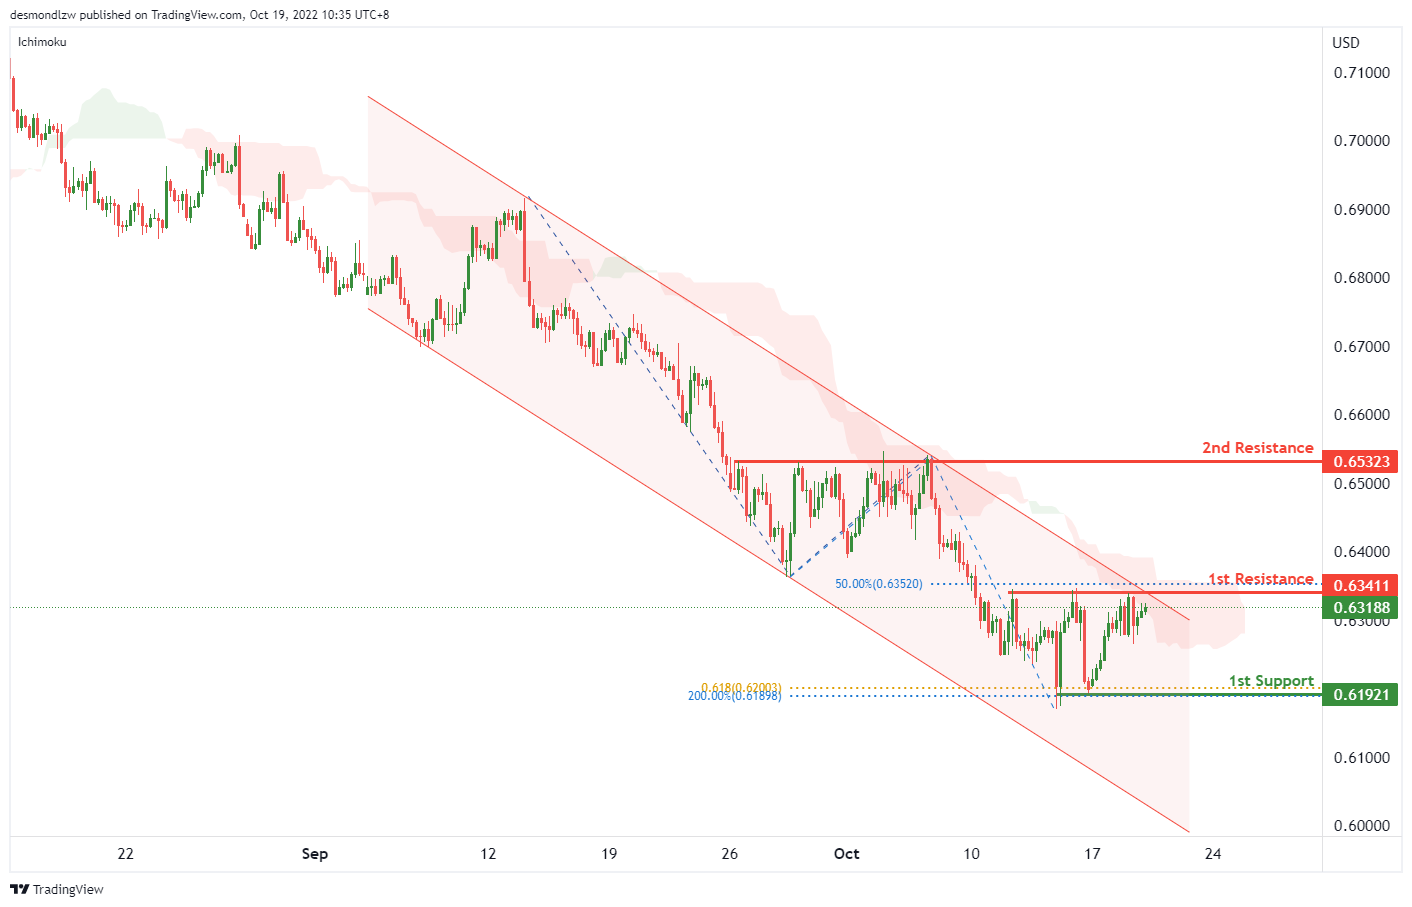
AUD/USD:
On the H4, the price is reversing from 1st support, with the price is below the descending channel and ichimoku cloud, we can expect the price test the 1st resistance at 0.63411, which is in line with the 23.6% fibonacci retracement and 50% fibonacci retracement. If the 1st resistance is broken, as the descending channel and ichimoku cloud are both broken, we can expect the bullish momentum to carry the price to the 2nd resistance at 0.65323, which is in line with the overlap resistance. Alternatively, the price may drop to the 1st support at 0.61921, where the previous swing low, 61.8% fibonacci projection and 200% fibonacci extension are.
Areas of consideration
- H4, 1st resistance at 0.63411
- H4, 2nd resistance at 0.65323
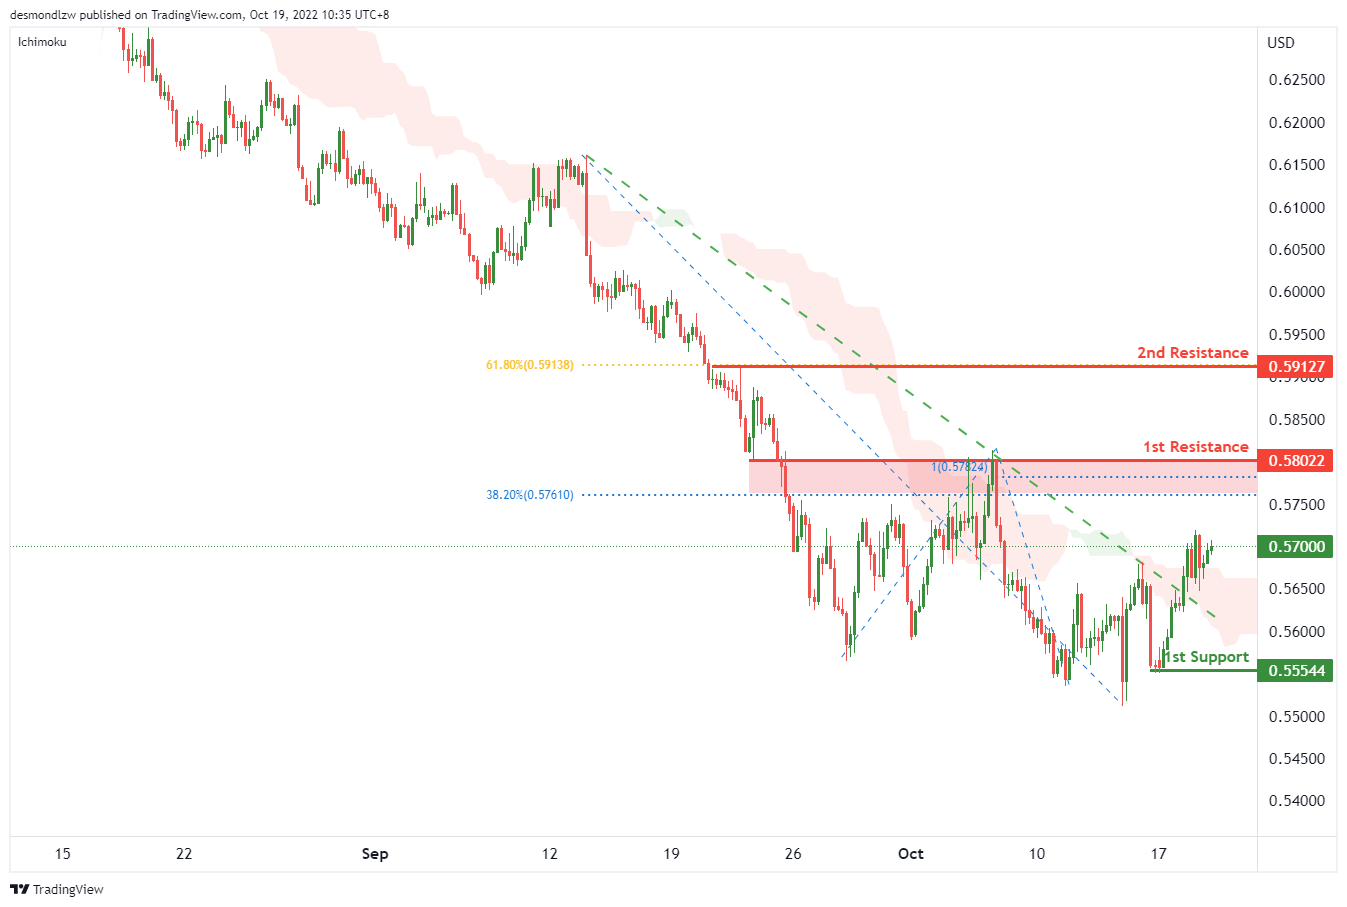
NZD/USD:
On the H4, the price is breaking the ichimoku cloud and descending trendline, we can expect the price to rise to the 1st resistance at 0.58022, where the previous swing high, 100% fibonacci projection and 38.2% fibonacci retracement are. If the price can break the 1st resistance, we can expect the price rise to the 2nd resistance at 0.59127, where the 61.8% fibonacci retracement is. Alternatively, the price may drop to the 1st support at 0.55544, where the swing low support is.
Areas of consideration:
- H4 time frame, 1st resistance at 0.58022
- H4 time frame, 2nd resistance at 0.59127
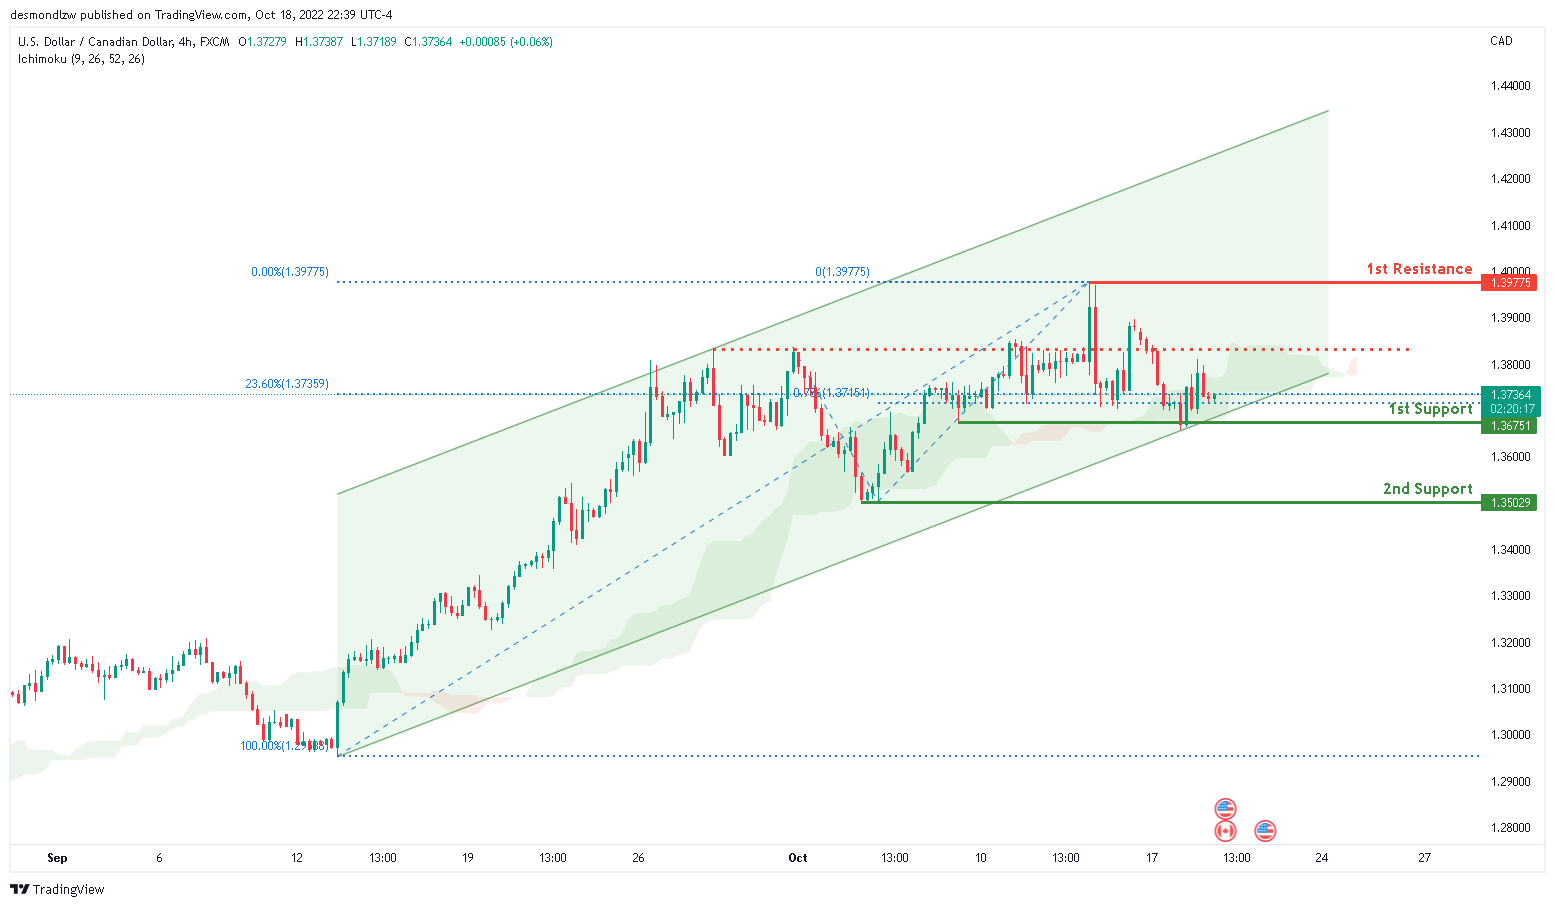
USD/CAD:
On the H4 chart, the overall bias for USDCAD is bullish. To add confluence to this, price is above the Ichimoku cloud which indicates a bullish market. Overnight, price has reflected off the 1st support line at 1.36751 where the 23.6% Fibonacci line and 78.6% Fibonacci projection line is. If this bullish momentum continues, expect price to head towards the 1st resistance at 1.3967 where the high is located.
Areas of consideration:
- H4 time frame, 1st resistance at 1.3967
- H4 time frame, 1st support at 1.36751
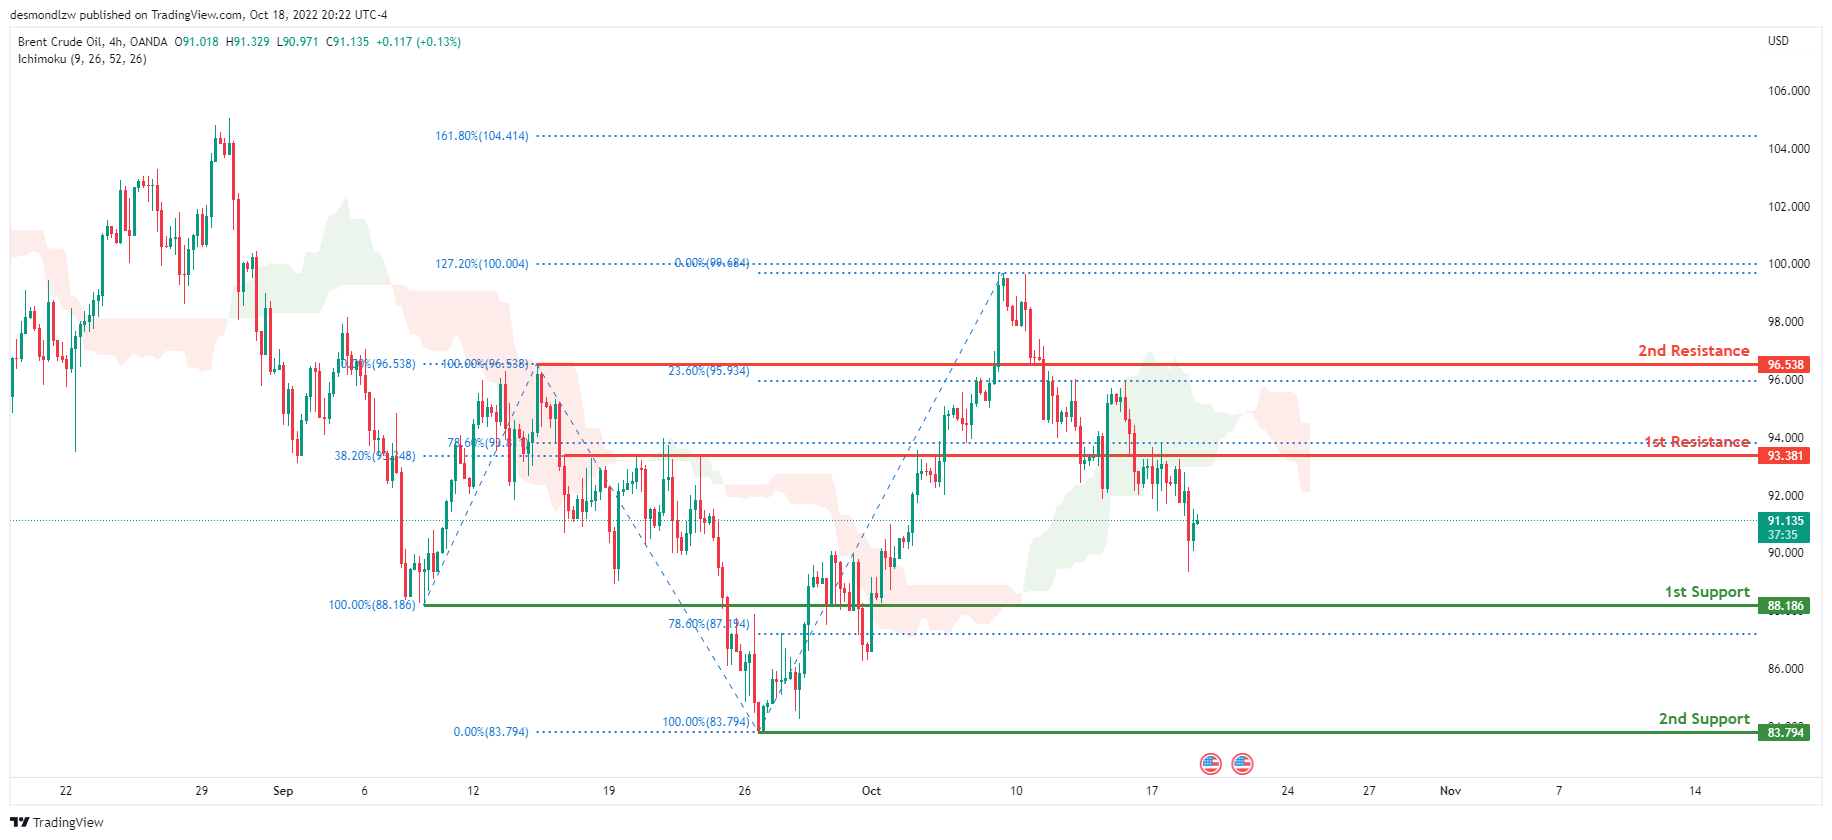
OIL:
Looking at the H4 chart, the current overall bias for Oil is bearish. To add confluence to this bias, the price is currently below the Ichimoku cloud which indicates a bearish market. Overnight, price continued its bearish momentum downwards. If this bearish momentum continues, expect the price to head towards the 1st support at 88.186 where the 100% Fibonacci line and 78.6% Fibonacci line are located.
Areas of consideration:
- H4 time frame, 1st resistance at 93.381
- H4 time frame, 1st support at 88.186
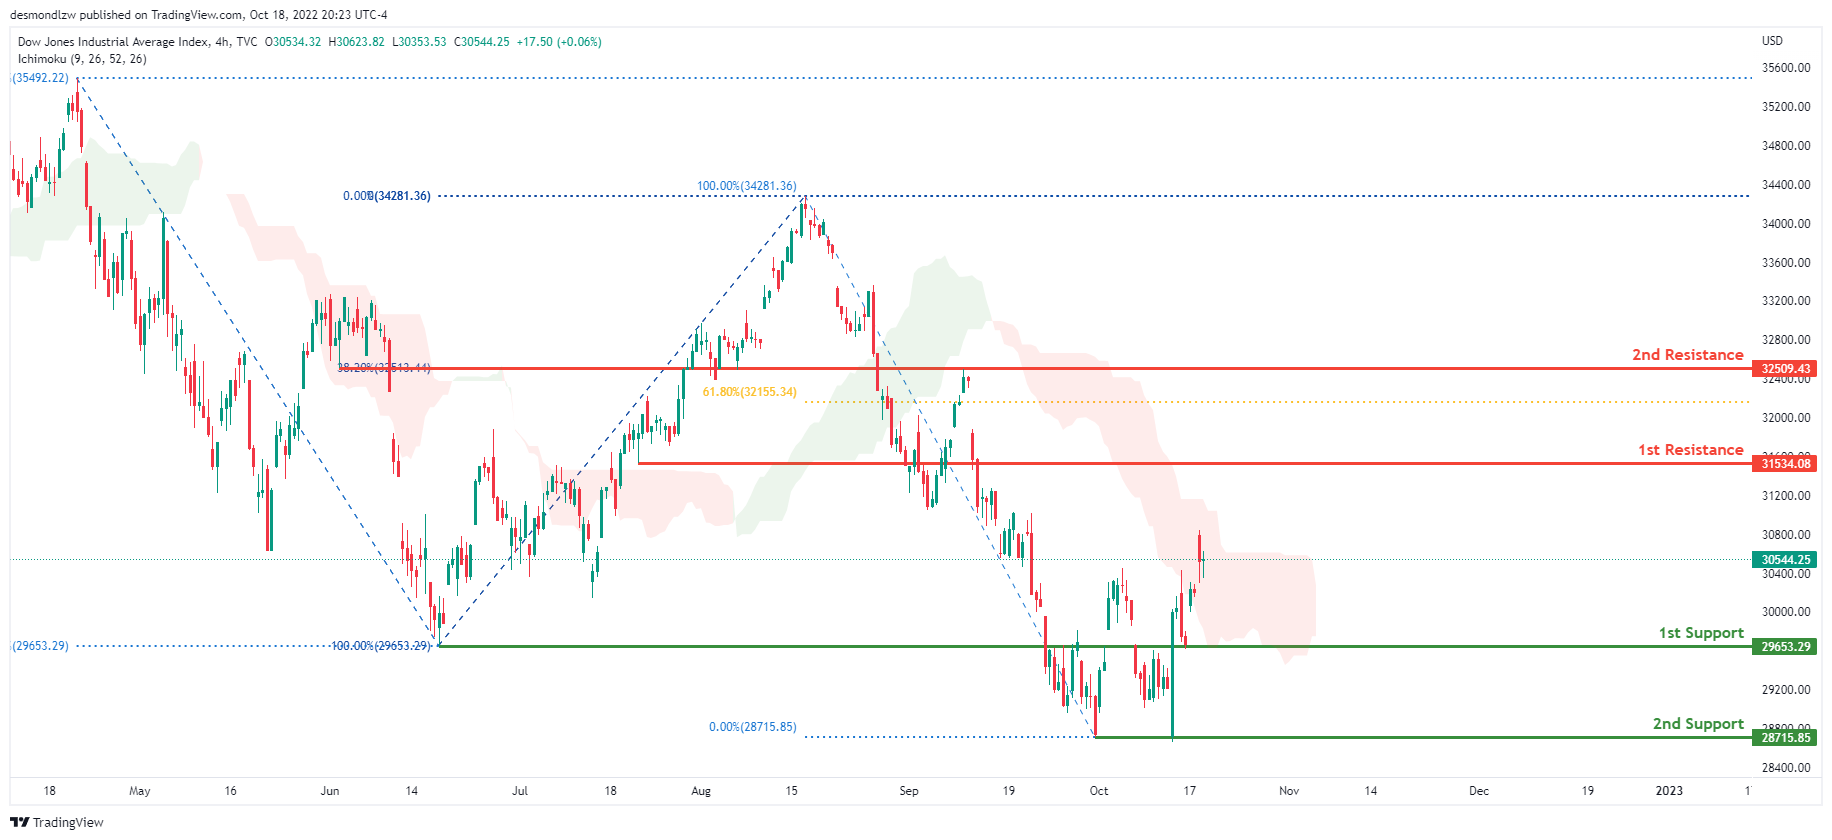
Dow Jones Industrial Average:
The current overall bias for DJI is bearish, according to the H4 chart. Overnight, price continued its bullish momentum upwards. If this short term bullish momentum continues, expect the price to possibly head towards the 1st resistance at 30982.97 where the 38.2% Fibonacci line is located.
Areas of consideration:
- H4 time frame, 1st support at 29653.29
- H4 time frame, 2nd support at 28715.85
- H4 time frame, 1st Resistance at 30982.97
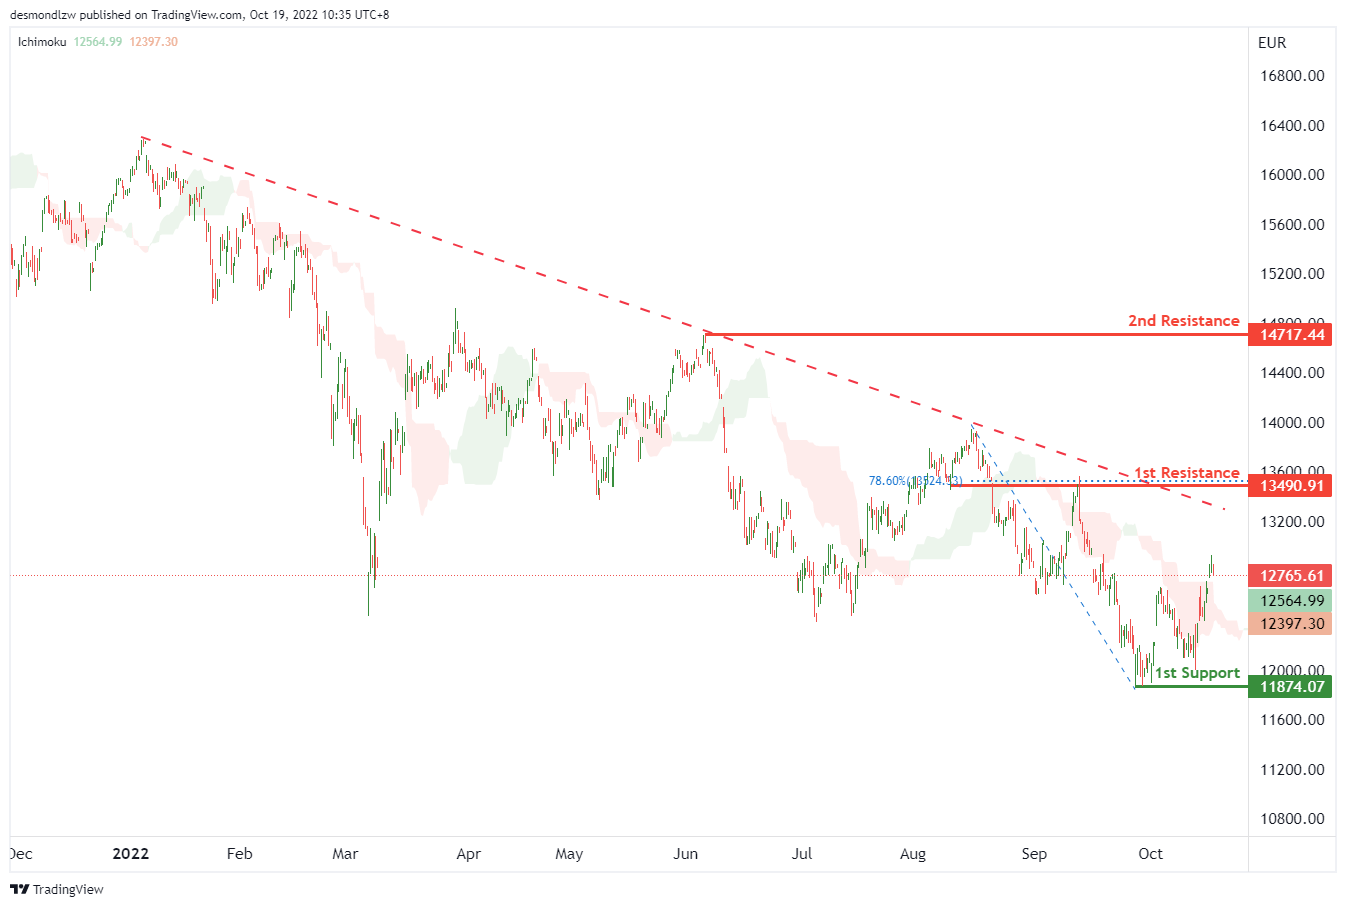
DAX:
On the H4, as the price is crossing the ichimoku cloud, we can expect the price to break the 1st resistance at 13490.91, where the overlap resistance and 78.6% fibonacci retracement are. If the 1st resistance is broken, the 2nd resistance is at 14717.44, which is in line with the previous swing high. Alternatively, as the price is below the descending trendline, the price may drop to the 1st support at 11874.07, which is in line with the swing low.
Areas of consideration:
- H4 time frame, current price
- H4 time frame, 1st resistance at 12668.06
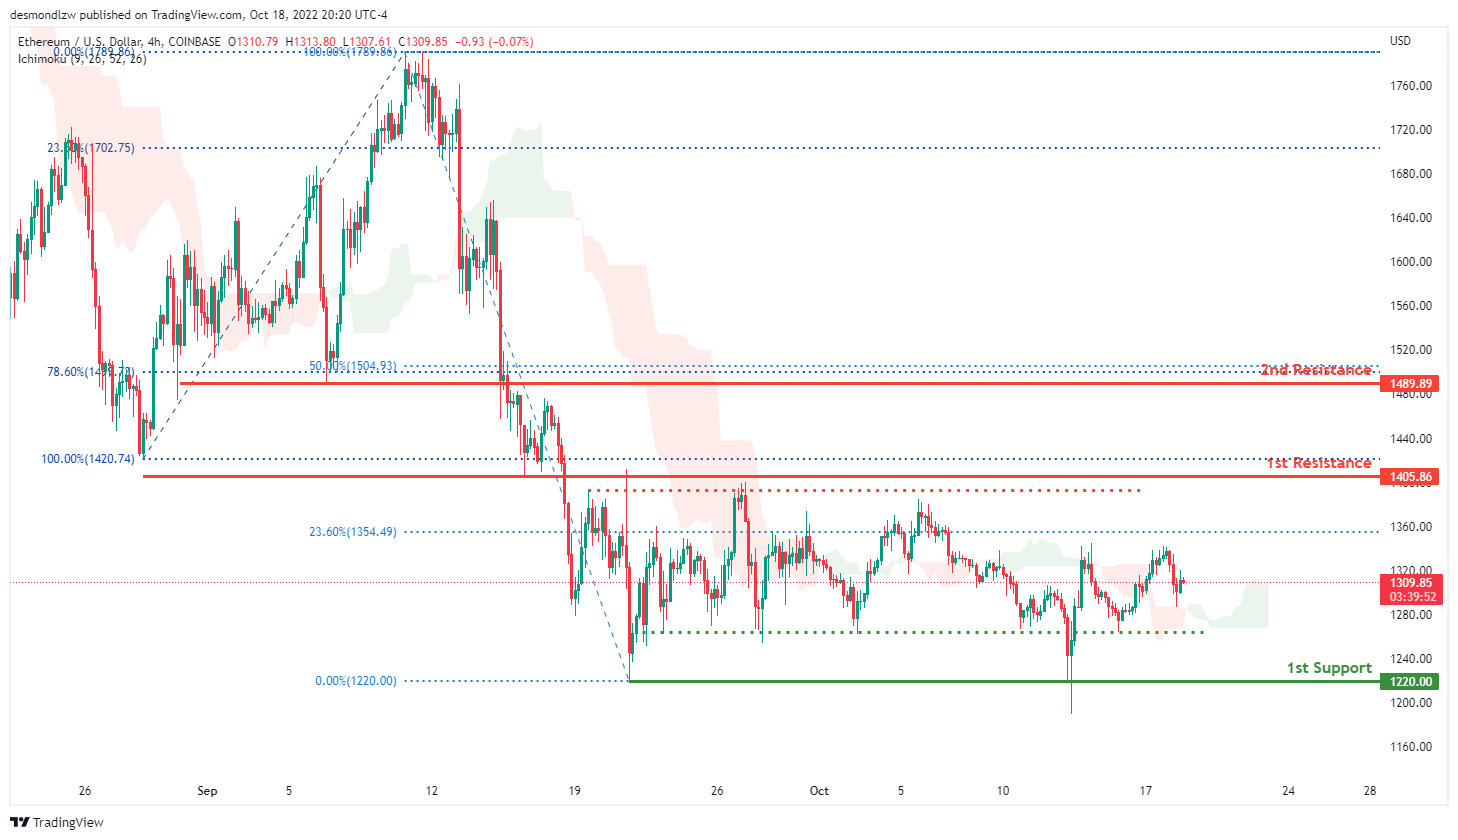
ETHUSD:
Looking at the H4 chart, the current overall bias for ETHUSD is bearish. However overnight, price has closed above the Ichimoku cloud which might indicate a short term bullish momentum. For the past 1 month, price has been consolidating between the 1st resistance at 1405.86 and 1st support at 1405.86. Expecting price to continue consolidating in this area with no clear signs of direction.
Areas of consideration:
- H4 time frame, 1st resistance of 1405.86
- H4 time frame, 1st support at 1220.00
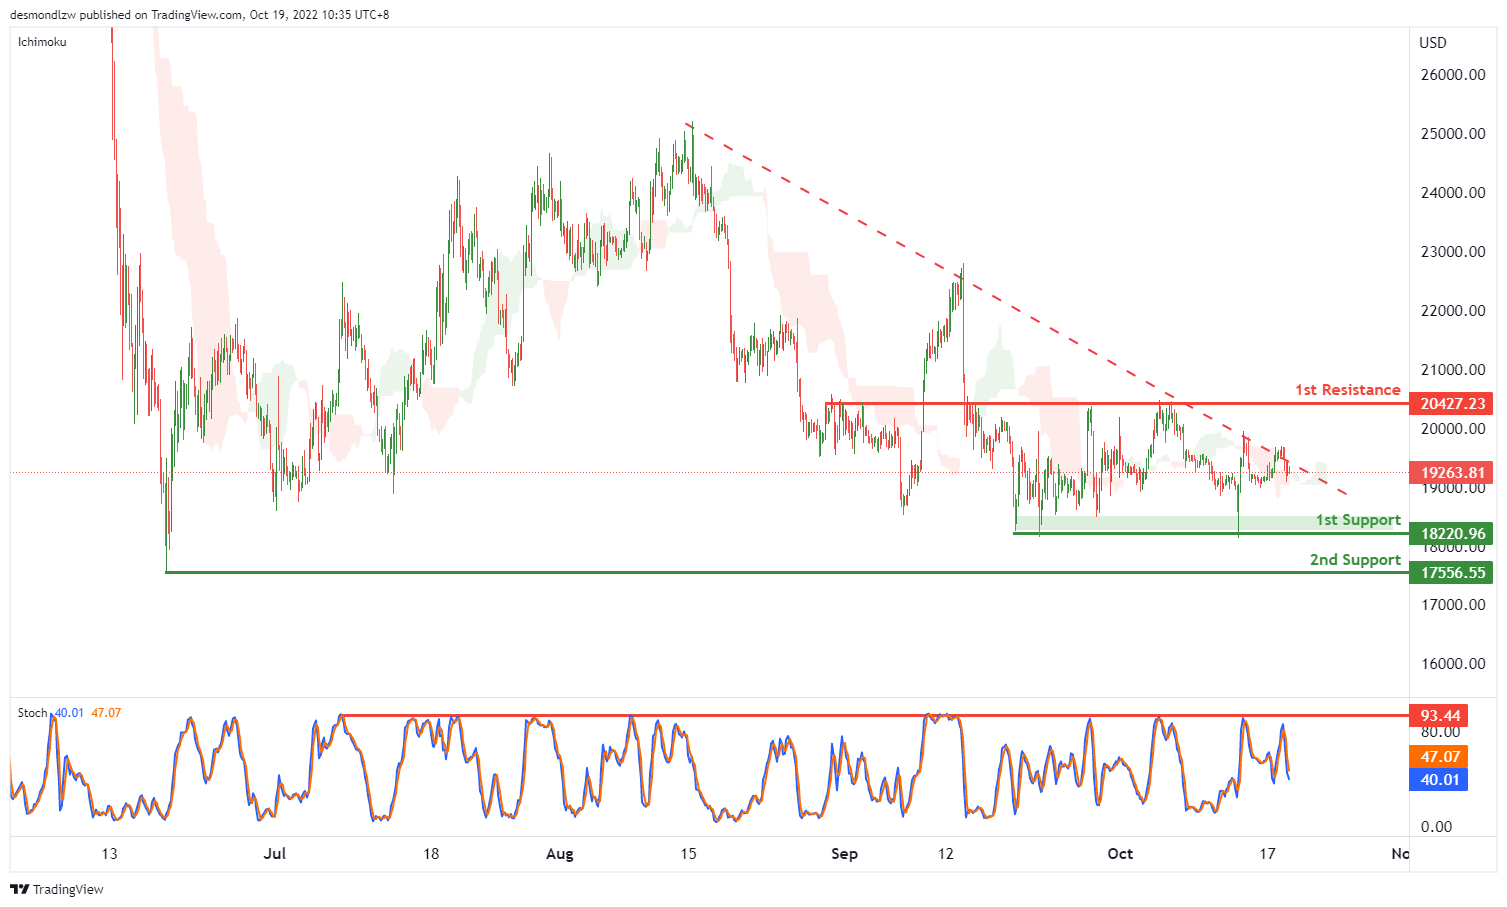
BTCUSD:
On the H4, price is crossing ichimoku cloud, and Stoch is dropping from the resistance, we have a bearish bias that the price may drop to the 1st support at 18220.96, which is in line with the previous swing lows and if the 1st support is broken, the 2nd support is at 17556.55, where the previous swing low is. Alternatively, the price may rise to the 1st resistance at 20427.23, where the overlap resistance and 50% fibonacci retracement are.
Areas of consideration:
- H4 time frame, current price
- H4 time frame, 1st support at 18220.96
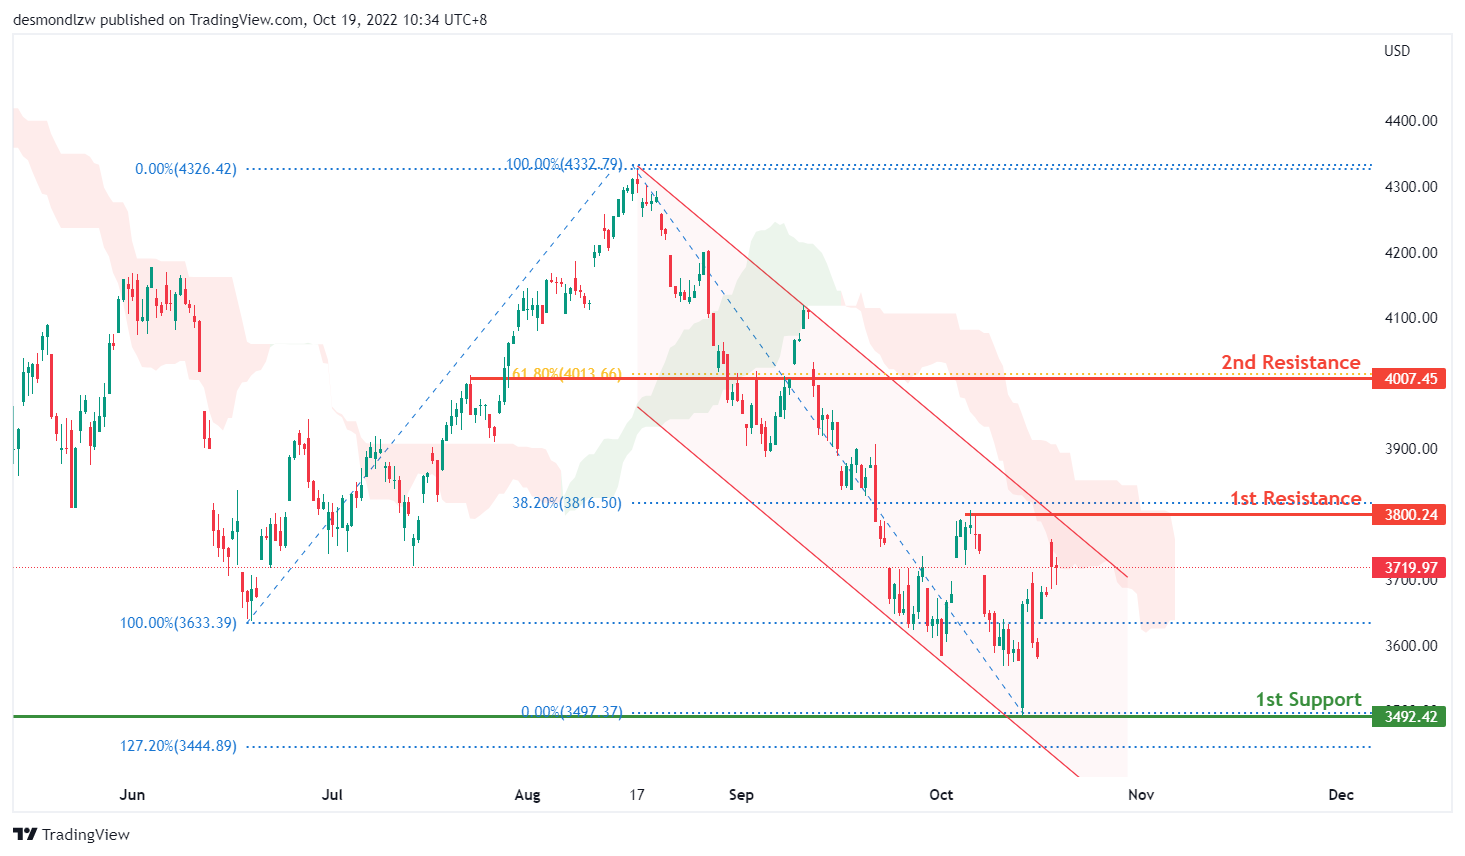
S&P 500:
Based on the H4 chart, the S&P500 is still within the bearish channel and approaching the 1st resistance of 3800, which is in line with the 38.2% fibonacci retracement level and previous swing high. However, we have a short term bullish bias that price could break above the resistance level, and climb higher towards the 2nd resistance of 4007 which is in line with the 61.8% fibonacci retracement level.
Areas of consideration:
- H4 time frame, 1st support at 3492.42
- H4 time frame, 1st resistance at 3800
- H4 time frame, 2nd resistance at 4007.45


