
USD/JPY:
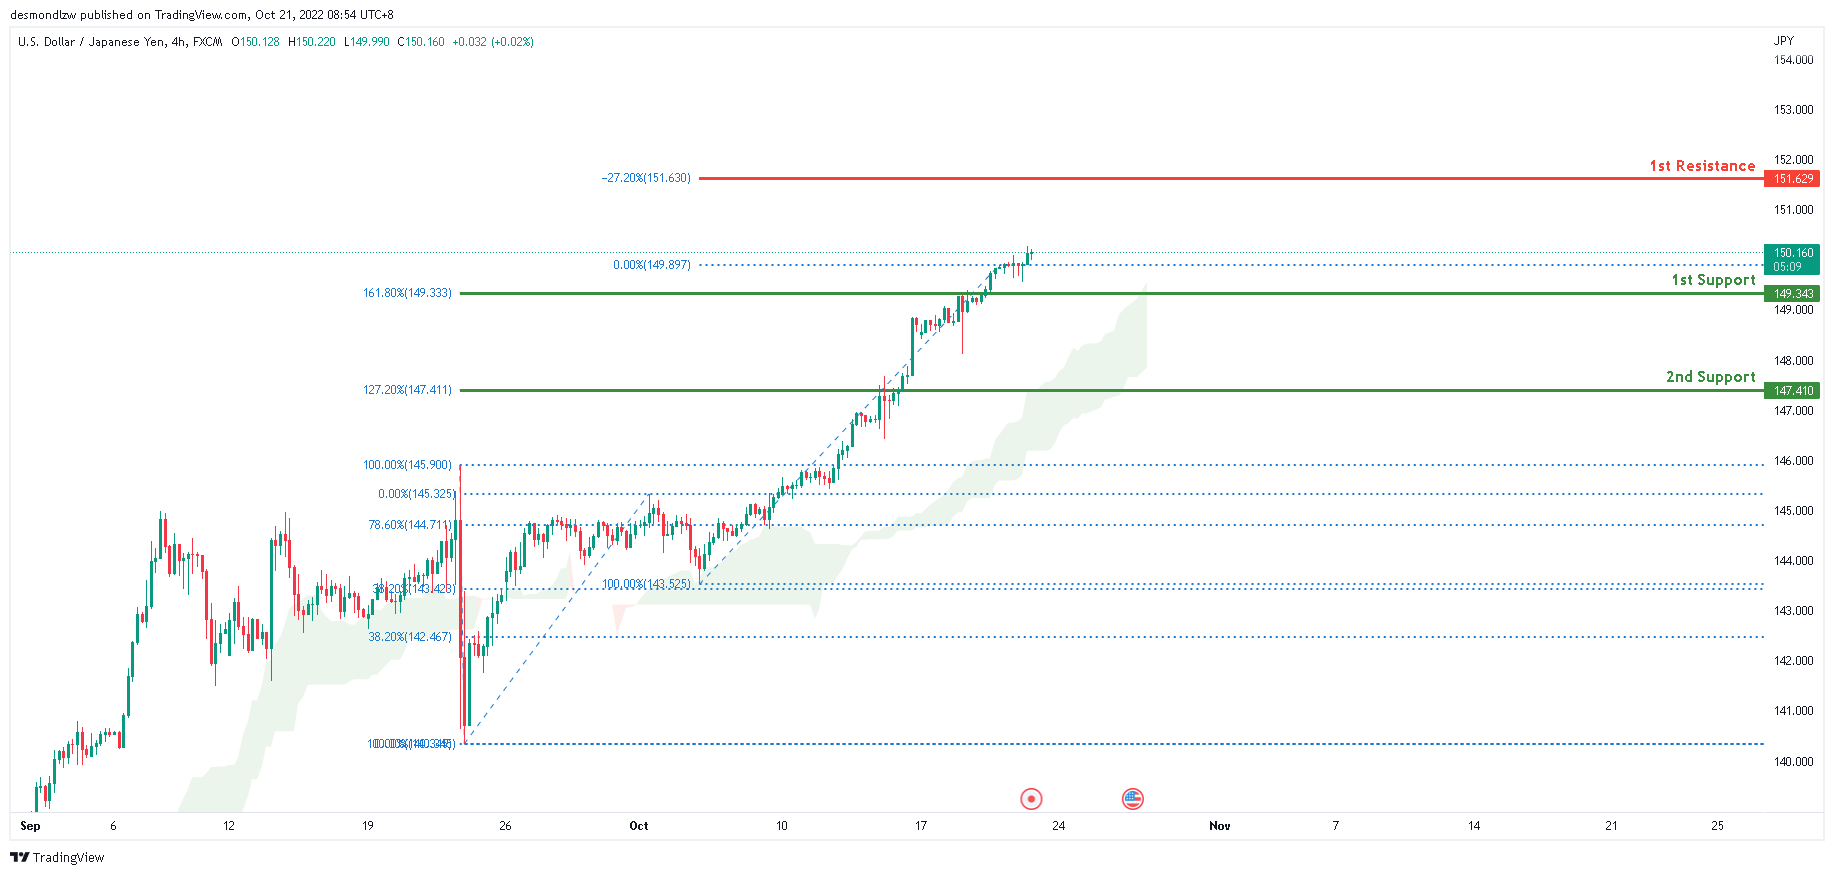
The current general bias for USDJPY on the H4 chart is bullish. To add to this bias, the price is currently trading above the Ichimoku cloud, indicating a bullish market. Price has maintained its strong bullish momentum and crossed the key level at 150.00 with price currently above the 1st support at 149.313 where the 161.8% Fibonacci extension is located. If this strong bullish momentum continues, expect price to continue towards the 1st resistance at 151.629 where the -27.2% Fibonacci expansion is located.
Areas of consideration:
- H4 time frame, 1st resistance at 151.629
- H4 time frame, 1st support at 149.313
DXY:
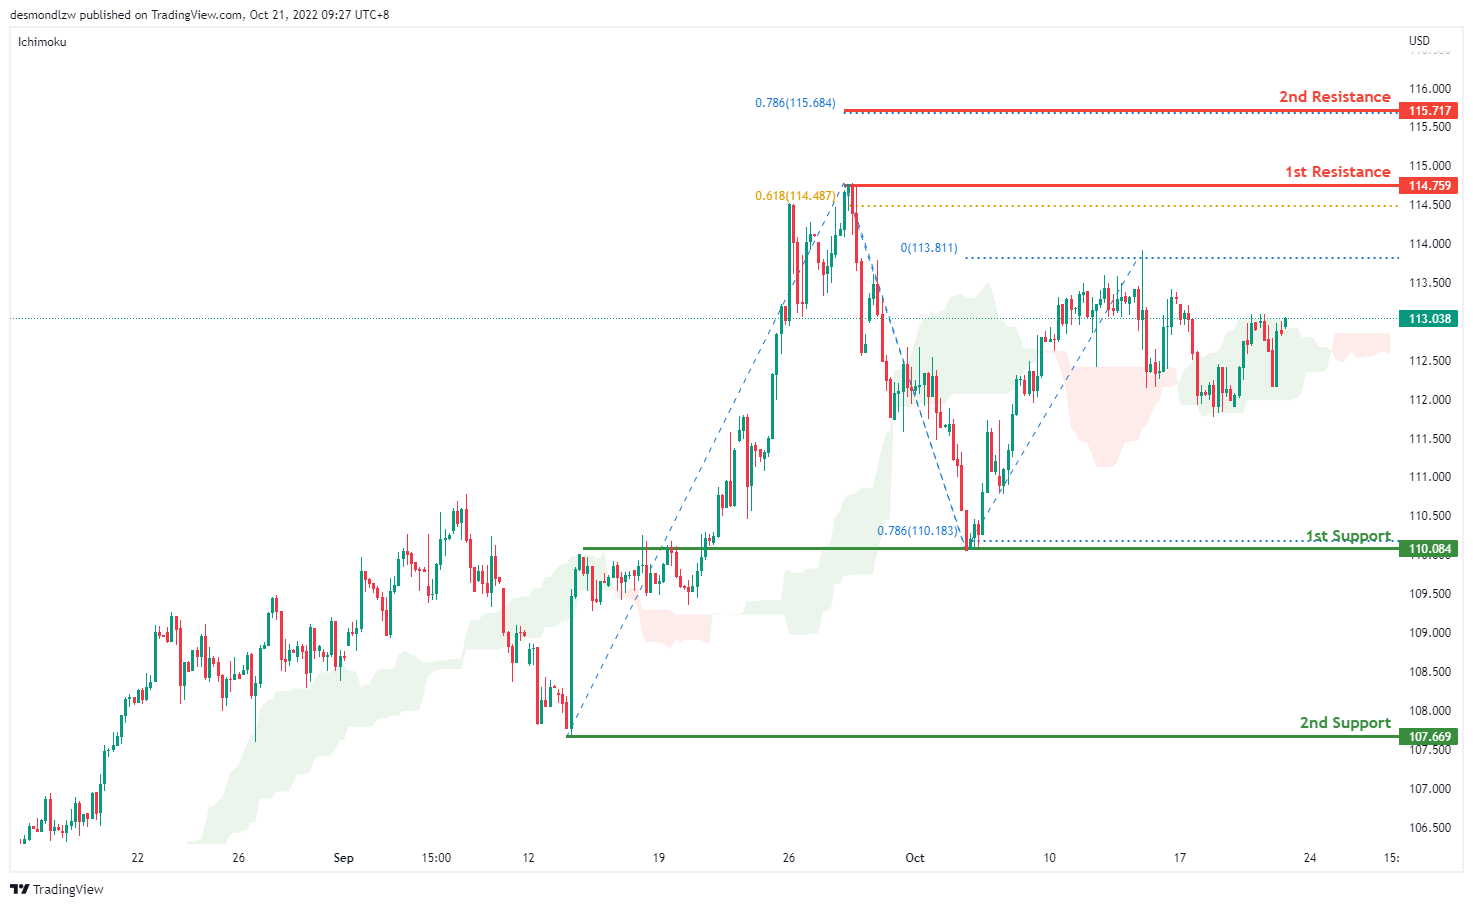
On the H4 chart, prices failed to break the ichimoku cloud and are moving in an ascending trend signalling bullish momentum. if bullish momentum continues it will bring price to 114.759 and if it breaks this level, bullish momentum will carry price to 115.717 where the 78.6% projection. Alternatively prices can move towards the first support at 110.084 where the swing low sits. if it breaks this level, bearish momentum will bring price to second support at 107.669.
Areas of consideration:
- H4 time frame, 1st resistance at 114.759
- H4 time frame, 1st support at 110.084
EUR/USD:
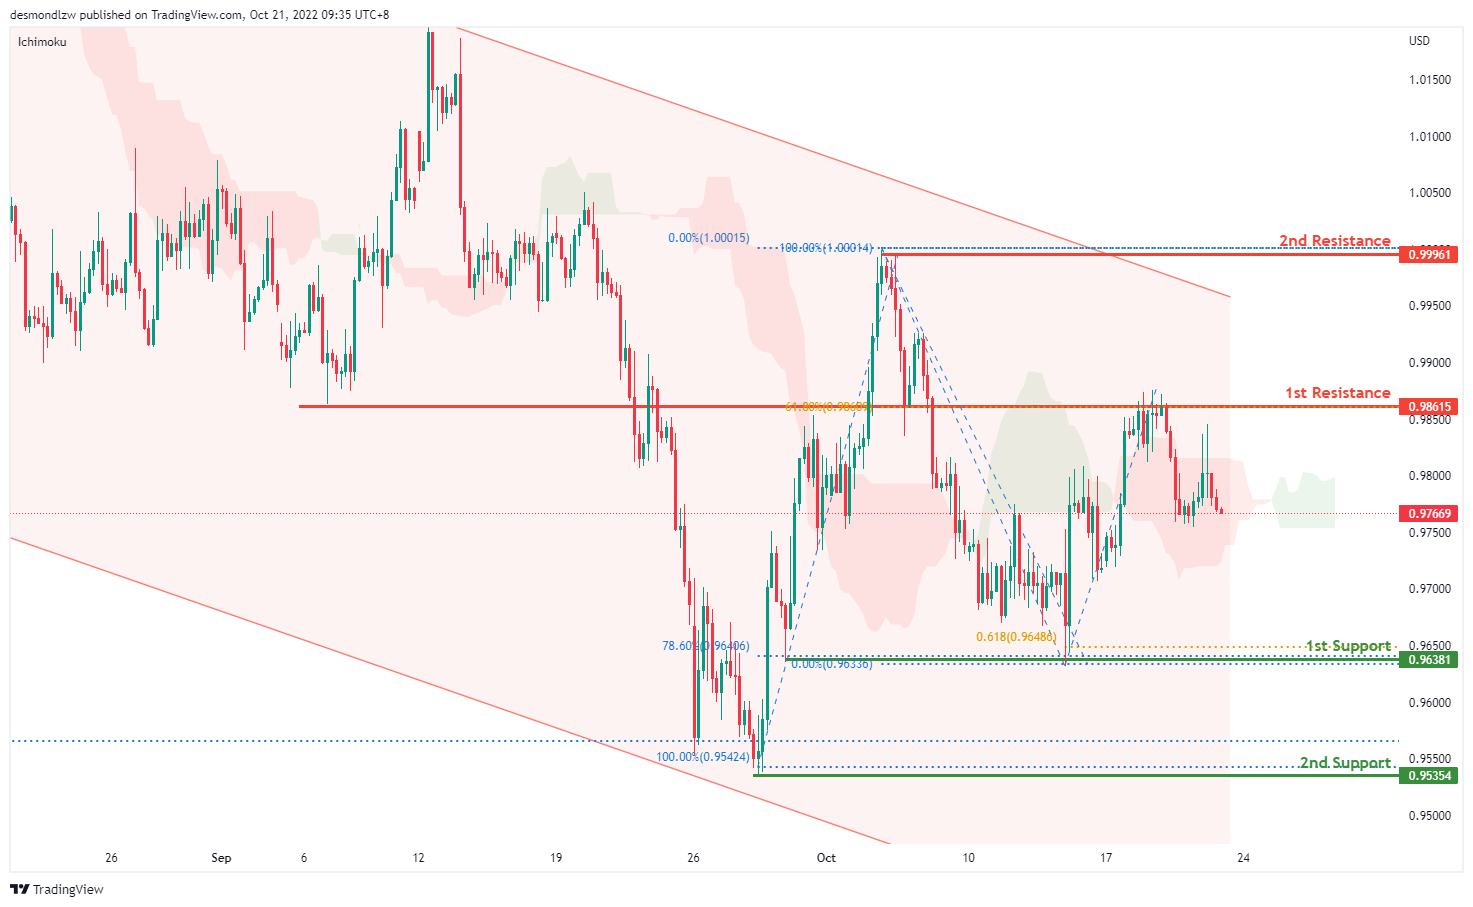
On the H4, price is moving within the descending trendline in a descending manner, with the price moving below ichimoku cloud- we are still overall bearish biased. Price has pulled back slightly and it looks like bearish momentum might bring price to 0.9695 where the 78.6% retracement sits. if it breaks this level, price would test the second support at 0.9535 where the swing low and 161.8% extension sit. Alternatively, price might test the first resistance at 0.9861 w here the 78.6% retracement sits. If price breaks this level, it may test the second resistance at 0.9996, where the previous swing high sits.
Areas of consideration :
- H4 1st resistance at 0.9861
- H4 2nd resistance at 0.9996
GBP/USD:
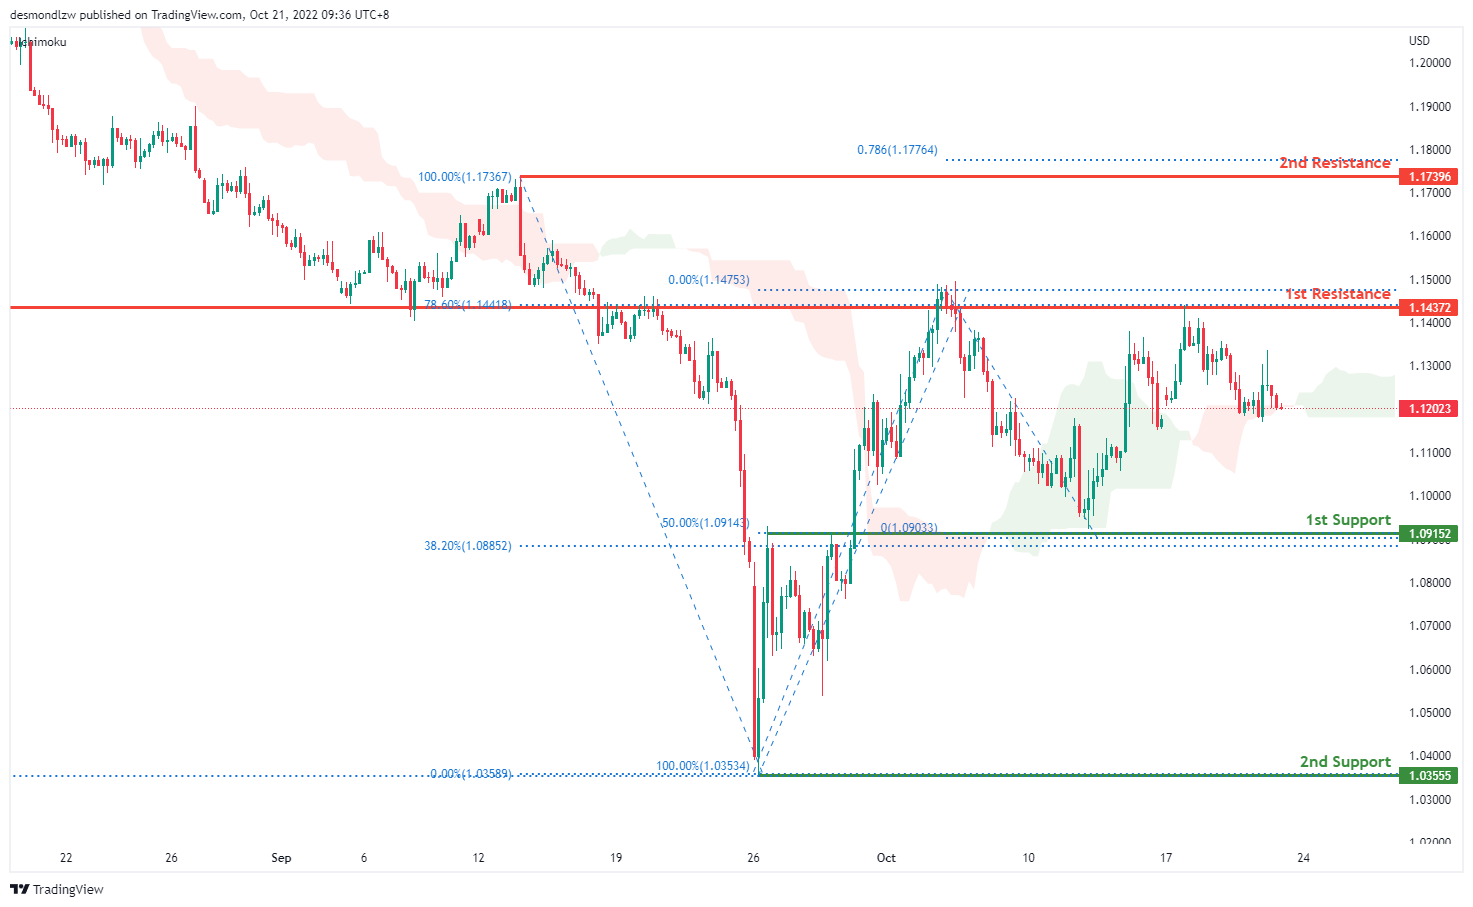
On the H4, price has rejected the resistance and is moving in a descending trend hence we are slightly bearish bias- price looks like its moving toward the first support at 1.0915 where the 50% retracement sits, bearish momentum will bring price to the second support at 1.0355 where the previous swing low sits. Alternatively, price could test the first resistance at 1.1437 where the 78.6% retracement and overlap resistance sit. If it breaks this level, it should test the second resistance at 1.1739.
Areas of consideration:
- H4 1st support at 1.0915
- H4 1st resistance at 1.1437
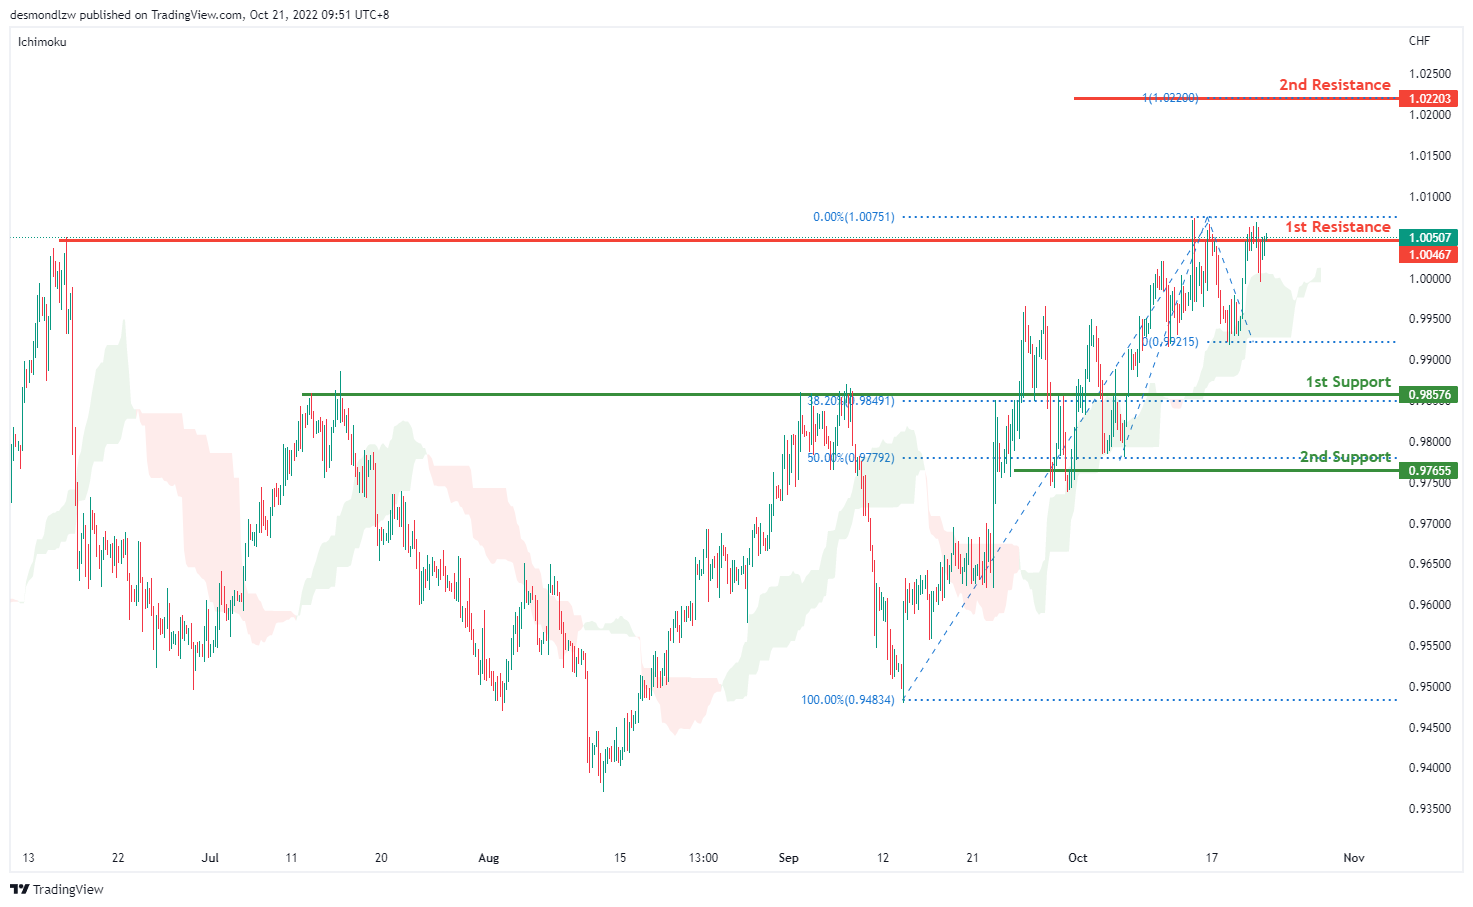
USD/CHF:
USDCHF is in a strong bullish trend on the H4 chart. Price is trading above the Ichimoku cloud signalling a bullish trend. Price is testing the first resistance at 1.0050 where the previous swing high sits. Bullish momentum could potentially drive prices up to 1.0220. Alternatively, bearish momentum could bring price to test the first support at 0.9857 where the overlap support and 38.2% retracement sits then the second support at 0.9766 where the 50% retracement sits
Areas of consideration
- H4 1st support at 0.9857
- H4 1st resistance at 1.0050
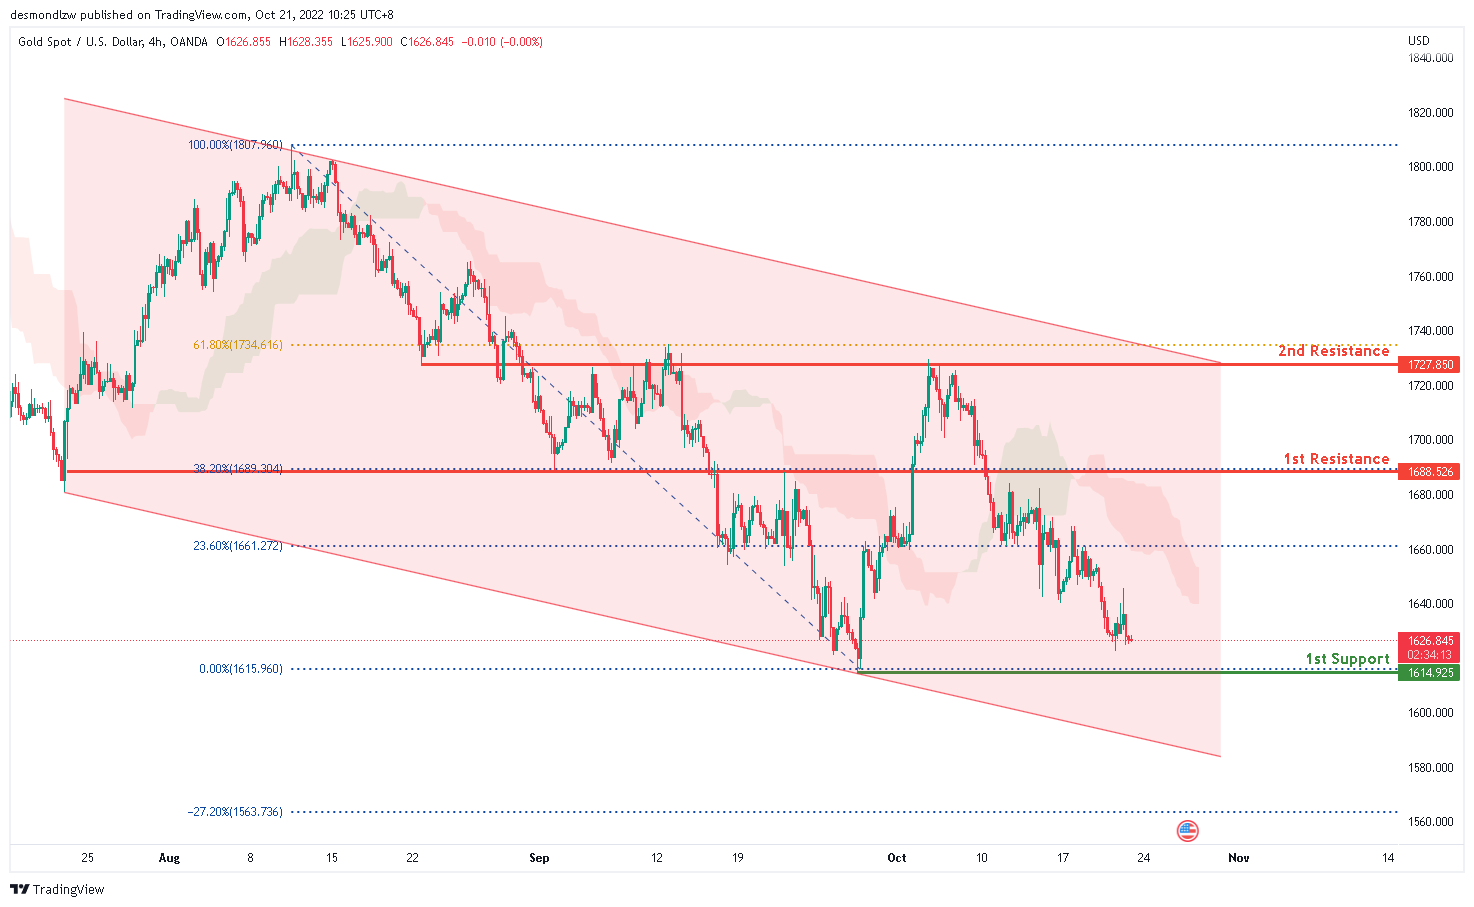
XAU/USD (GOLD):
On the H4 chart, the overall bias for XAUUSDis bearish. To add confluence to this, price is below the Ichimoku cloud which indicates a bearish market. Overnight, price has continued it’s bearish momentum downwards. Expecting price to reach the 1st support at 1614.925 where the previous low and 0% Fibonacci line is located.
Areas of consideration:
- H4 time frame, 1st support at 1614.925
- H4 time frame, 1st resistance at 1688.526
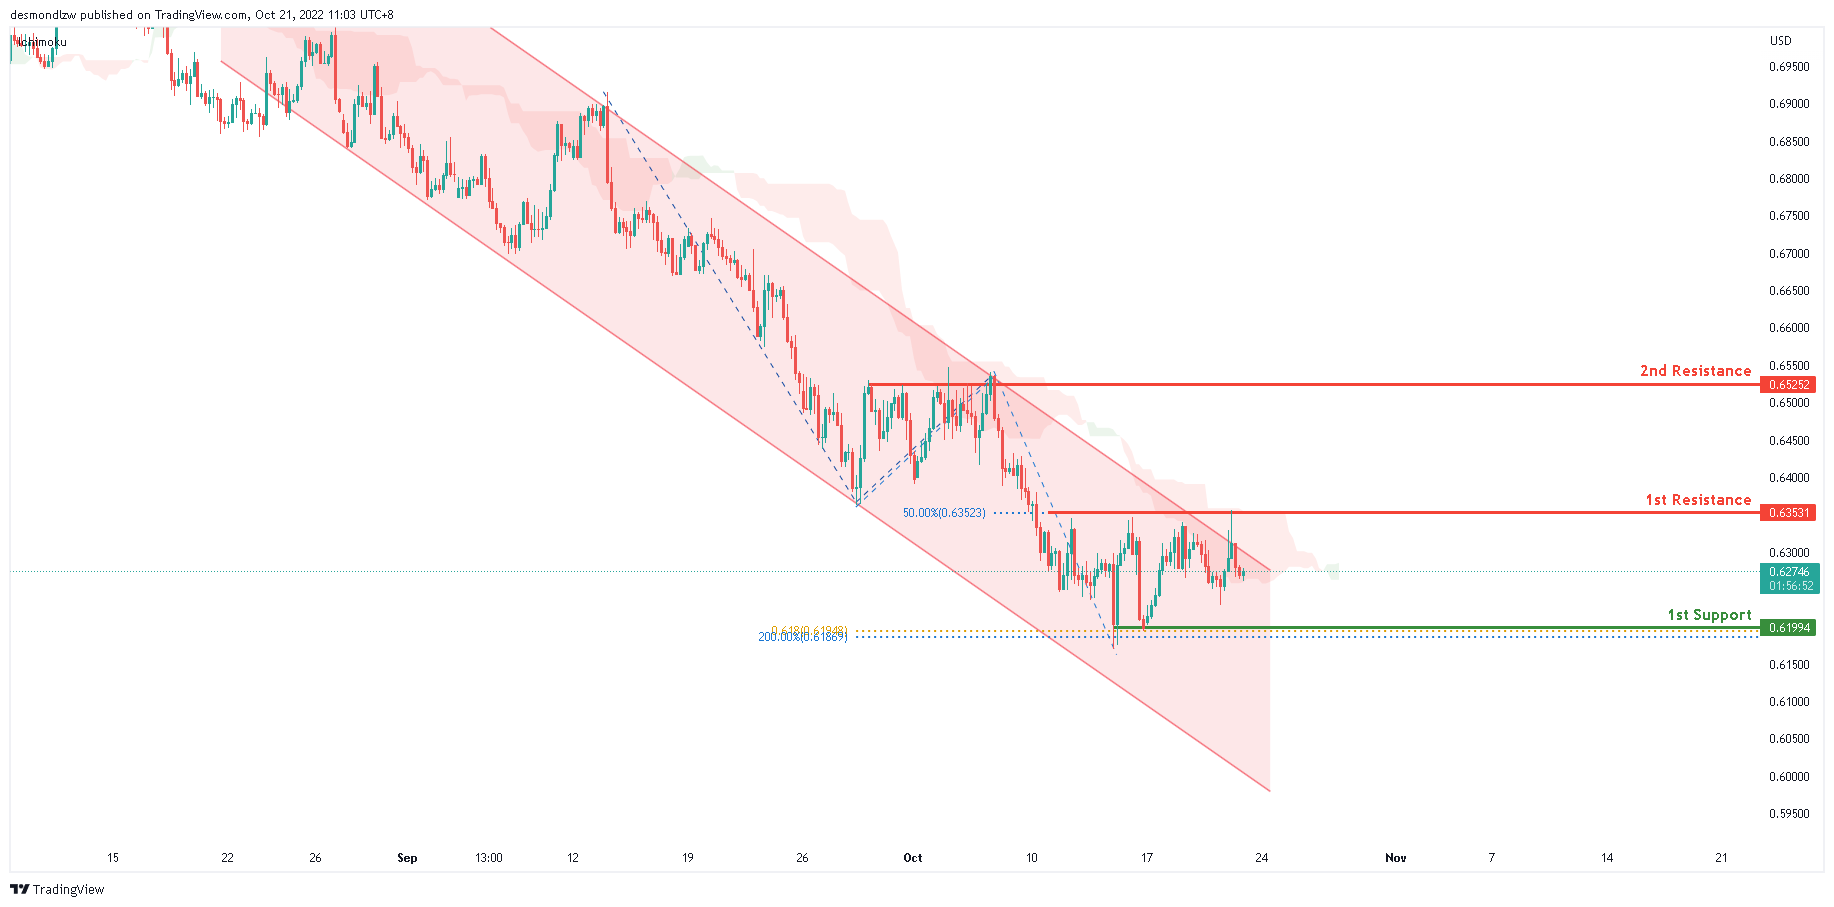
AUD/USD:
On the H4, the price is dropping from the 1st resistance at 0.63411, with the price is below the descending channel and ichimoku cloud. Overnight, price tested the 1st resistance line at 0.63531 where the 50% Fibonacci line is located. We can expect the price test the 1st support at 0.61921, where the previous swing low, 61.8% fibonacci projection and 200% fibonacci extension are.
Areas of consideration
- H4, 1st resistance at 0.63411
- H4, 1st support at 0.61921
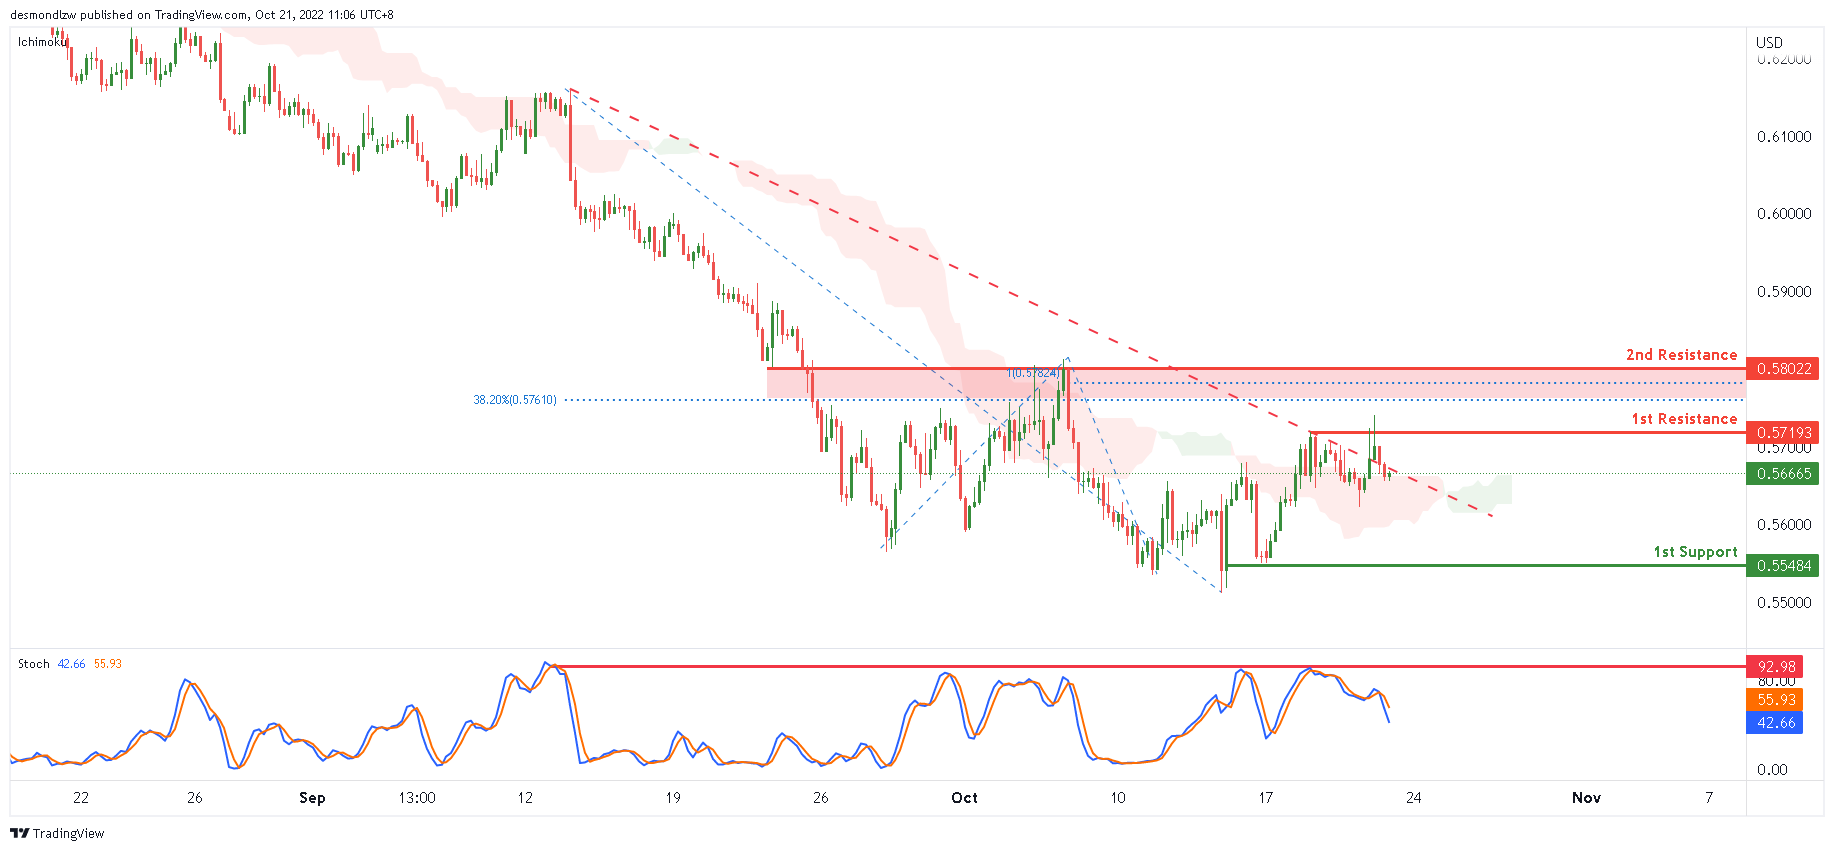
NZD/USD:
On the H4 chart, the overall bias for NZDUSD is bearish. To add confluence to this, price is below the Ichimoku cloud which indicates a bearish market. However, price is above the Ichimoku cloud which might indicate a short term bullish market. Expecting price to possibly break above the 1st resistance at 0.57193 and possibly head towards the 2nd resistance at 0.58022 where the 38.2% Fibonacci line, 100% Fibonacci projection line and previous high are located.
Areas of consideration:
- H4 time frame, 1st resistance at 0.57193
- H4 time frame, 1st support at 0.55484
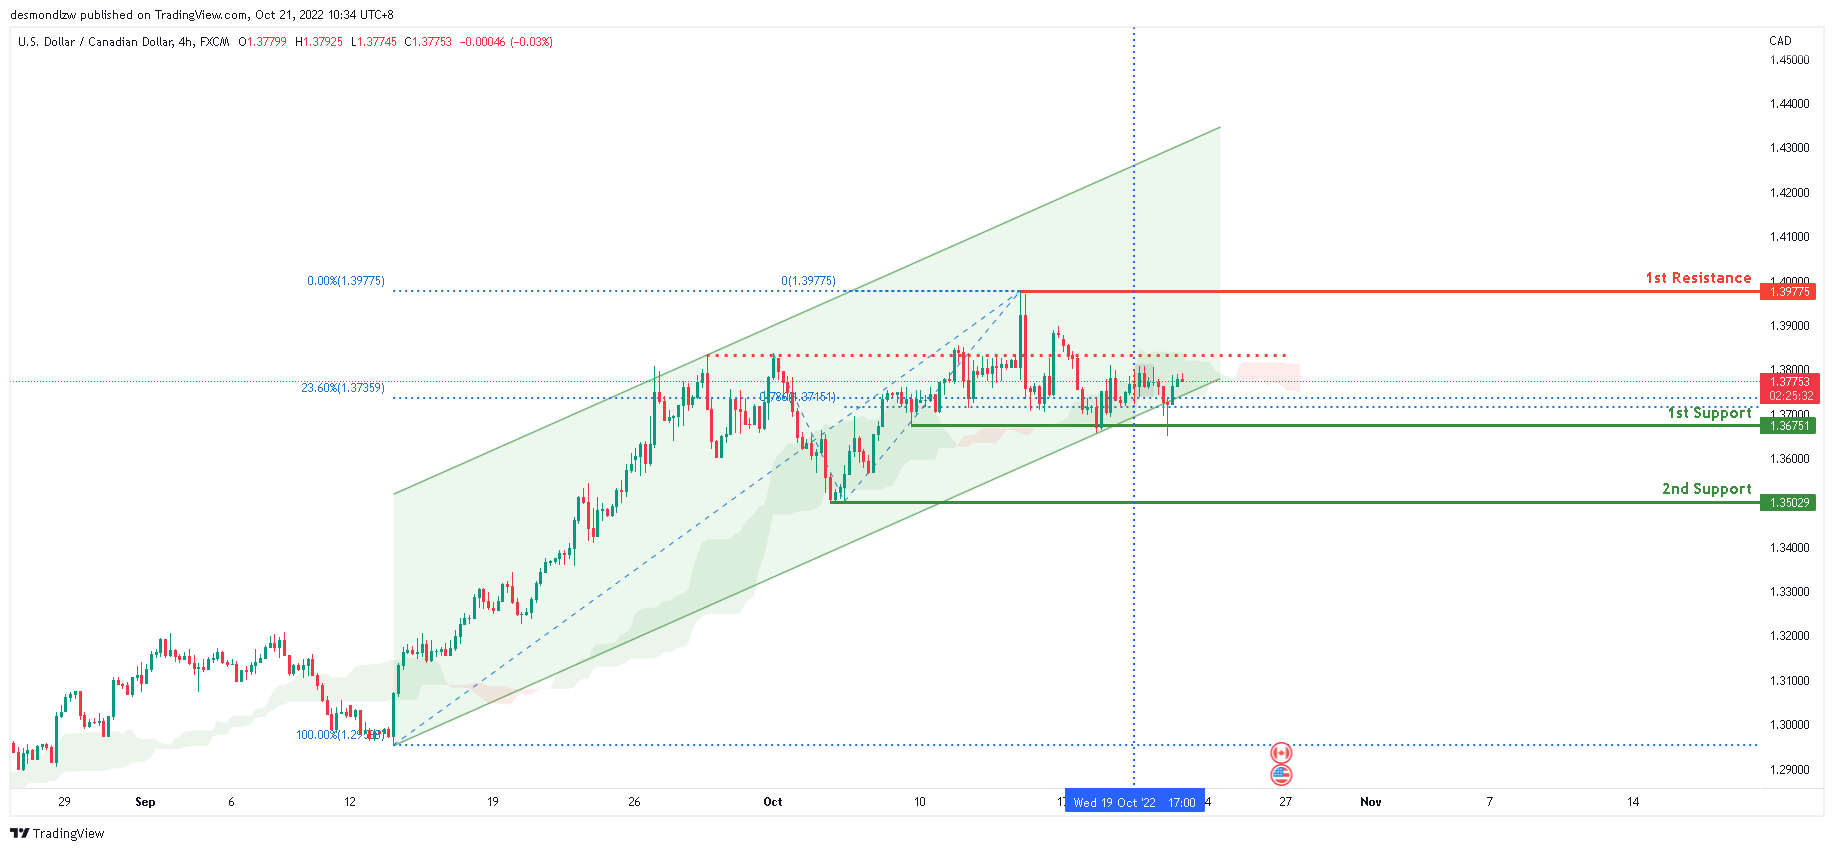
USD/CAD:
The overall bias for USDCAD on the H4 chart is bullish. Price had a weak bearish momentum overnight with price tapping onto the 1st support at 1.36751 where the 23.6% fibonacci line and 78.6% Fibonacci projection line is located.. If the bullish trend continues, price might head towards the first resistance level at 1.3967, where the previous high is located.
Areas of consideration:
- H4 time frame, 1st resistance at 1.3967
- H4 time frame, 1st support at 1.3675
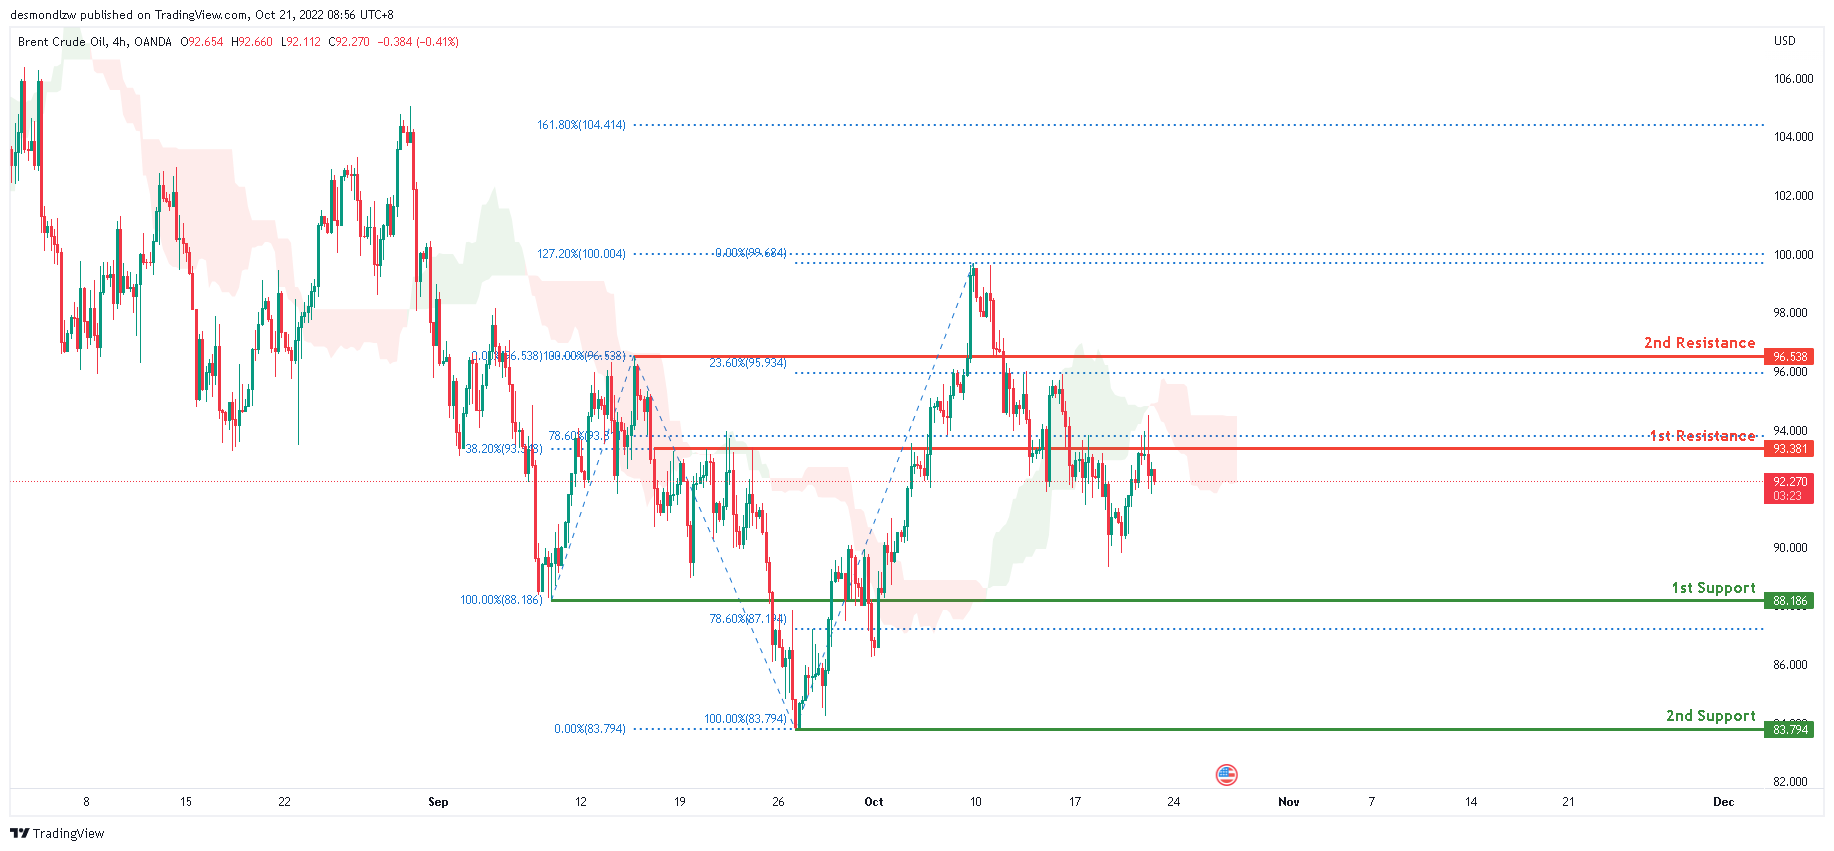
OIL:
Looking at the H4 chart, the current overall bias for Oil is bearish. To add confluence to this bias, the price is currently below the Ichimoku cloud which indicates a bearish market. Overnight, it gained bullish momentum breaking past the 1st resistance line at 93.381 where the 38.2% and 78.6% Fibonacci lines are located before going back underneath it. Expect the price to head towards the 1st support at 88.186 where the 100% and 78.6% Fibonacci lines are located if this bearish momentum continues.
Areas of consideration:
- H4 time frame, 1st resistance at 93.381
- H4 time frame, 1st support at 88.186
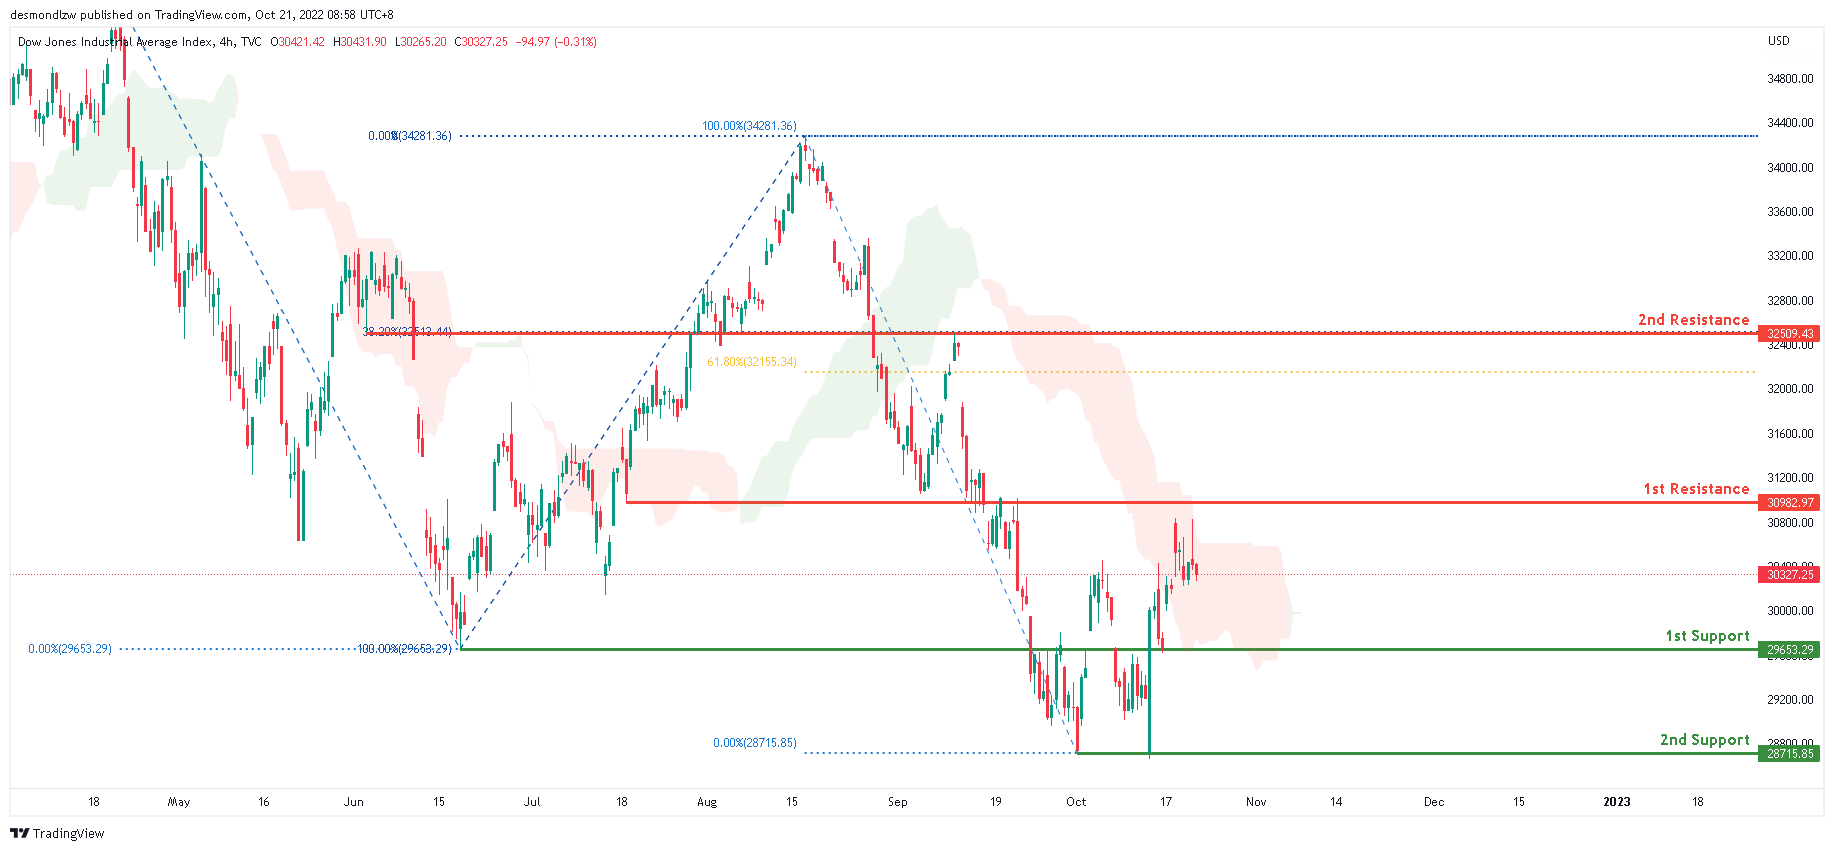
Dow Jones Industrial Average:
According to the H4 chart, DJI now has a bearish overall bias. Price consolidated between 30827 and 30231 overnight. Expect the price to potentially move toward the first resistance at 30982.97, where the 38.2% Fibonacci line is placed, if this short-term bullish momentum persists.
Areas of consideration:
- H4 time frame, 1st support at 29653.29
- H4 time frame, 2nd support at 28715.85
- H4 time frame, 1st Resistance at 30982.97
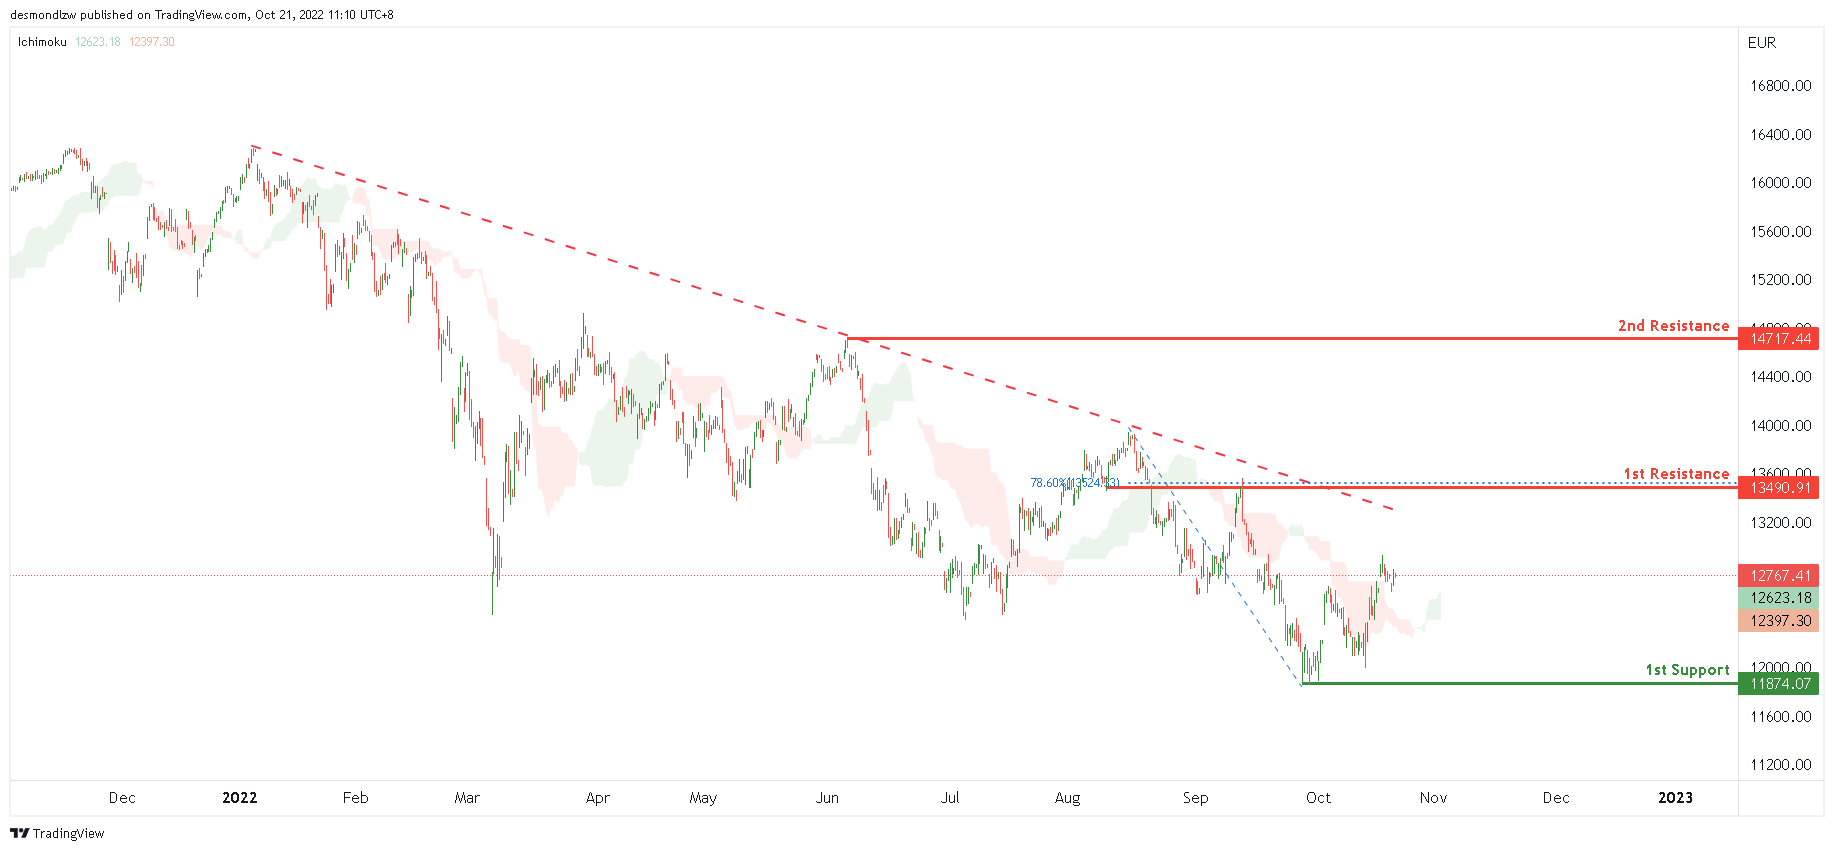
DAX:
On the H4 chart, the overall bias for DAX is bearish. However, price has now closed above the Ichimoku cloud which indicates a change to bullish market momentum. Expecting price to possibly continue this bullish momentum and head towards the 1st resistance at 13490.91, where the 78.6% Fibonacci line is located.
Areas of consideration:
- H4 time frame, current price
- H4 time frame, 1st resistance at 12668.06
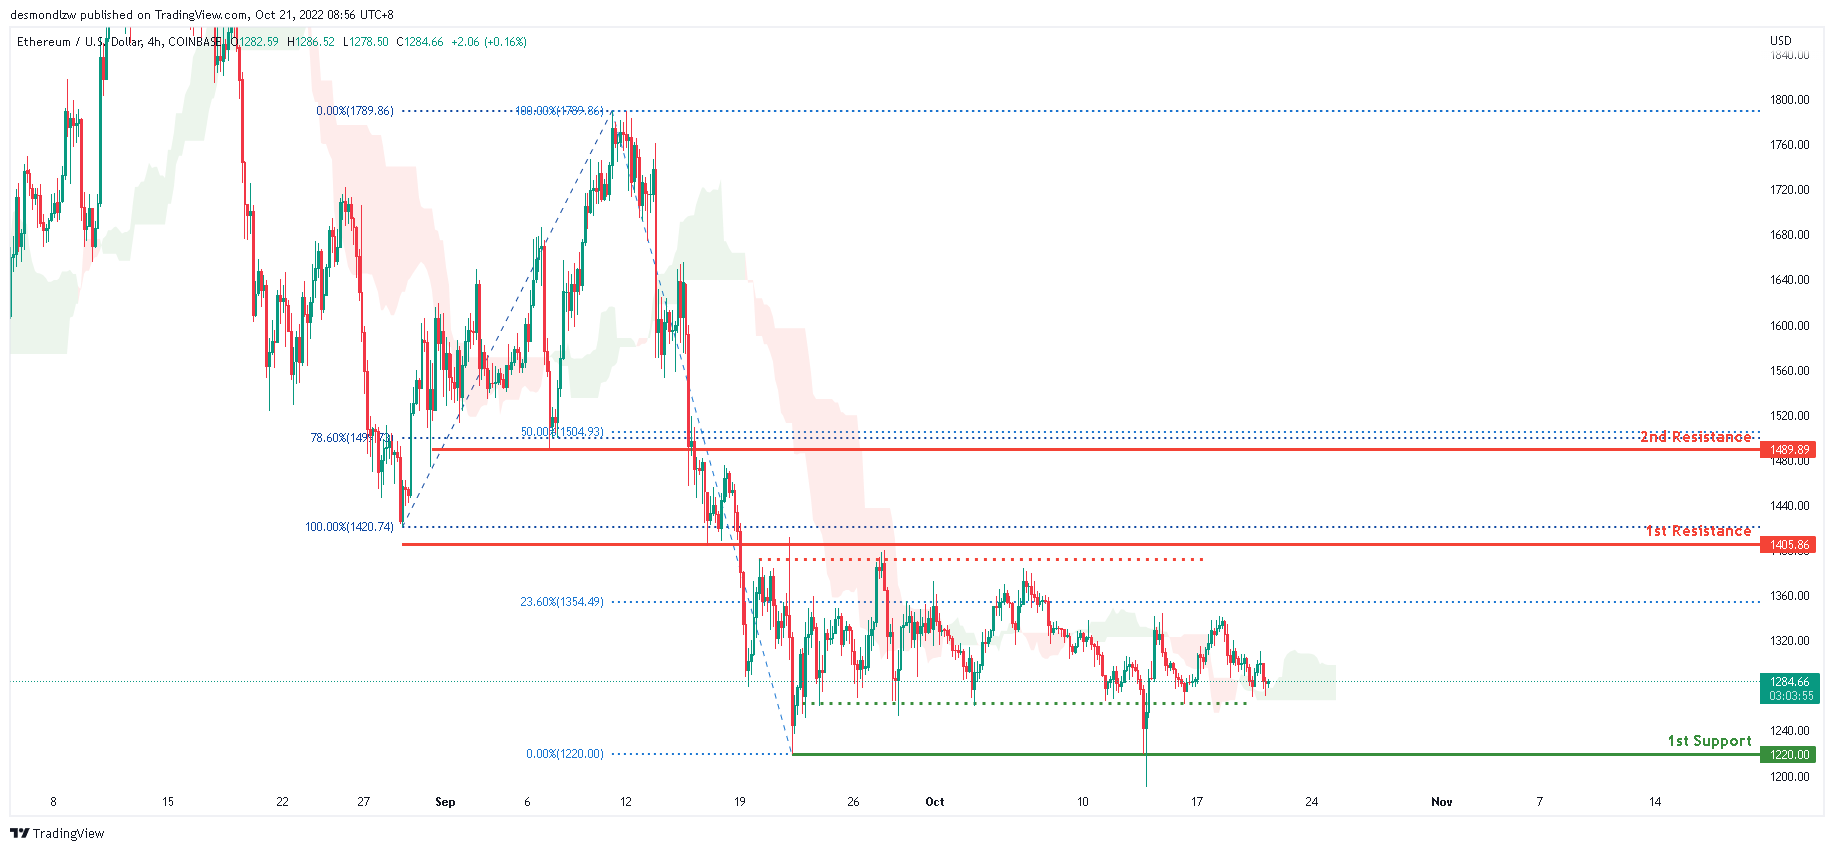
ETHUSD:
Looking at the H4 chart, the current overall bias for ETHUSD is bearish. However overnight, price has closed above the Ichimoku cloud which might indicate a short term bullish momentum. For the past 1 month, price has been consolidating between the 1st resistance at 1405.86 and 1st support at 1405.86. Expecting price to continue consolidating in this area with no clear signs of direction.
Areas of consideration:
- H4 time frame, 1st resistance of 1405.86
- H4 time frame, 1st support at 1220.00
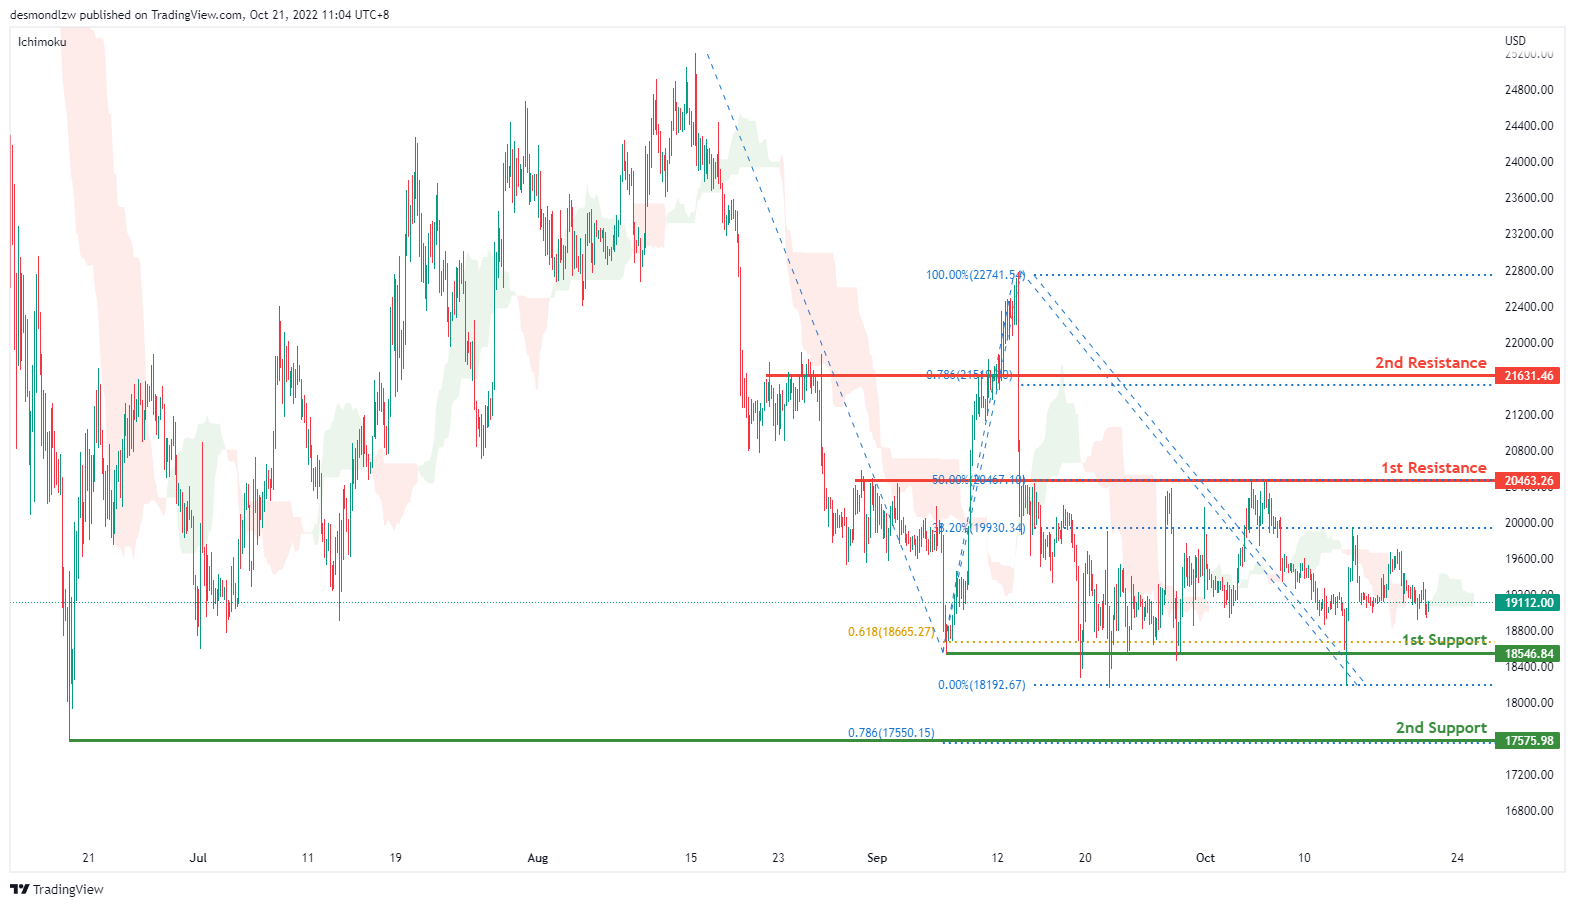
BTCUSD:
On the H4, price is crossing ichimoku cloud, and Stoch is dropping from the resistance, we have a bearish bias that the price may drop to the 1st support at 18546.84, which is in line with the previous swing lows and if the 1st support is broken, the 2nd support is at 17575.98, where the previous swing low and 78.6% retracement is. Alternatively, the price may rise to the 1st resistance at 20427.26, where the overlap resistance and 50% fibonacci retracement are then the second resistance at 21631.46
Areas of consideration:
- H4 time frame, 1st resistance 20463.26
- H4 time frame, 1st support at 18546.84
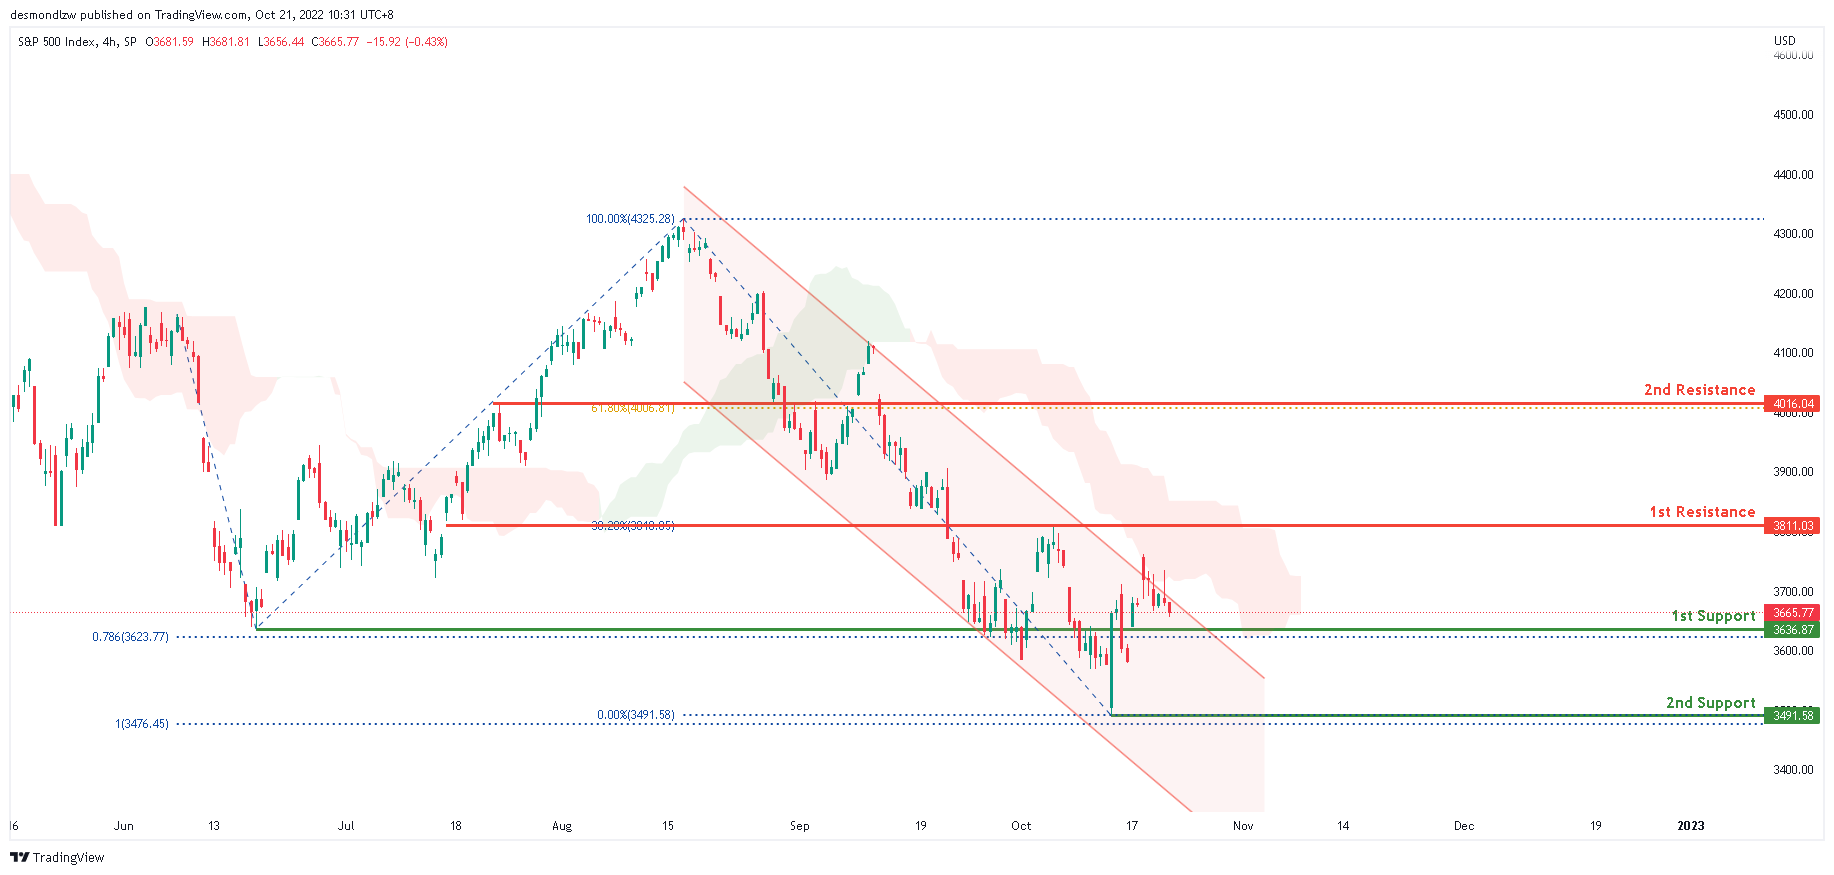
S&P 500:
Based on the H4 chart, the S&P500 is still within the bearish channel, with the overall bias to be bearish. To add confluence to this, price is below the Ichimoku cloud which indicates a bearish market. Overnight, price has continued it’s bearish momentum downwards with price expected to tap onto the 1st support at 3636.87 where the 78.6% Fibonacci projection line is located.
Areas of consideration:
- H4 time frame, 1st support at 3492.42
- H4 time frame, 1st resistance at 3800
- H4 time frame, 2nd resistance at 4007.45


