
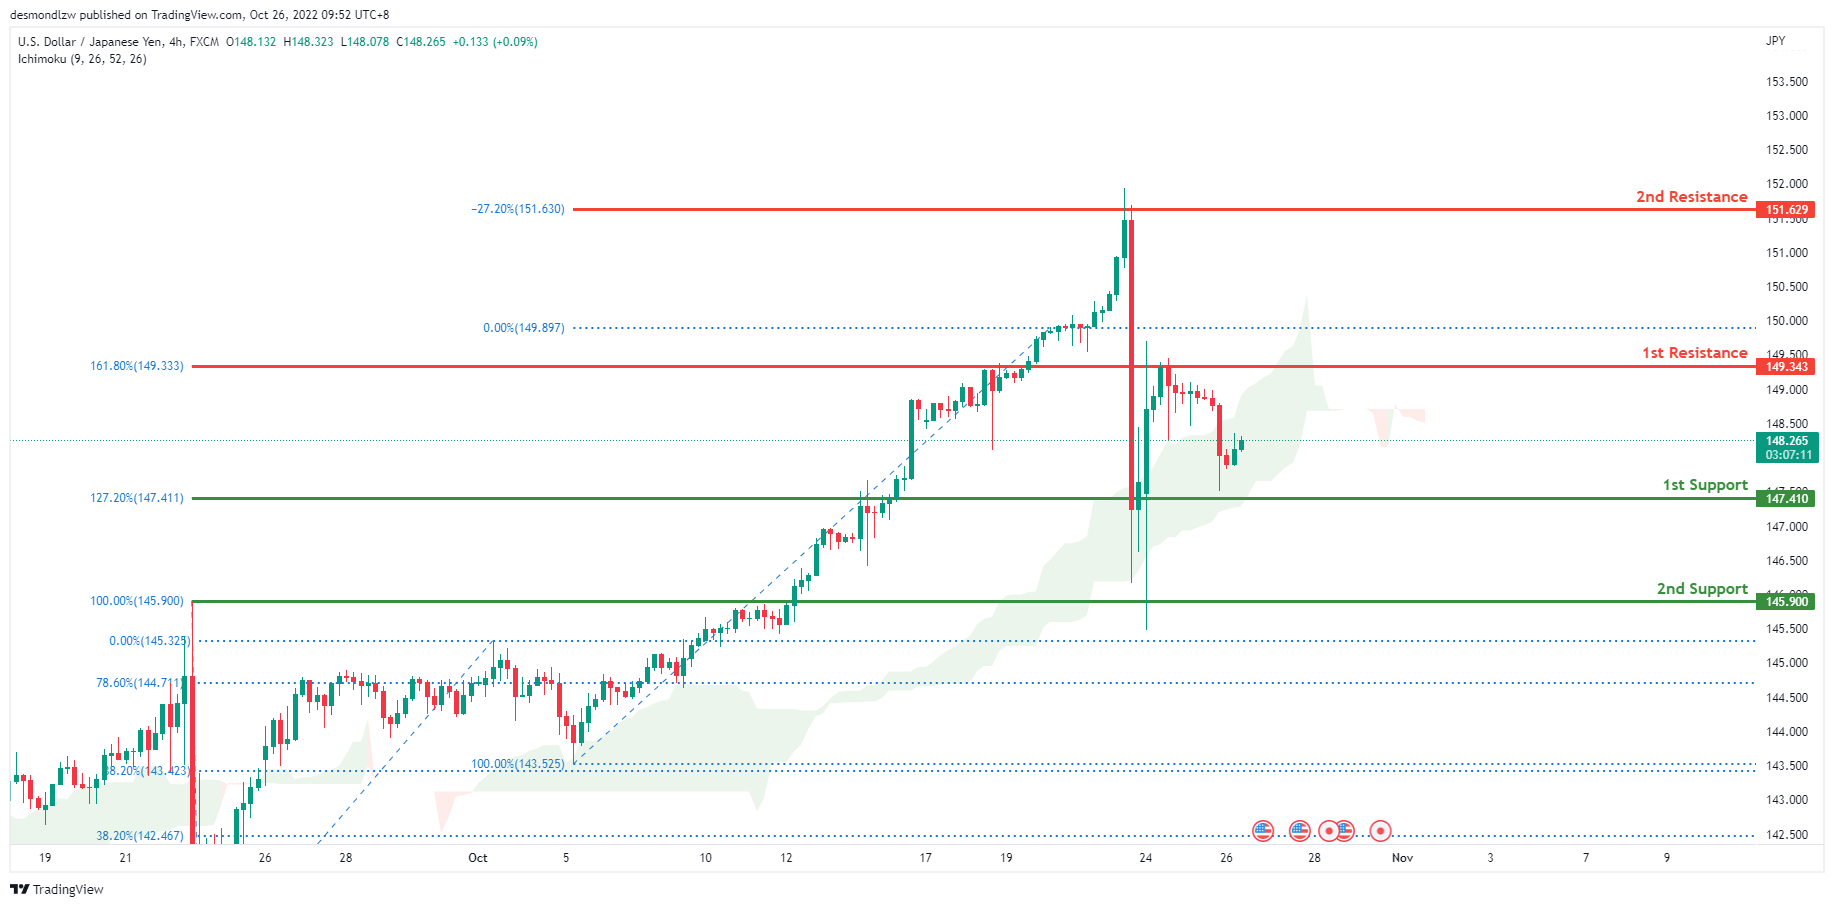
USD/JPY:
The current general bias for USDJPY on the H4 chart is bullish. Overnight, price retraced downwards from the 1st resistance at 149.343 where the 161.8% Fibonacci line is located. If this bearish retracement continues, expect price to head towards the 1st support at 147.410 where the 127.2% Fibonacci line is located.
Areas of consideration:
- H4 time frame, 1st resistance at 151.629
- H4 time frame, 1st support at 149.313
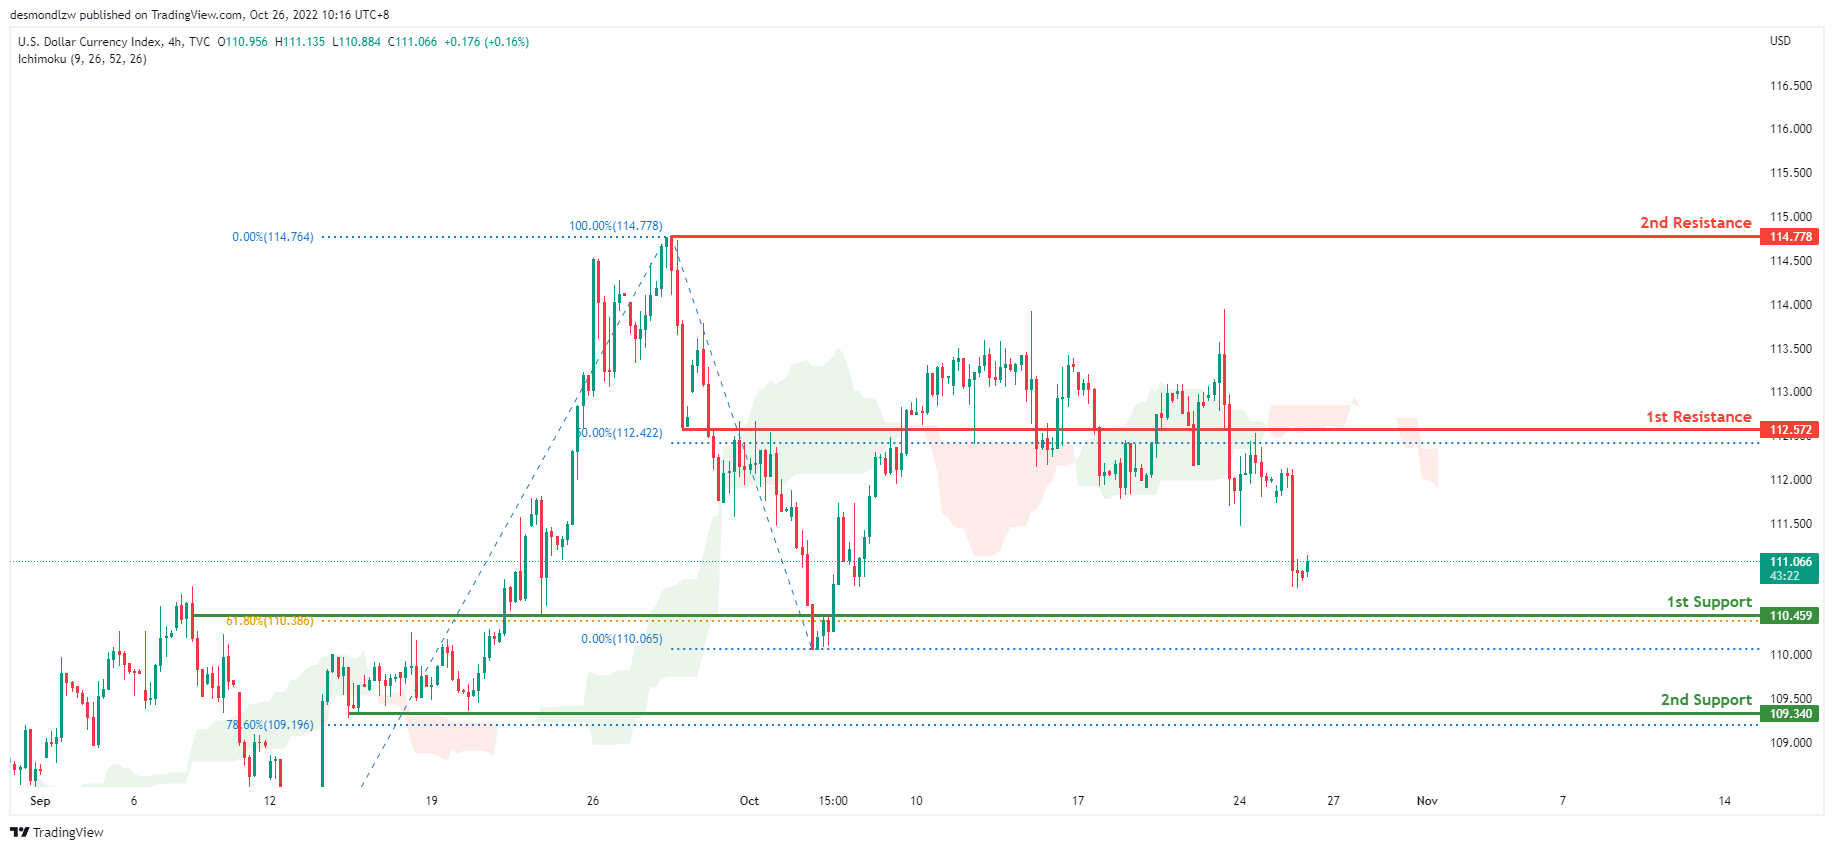
DXY:
On the H4 chart, the overall bias for DXY is bearish. To add confluence to this, the price is below the Ichimoku cloud which indicates a bearish market. Overnight, DXY had massive bearish momentum downwards. If this bearish momentum continues, expect price to possibly head towards the 1st support at 110.459 where the 61.8% Fibonacci line is located.
Areas of consideration:
- H4 time frame, 1st resistance at 114.759
- H4 time frame, 1st support at 110.084
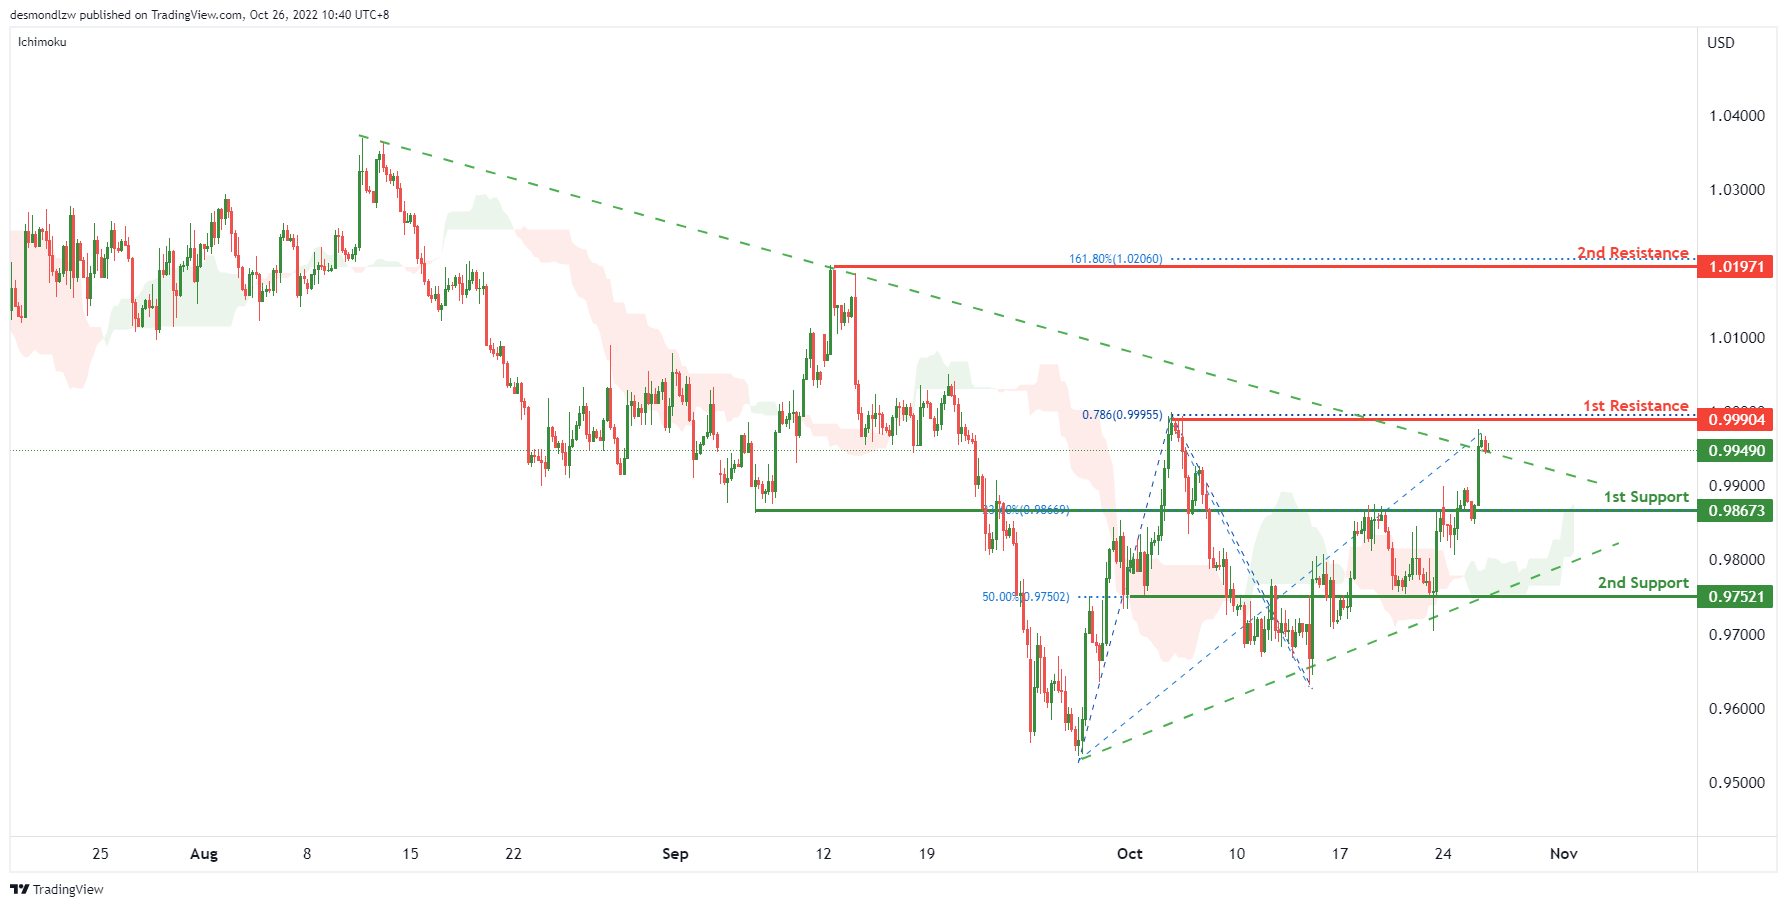
EUR/USD:
On the H4, price is moving within the short term ascending trendline and breaking the long term ascending trendline, we have a bullish bias that the price may rise to the 1st resistance at 0.99904, which is in line with the previous swing high and 78.6% fibonacci projection. If the 1st resistance is broken, the 2nd resistance is at 1.01971, where the previous swing high and 161.8% fibonacci extension are. Alternatively, the price may drop to the 1st support at 0.98673, which is in line with the 23.6% fibonacci retracement and previous swing low. If the 1st support is broken, the 2nd support is at 0.97521, where the 50% fibonacci retracement sits.
Areas of consideration :
- H4 1st resistance at 0.99904
- H4 1st support at 0.98673
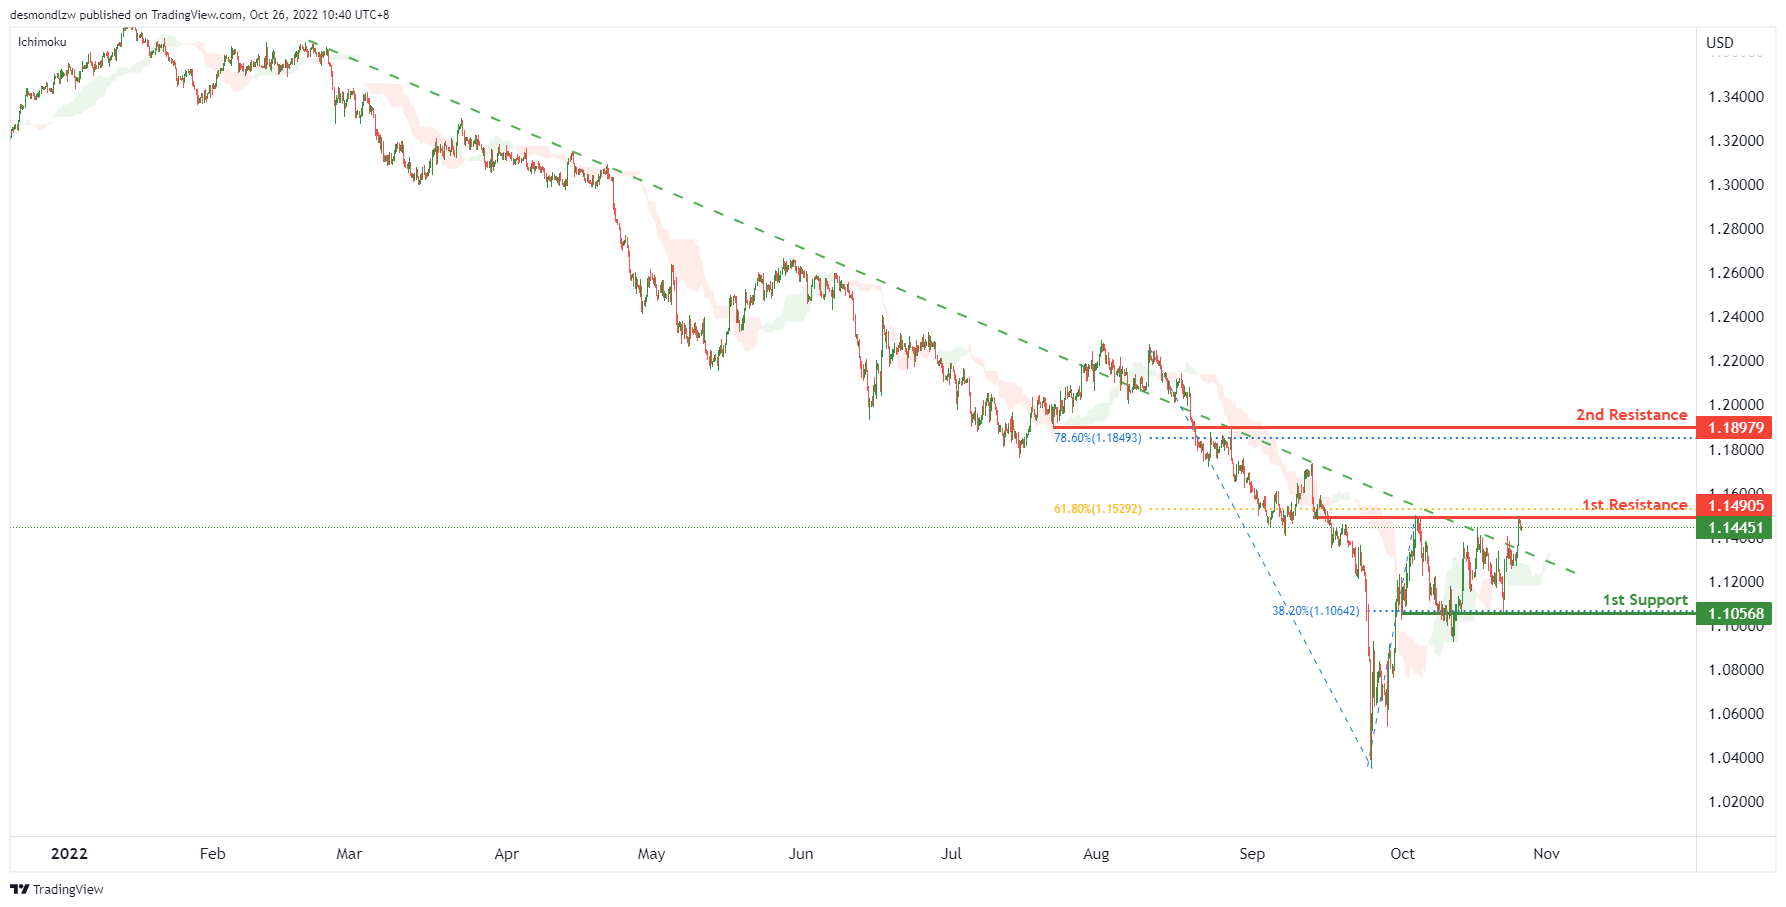
GBP/USD:
On the H4, price is crossing ichimoku cloud and breaking the descending trendline, we have a bullish bias that the price may test the 1st resistance at 1.14905, which is in line with the overlap resistance and 61.8% fibonacci retracement. If the 1st resistance is broken, the 2nd resistance is at 1.18979, where the overlap resistance and 78.6% fibonacci retracement are. Alternatively, the price may drop to the 1st support at 1.10568, where the swing low support and 38.2% fibonacci retracement are.
Areas of consideration:
- H4 1st resistance at 1.14905
- H4 2nd resistance at 1.18979
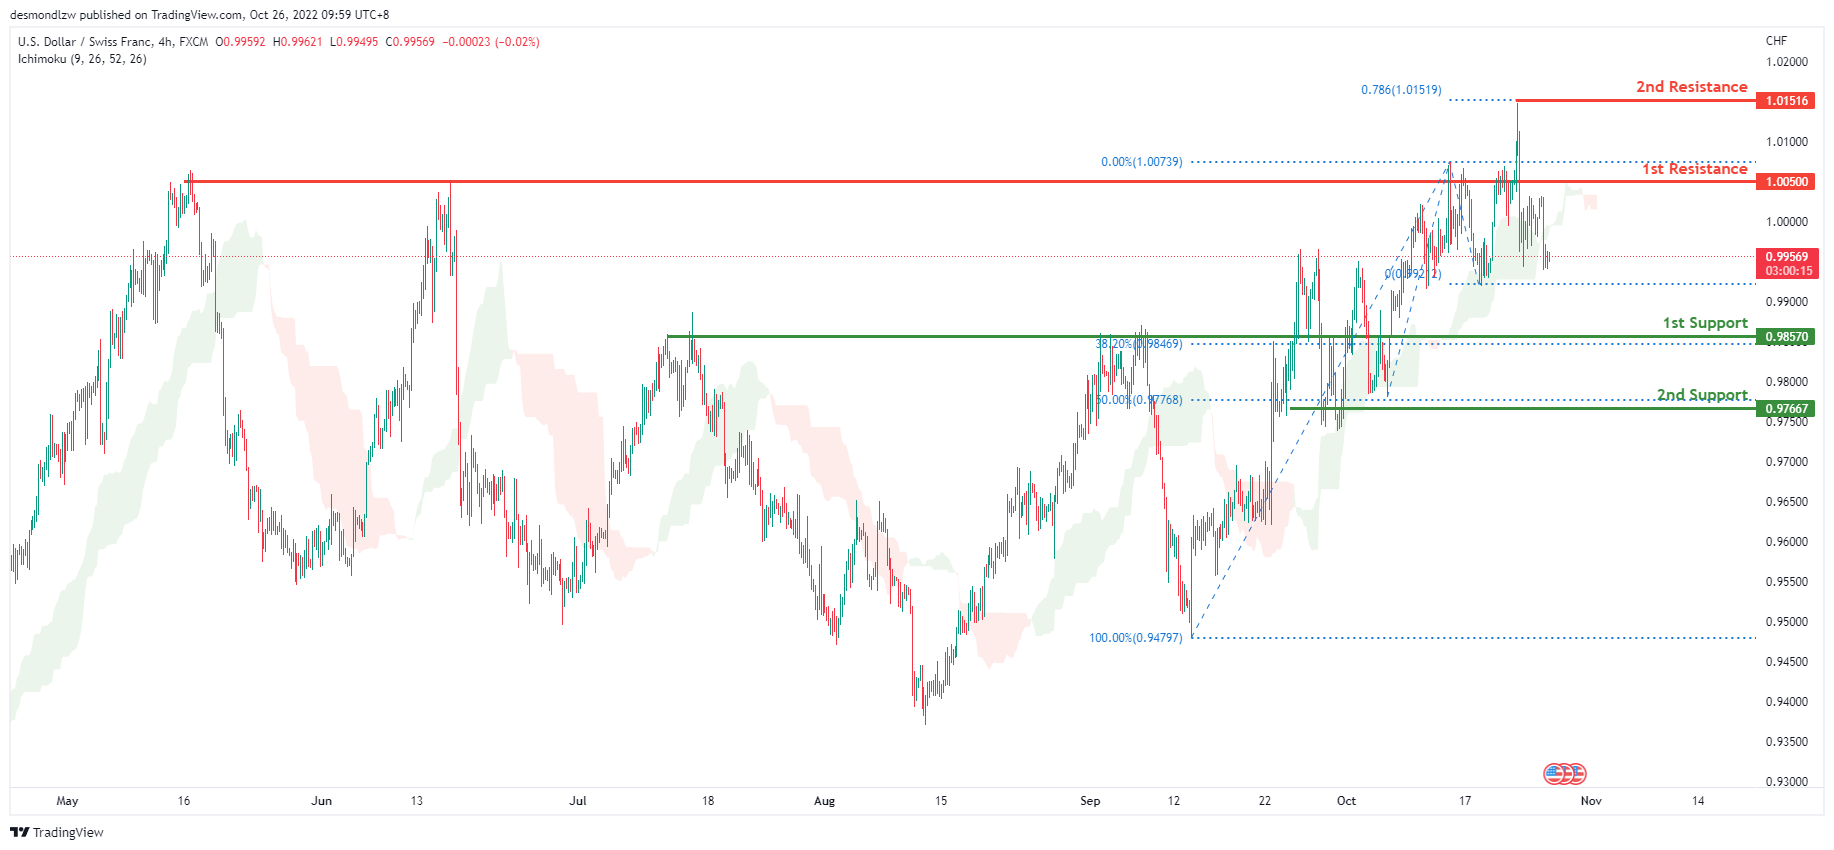
USD/CHF:
On the H4 chart, the overall bias for USDCHF is bullish. However overnight, price continued its bearish retracement downwards and closed below the Ichimoku cloud which might indicate a change to bearish momentum. If this bearish momentum continues, expecting price to head towards the 1st support at 0.98570 where the 38.2% Fibonacci line is located.
Areas of consideration
- H4 1st support at 0.9857
- H4 1st resistance at 1.0050
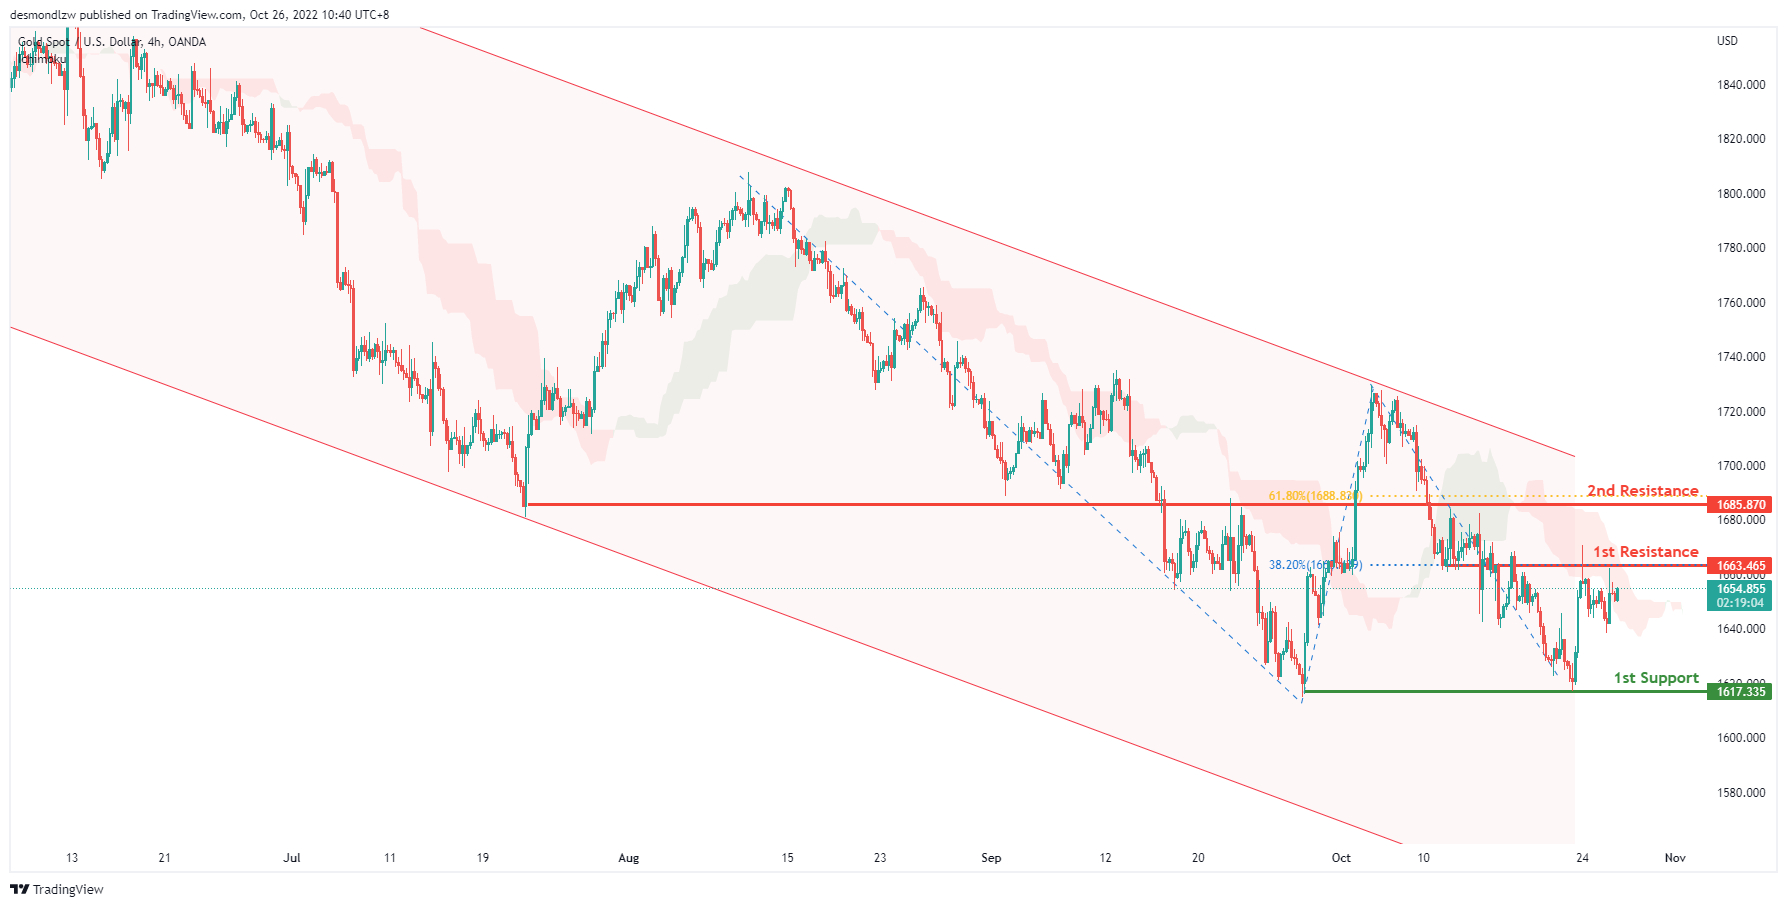
XAU/USD (GOLD):
On the H4 chart, the overall bias for XAUUSDis bearish. To add confluence to this, the price is below the Ichimoku cloud which indicates a bearish market. Price has tapped onto the 1st resistance at 1663.465, where the 38.2% Fibonacci line is located before reflecting back down. Expecting price to possibly head back up to retest the 1st resistance and then drop to the 1st support at 1617.335.
Areas of consideration:
- H4 time frame, 1st support at 1617.335
- H4 time frame, 1st resistance at 1663.465
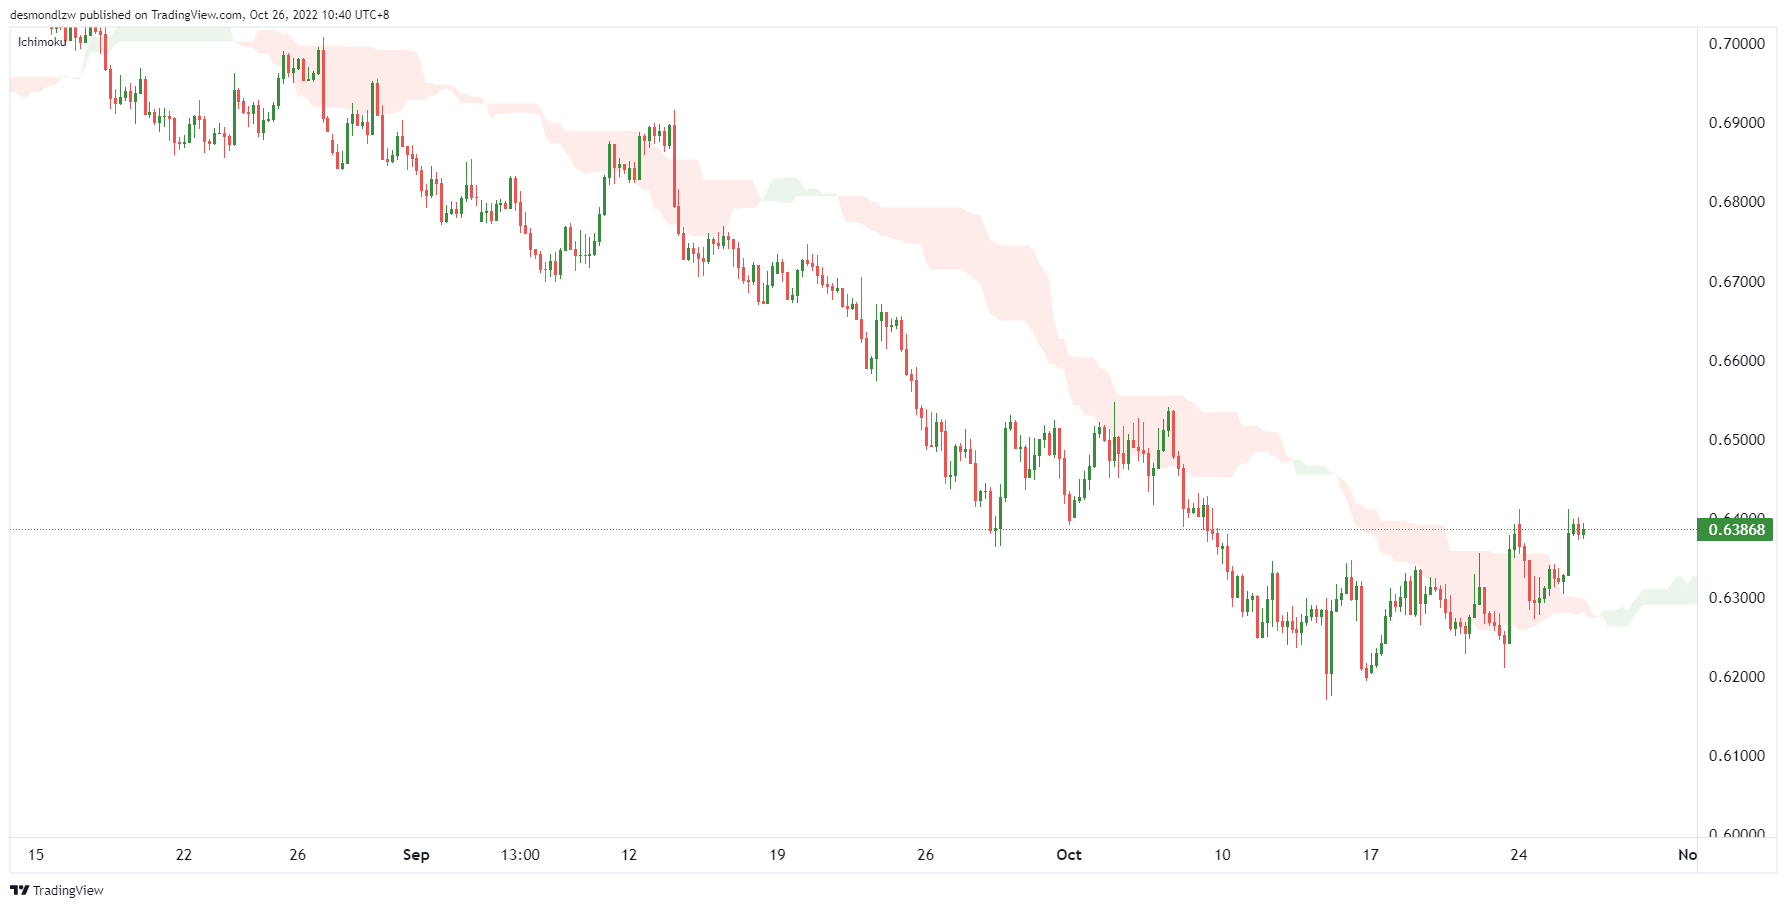
AUD/USD:
On the H4, with the price breaking the descending channel and ichimoku cloud, we have a bullish bias that the price may retest the 1st resistance at 0.64185, which is in line with the overlap resistance, if the 1st resistance is broken, the 2nd resistance is at 0.65388, where the previous swing high is. Alternatively, the price may drop to the 1st support at 0.62906, which is in line with the 50% fibonacci retracement. If the 1st support is broken, the price may drop to the 2nd support at 0.61921, where the previous swing low, 61.8% fibonacci projection and 200% fibonacci extension are.
Areas of consideration
- H4, 1st resistance at 0.64185
- H4, 2nd resistance at 0.65388
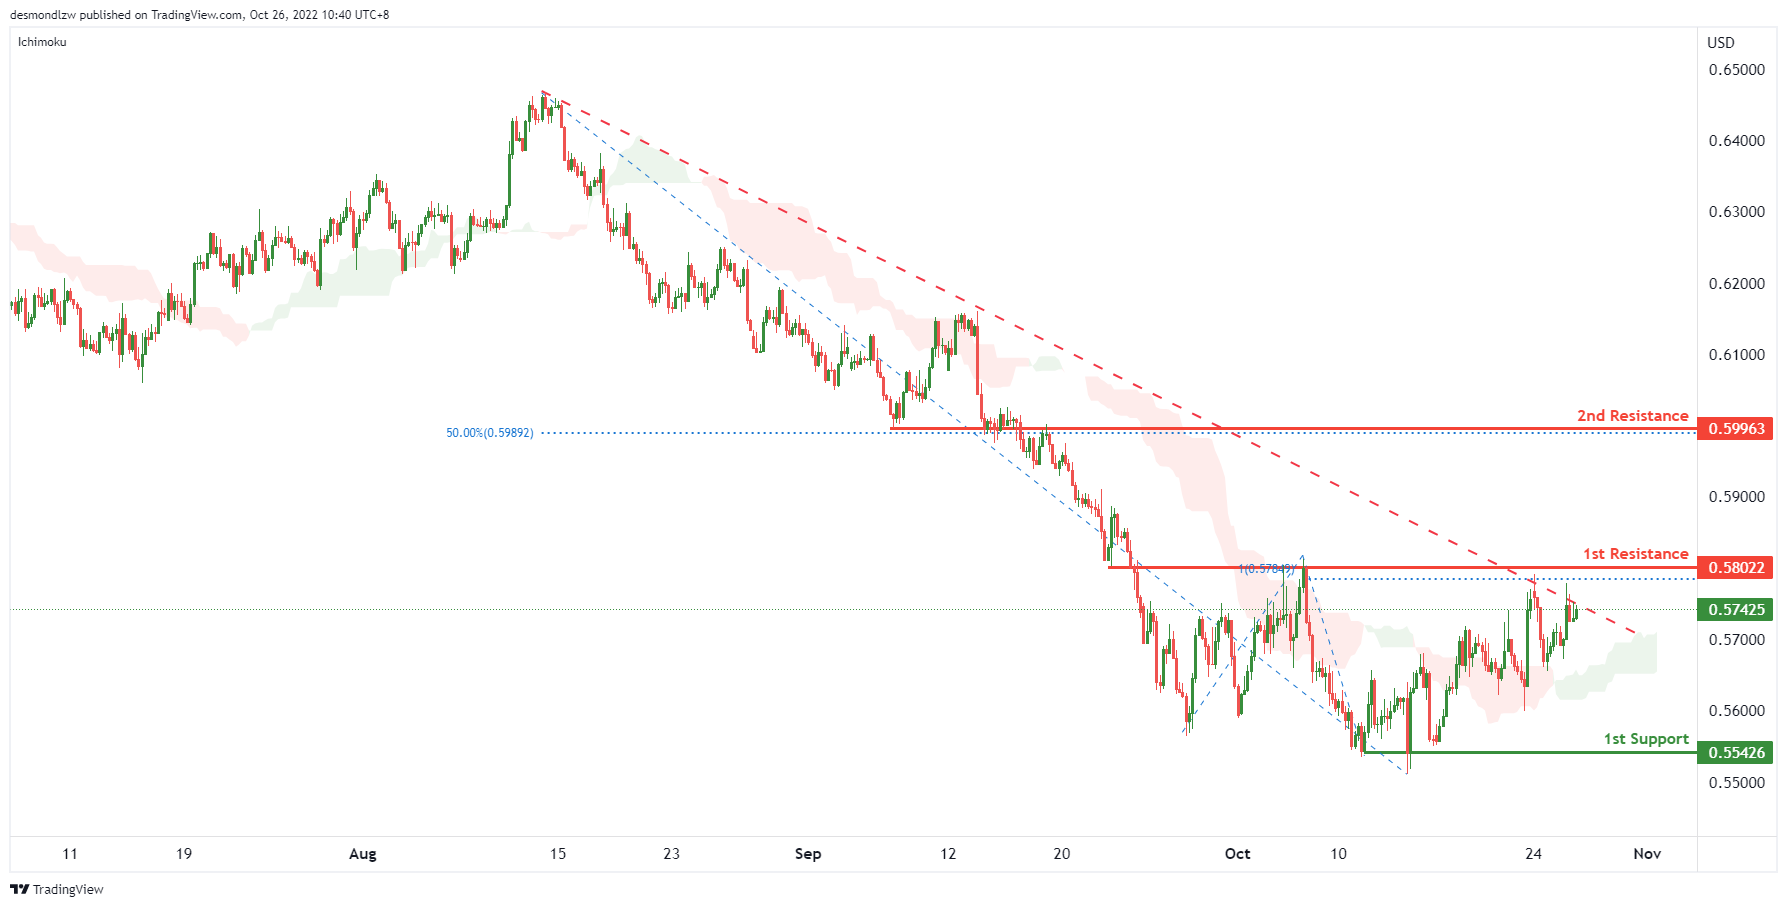
NZD/USD:
On the H4 chart, as the price is testing the descending trendline and the price is above ichimoku cloud, we have a bullish bias that the price may rise to the 1st resistance at 0.58022, which is in line with the 100% fibonacci projection and previous swing high. If the 1st resistance is broken, the 2nd resistance is at 0.59963, where the overlap resistance and 50% fibonacci retracement are. Alternatively, the price may drop to the 1st support at 0.55426, where the previous swing low is.
Areas of consideration:
- H4 time frame, 1st resistance at 0.58022
- H4 time frame, 2nd resistance at 0.59963
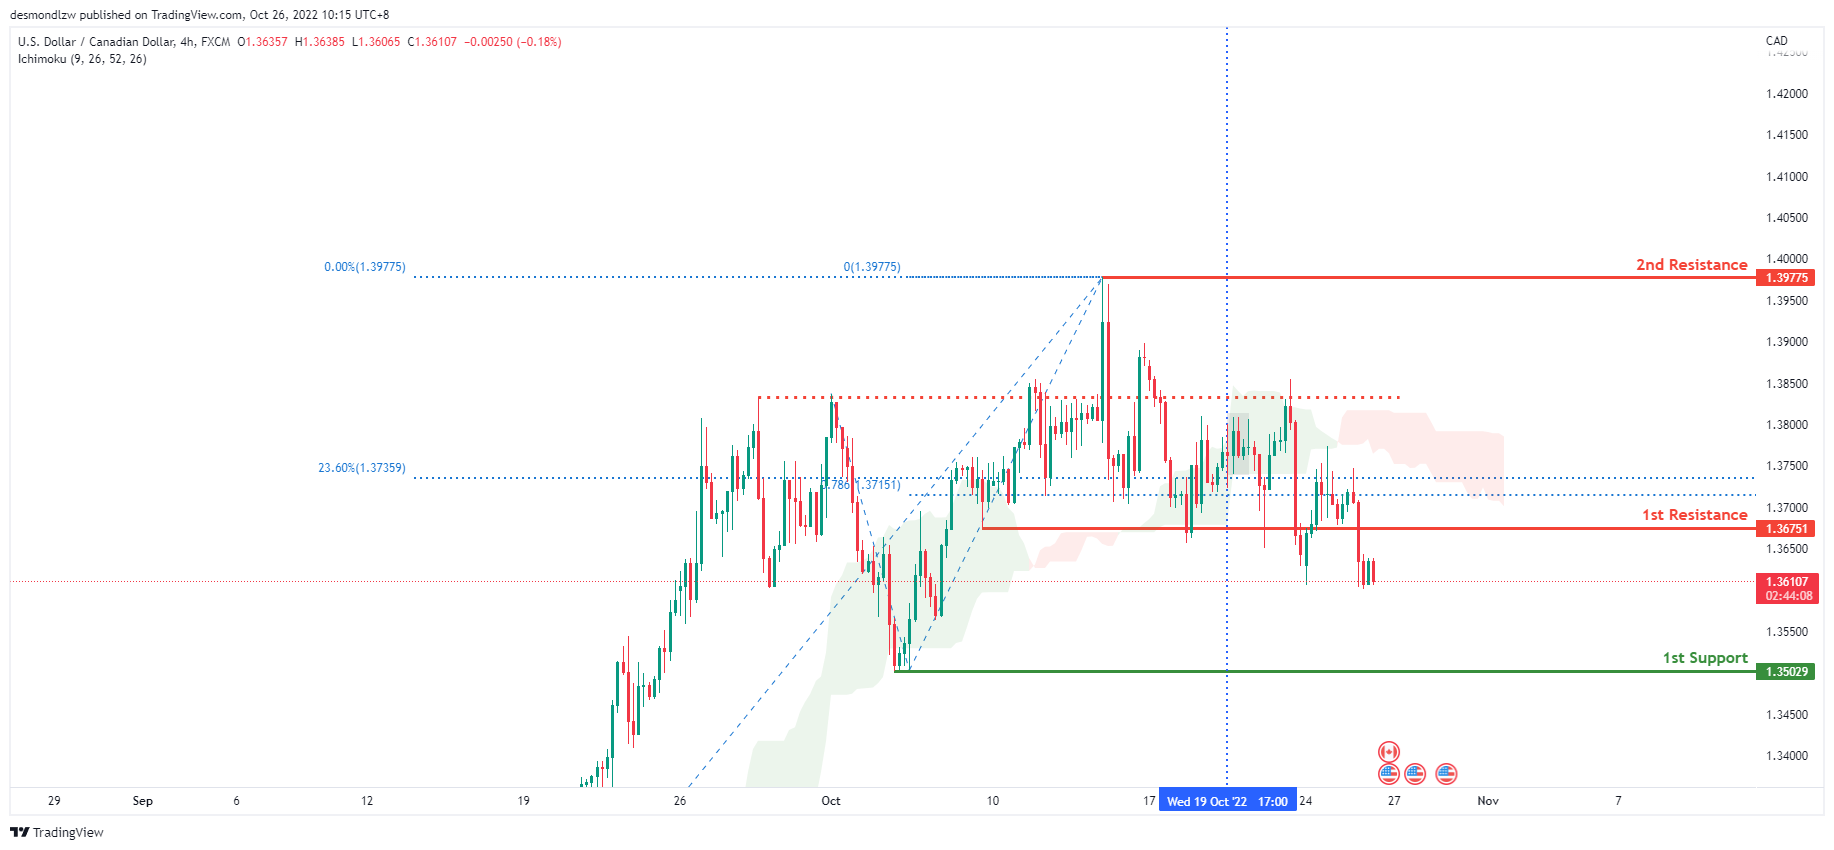
USD/CAD:
On the H4 chart, the overall bias for USDCAD is bearish. To add confluence to this, the price is below the Ichimoku cloud which indicates a bearish market. Overnight, price has continued its bearish momentum and closed under the 1st resistance at 1.36751 where the 23.6% Fibonacci line and 78.6% Fibonacci projection line is located. If this bearish momentum continues, expect the price to possibly head down towards the 1st support at 1.35029 where the previous low is.
Areas of consideration:
- H4 time frame, 1st resistance at 1.36751
- H4 time frame, 1st support at 1.35029
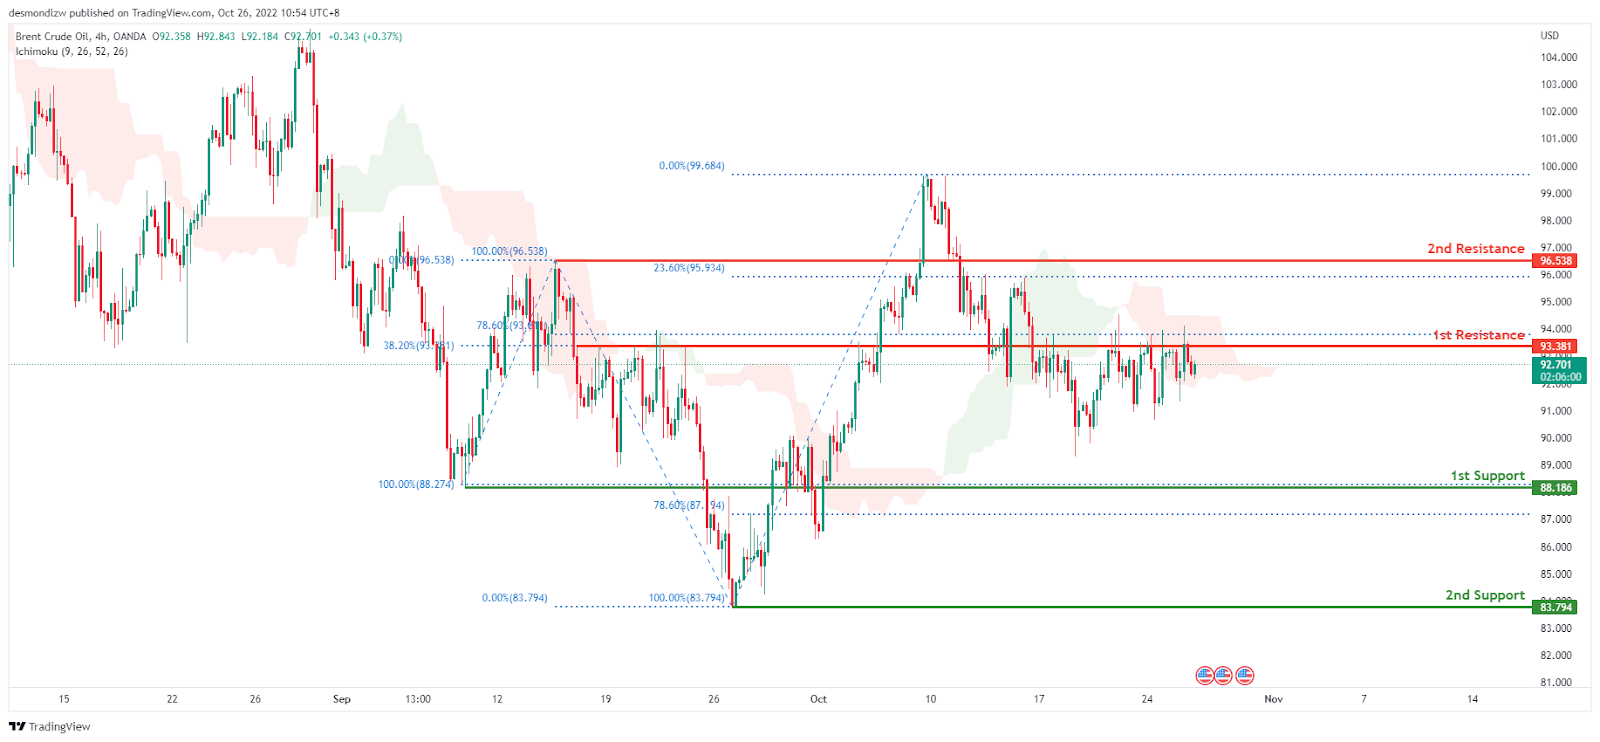
OIL:
Looking at the H4 chart, the current overall bias for Oil is bearish. The price continued consolidating underneath the 1st resistance line at 93.381 where the 38.2% and 78.6% Fibonacci lines are located. Expecting the price to head towards the 1st support at 88.186 where the 100% and 78.6% Fibonacci lines are located if this bearish momentum continues.
Areas of consideration:
- H4 time frame, 1st resistance at 93.381
- H4 time frame, 1st support at 88.1
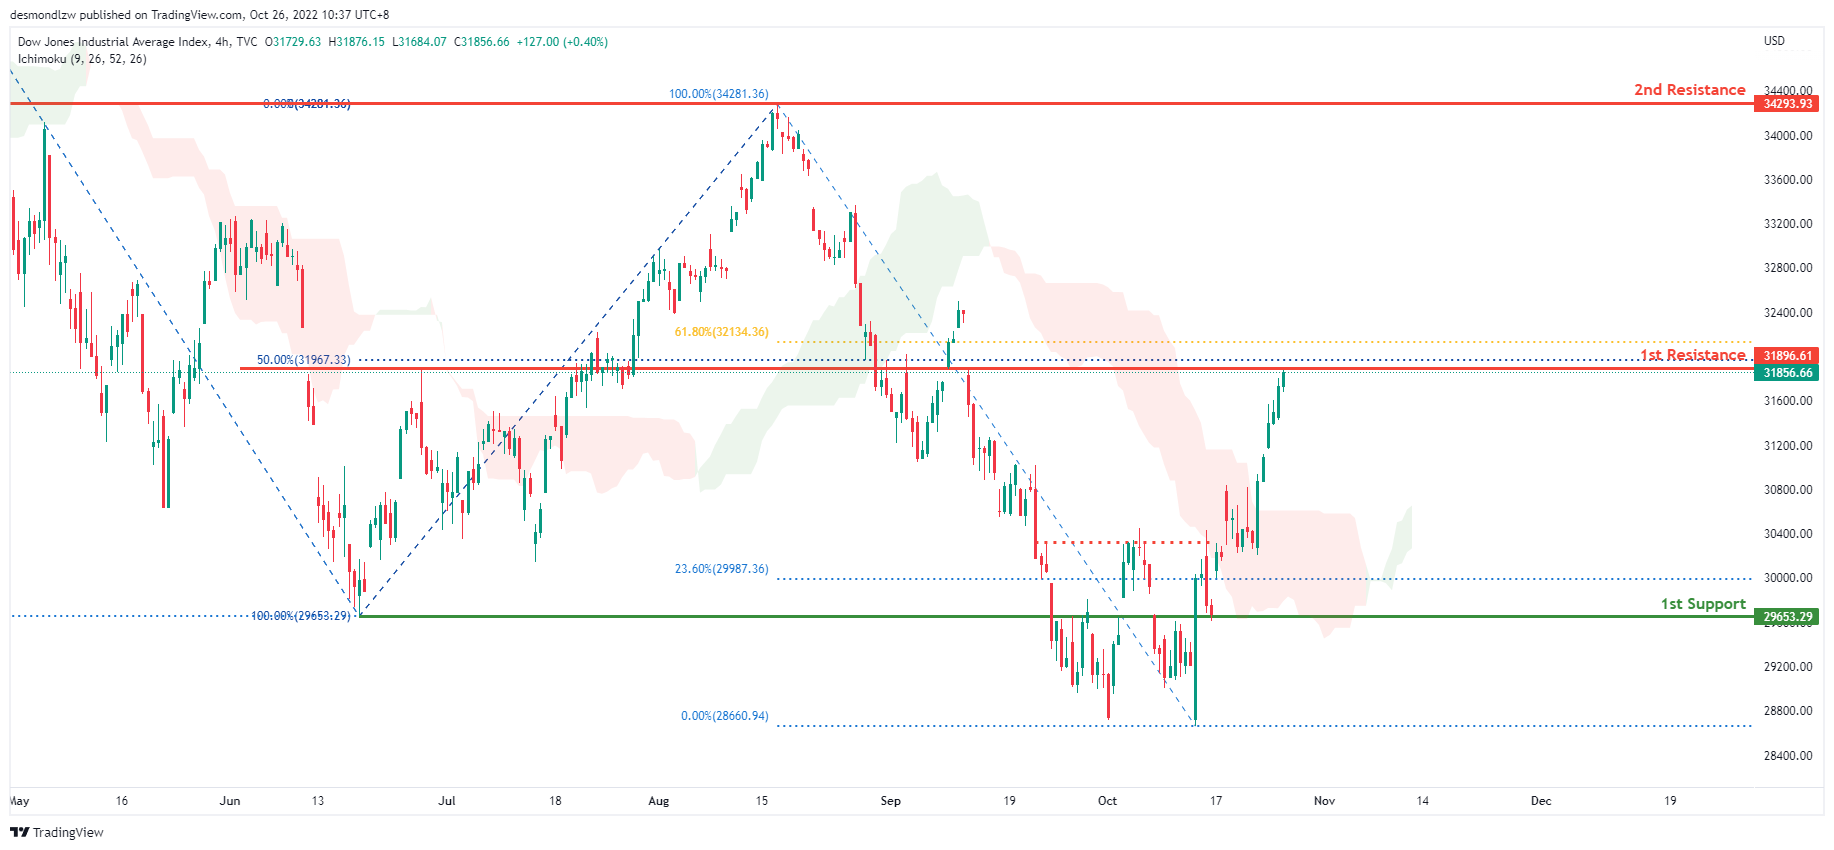
Dow Jones Industrial Average:
On the H4 chart, the overall bias for DJI is bullish. To add confluence to this, the price is above the Ichimoku cloud which indicates a bullish market. Overnight, price had massive bullish momentum upwards due to the weakening of the DXY. Price has tapped into the 1st resistance at 31896.61, where the 61.8% and 50% Fibonacci lines are and is currently resting there. If this bullish momentum continues, expect price to possibly break above the 1st resistance at 31896.61 and head towards the 2nd resistance at 34293.93 where the previous swing high and 100% Fibonacci line is located.
Areas of consideration:
- H4 time frame, 1st support at 29653.29
- H4 time frame, 1st Resistance at 31896.61
- H4 time frame, 2nd Resistance at 34293.93
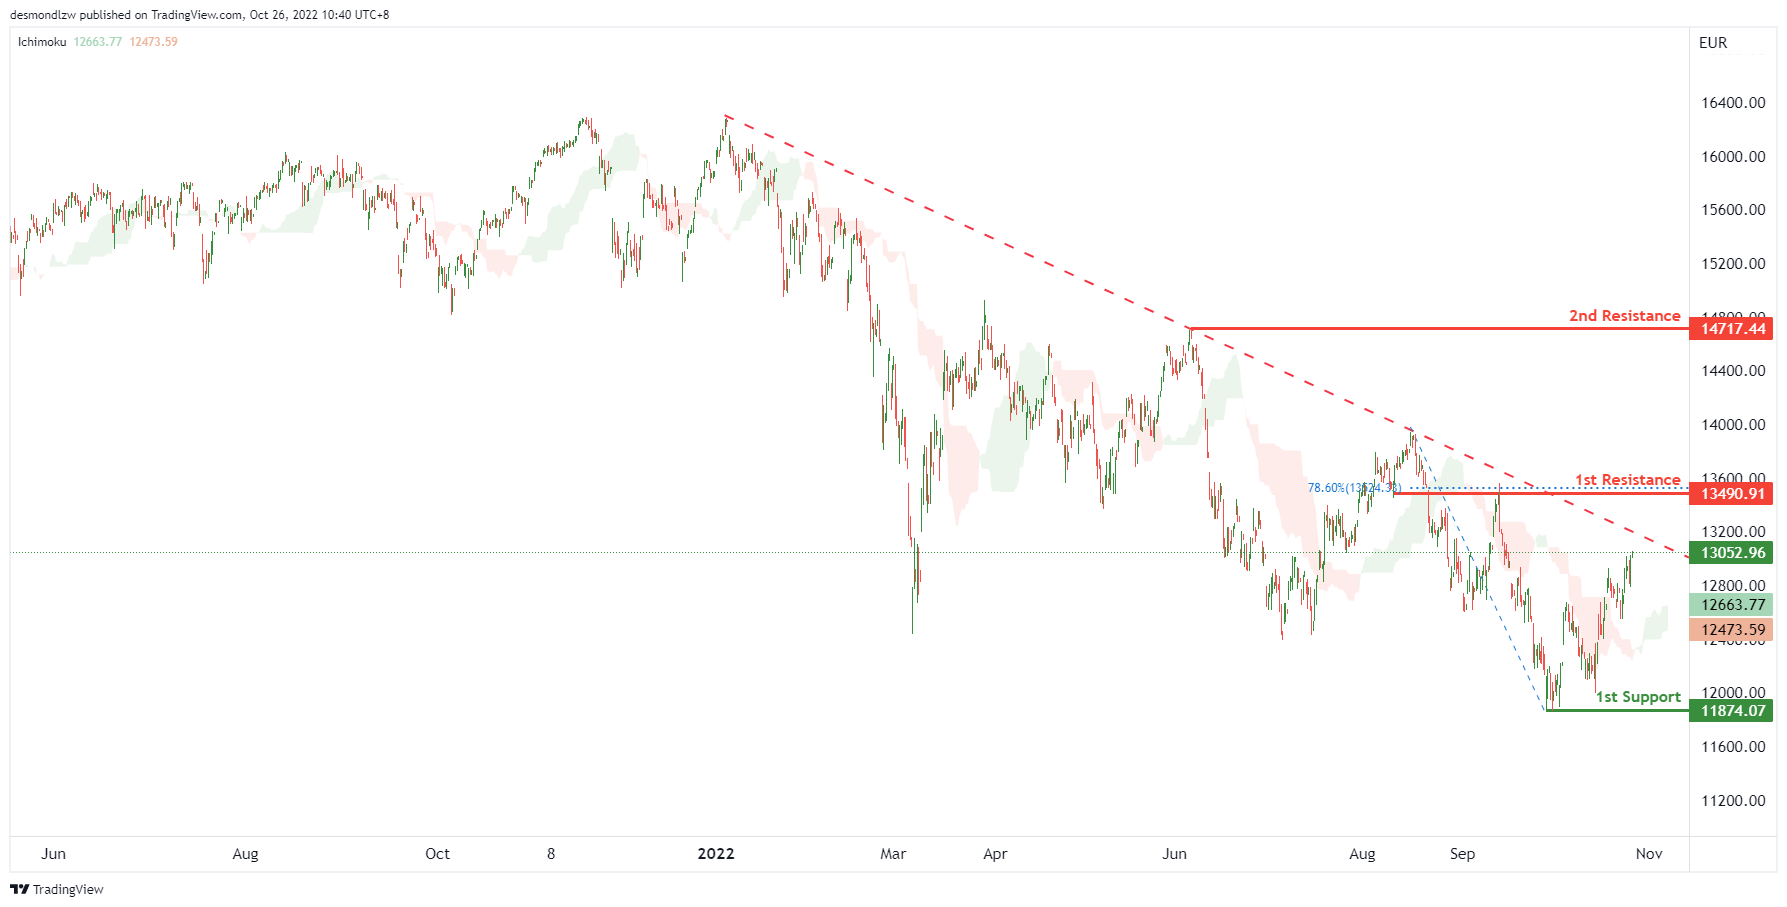
DAX:
On the H4 chart, the overall bias for DAX is bearish. However, price has now closed above the Ichimoku cloud which indicates a change to bullish market momentum. Expecting price to possibly continue this bullish momentum and head towards the 1st resistance at 13490.91, where the 78.6% Fibonacci line is located. If the 1st resistance is broken, the 2nd resistance could be at 14717.44, which is in line with the previous swing high. Alternatively, the price may drop to the 1st support at 11874.07, which is in line with the swing low.
Areas of consideration:
- H4 time frame, current price
- H4 time frame, 1st resistance at 13490.91
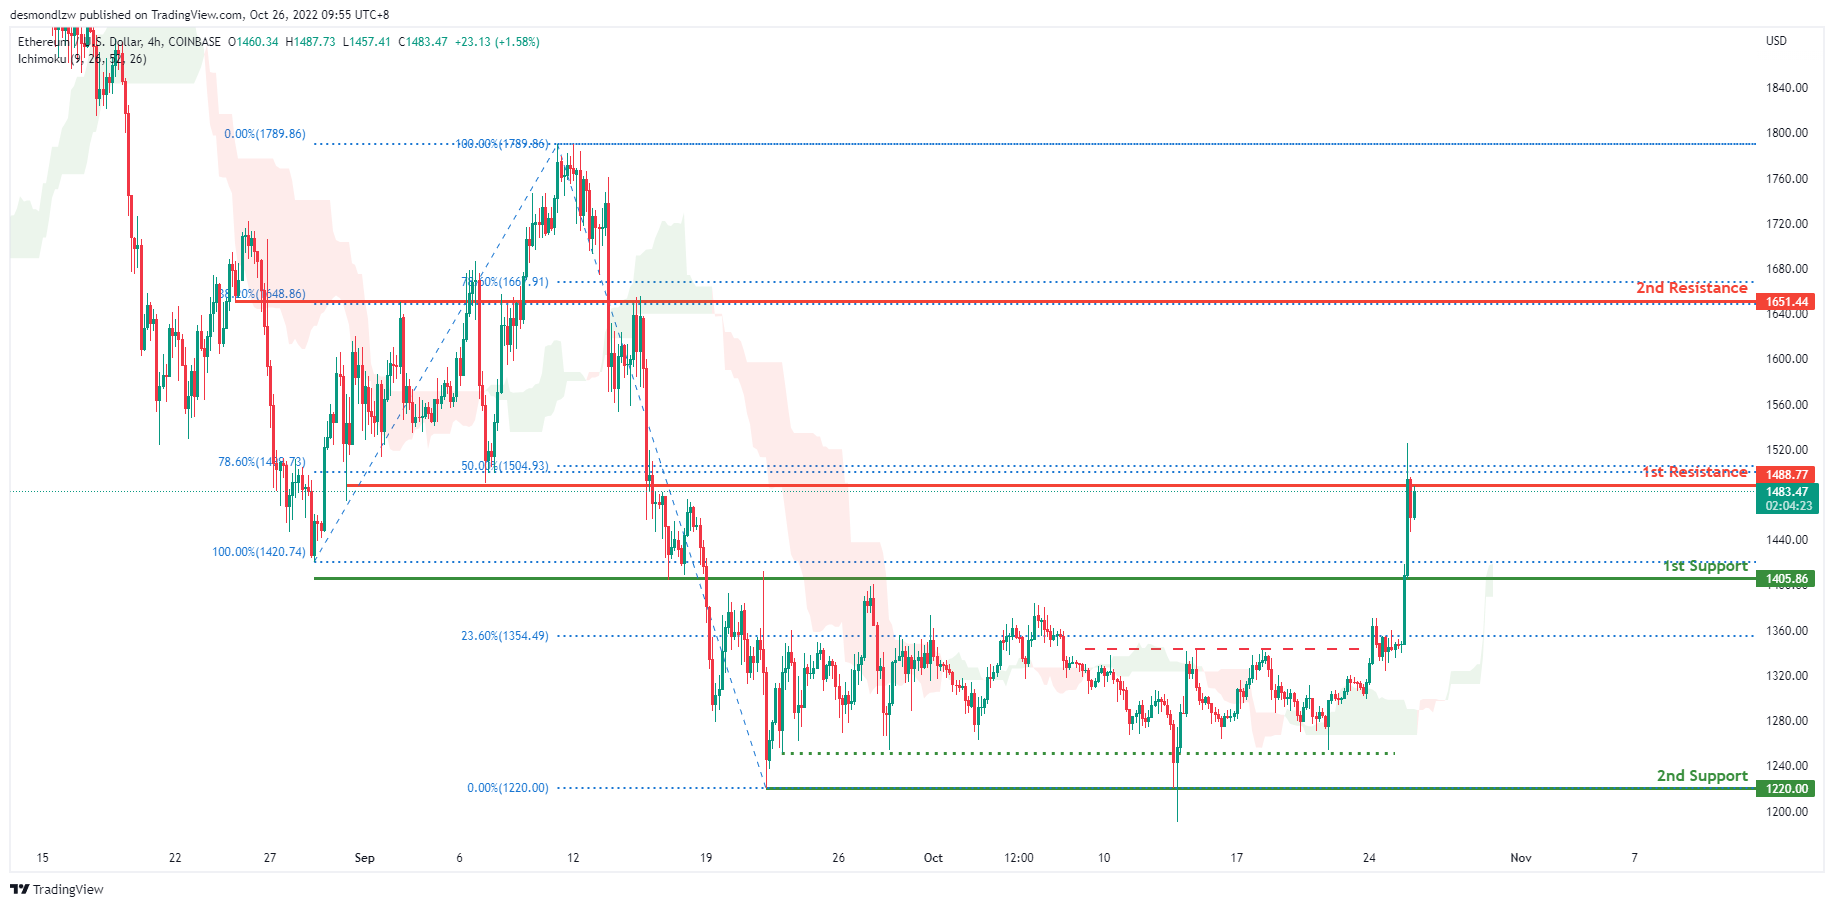
ETHUSD:
Looking at the H4 chart, the current overall bias for ETHUSD is bearish. However overnight, the price broke out of the consolidation between the 1st resistance at 1405.86 and 1st support at 1405.86. Price has then tapped onto the 1st resistance at 1488.77 where the 78.5% and 50% Fibonacci lines are located. Expecting price to possibly come back down to test the 1st support at 1405.86 where the 100% Fibonacci line and previous swing low is.
Areas of consideration:
- H4 time frame, 1st resistance of 1488.77
- H4 time frame, 1st support at 1405.86
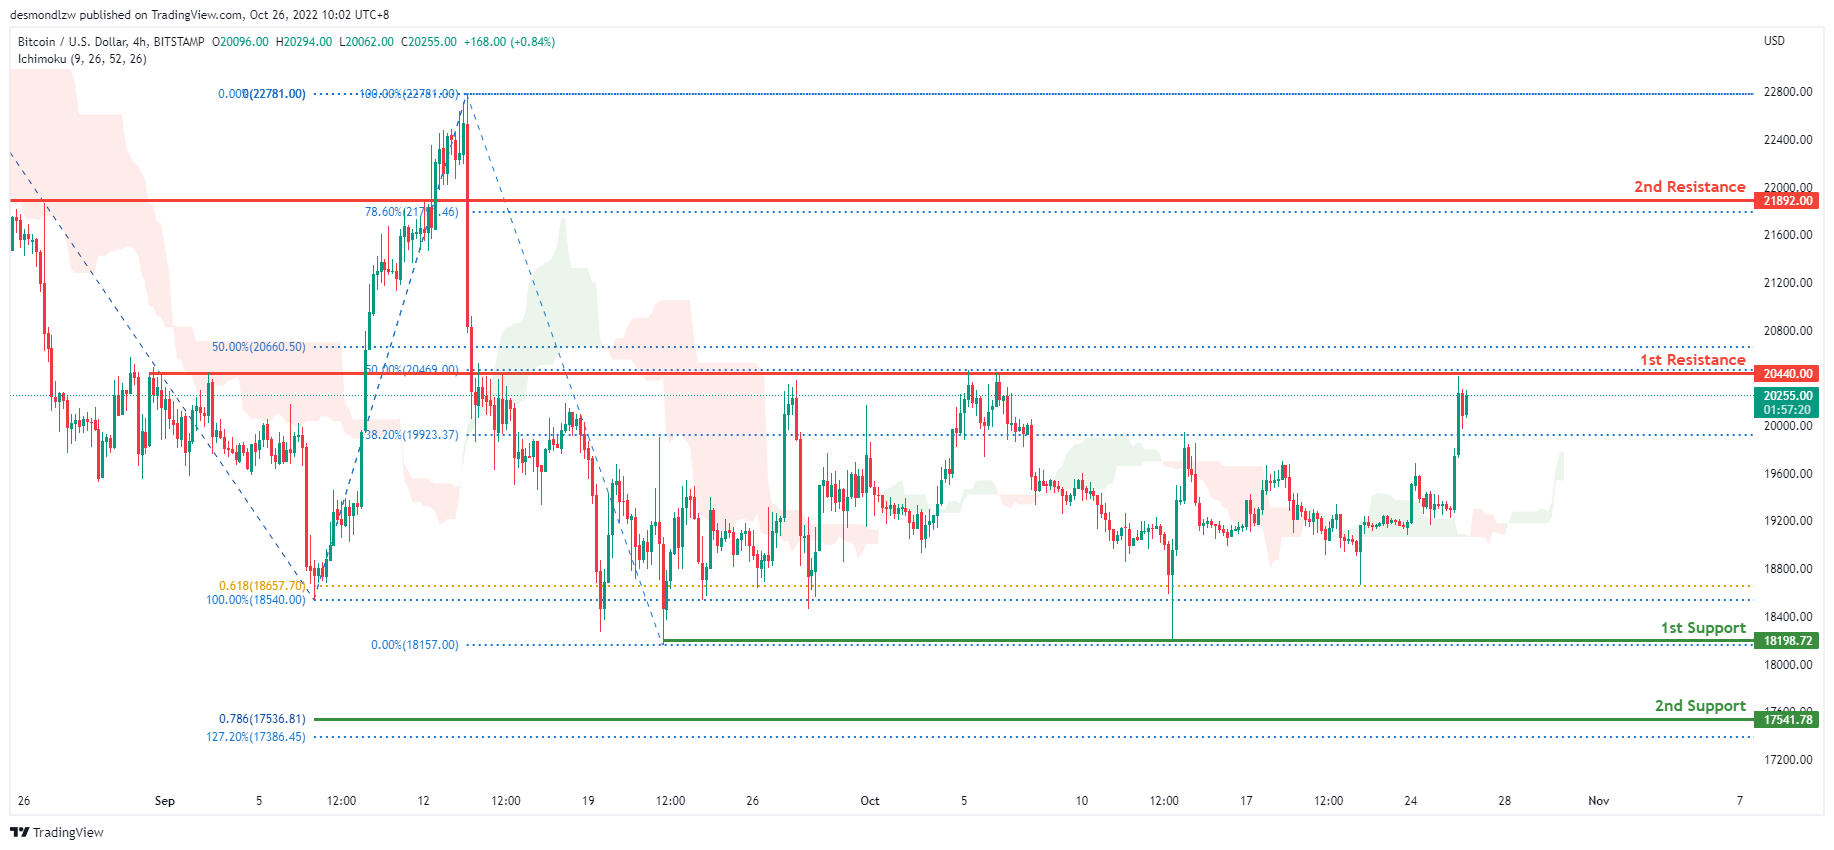
BTCUSD:
On the H4 chart, price has been consolidating between the 1st resistance at 20440.00 and the 1st support at 18198.72. Overnight, price headed and tapped onto the 1st resistance at 20440.00 where the 50% Fibonacci line is located. Price is also above the Ichimoku cloud which might indicate a change to bullish momentum. If this bullish momentum continues, expect price to possibly close above the 1st resistance and head towards the 2nd resistance at 21892.00 where the 78.6% Fibonacci line is located.
Areas of consideration:
- H4 time frame, 1st resistance 20440.00
- H4 time frame, 2nd resistance 21892.00
- H4 time frame, 1st support at 18220.96
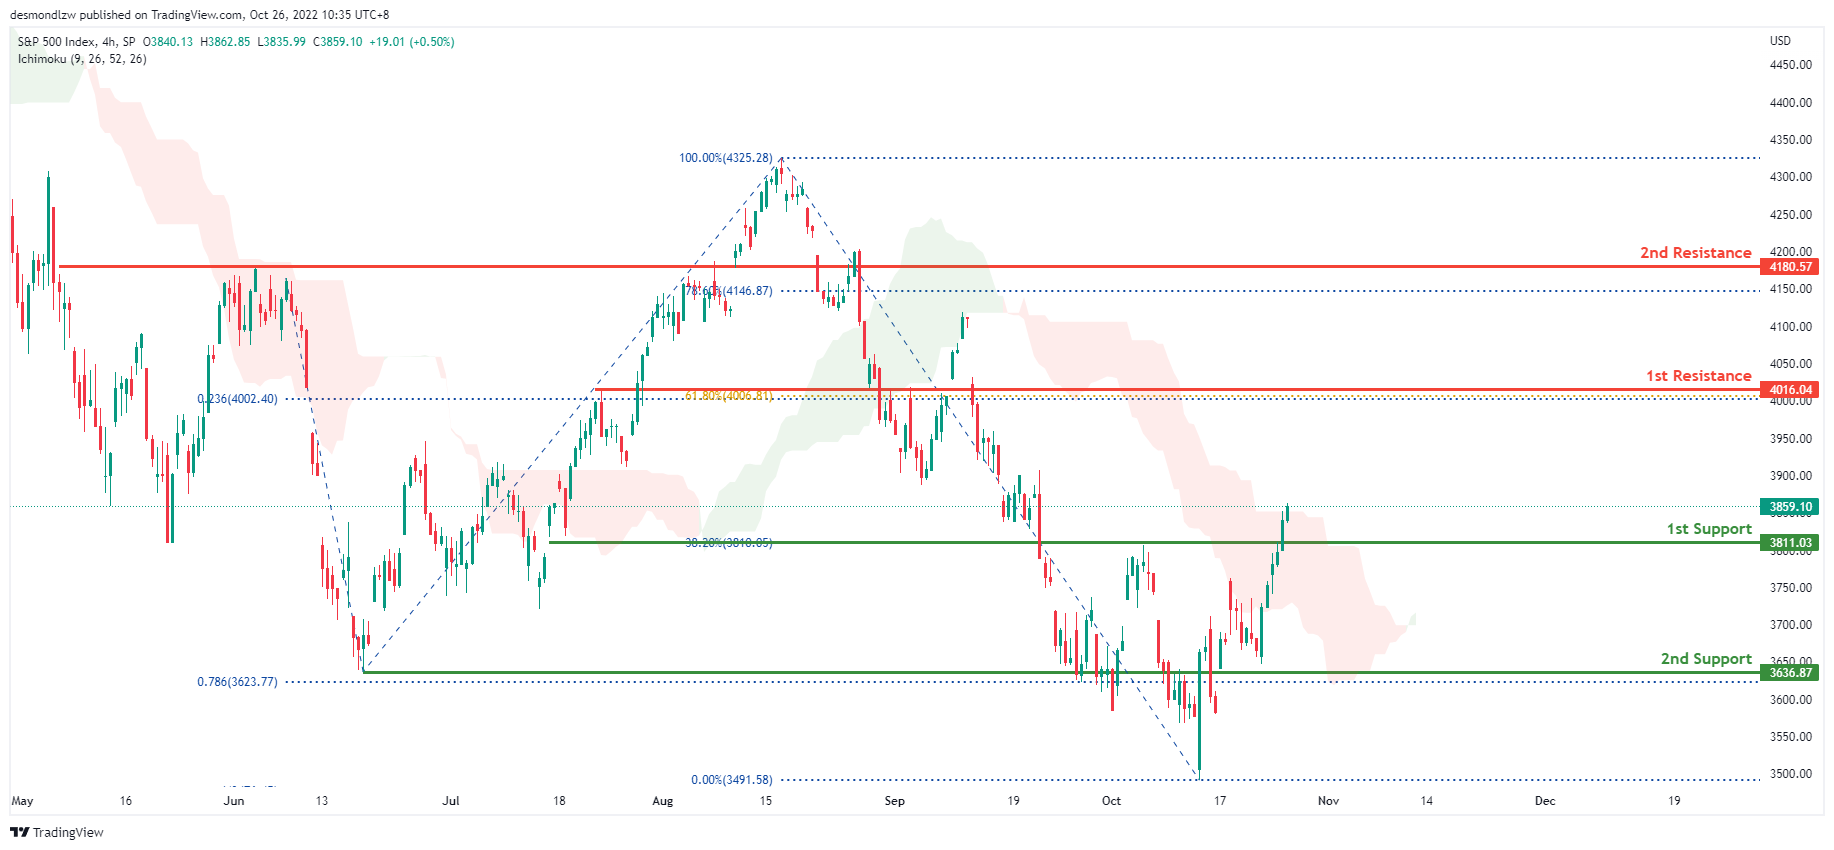
S&P 500:
On the H4 chart, the overall bias for S&P500 is bearish. However overnight, price had a massive bullish momentum upwards due to the weakening of the DXY, with price closing above the Ichimoku cloud which might indicate a change to bullish momentum. Price is currently above the 1st support at 3811.03 where the 38.2% Fibonacci line is located. If this bullish momentum continues, expect price to possibly head towards the 1st resistance at 4016.04 where the 61.8% Fibonacci line and 23.6% Fibonacci projection line is located.
Areas of consideration:
- H4 time frame, 1st support at 3811.03
- H4 time frame, 1st resistance at 4016.04


