
USD/JPY:
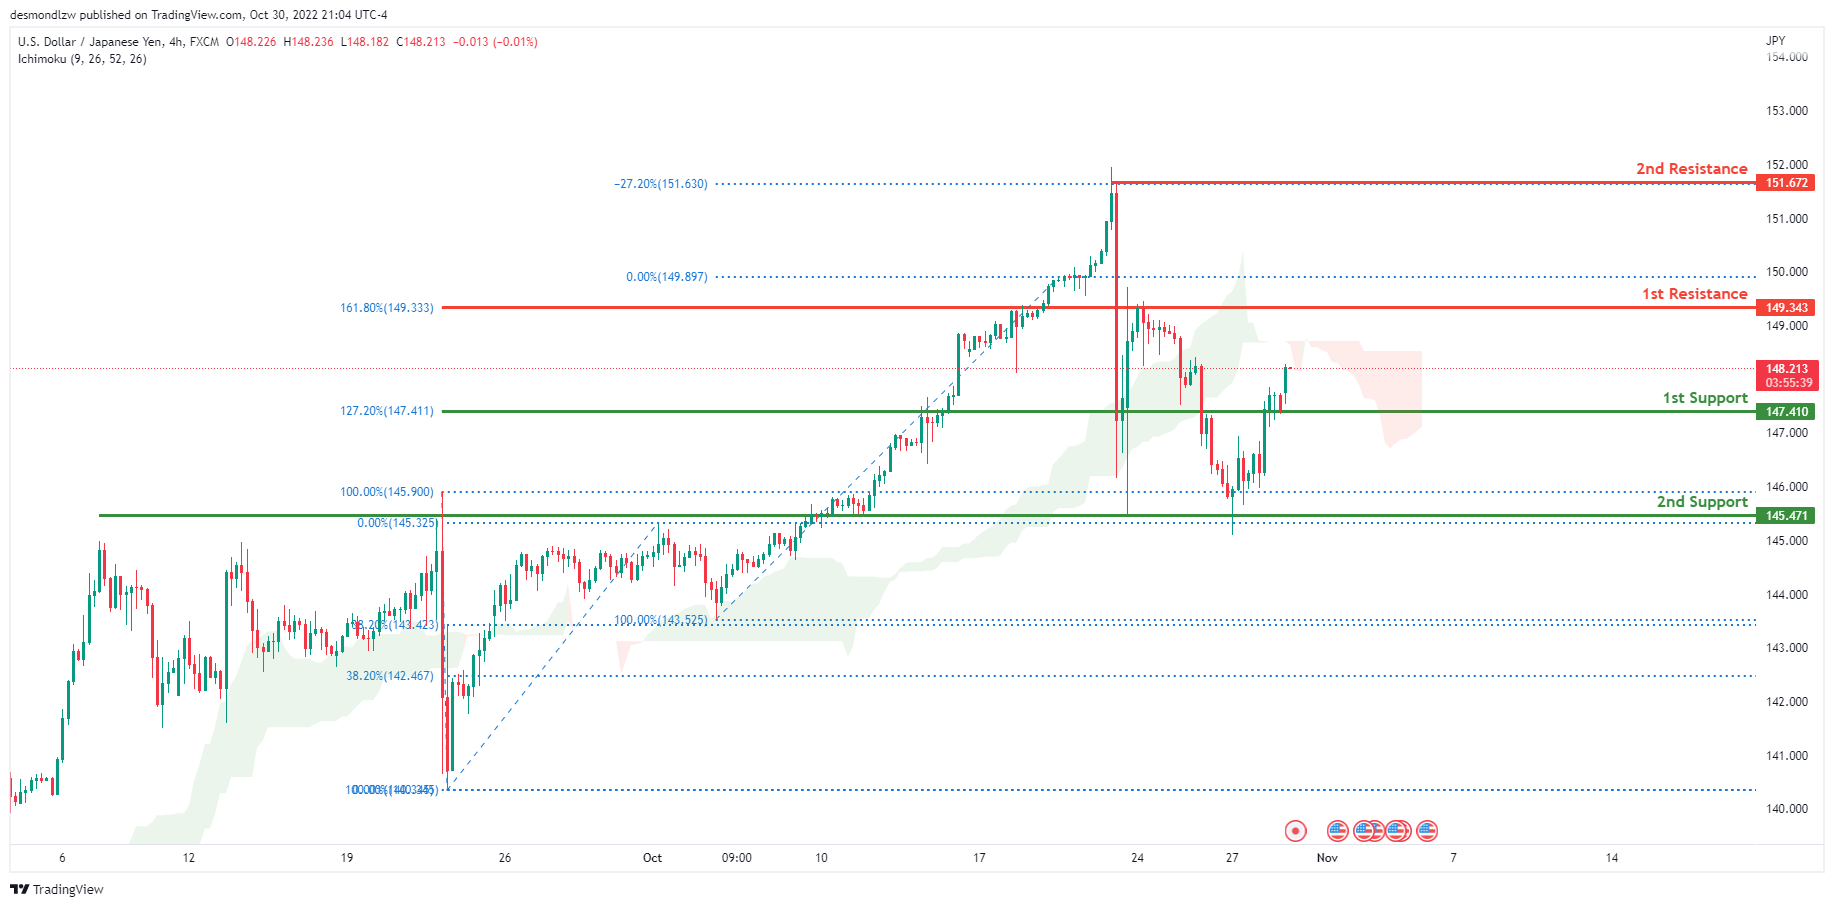
The current general bias for USDJPY on the H4 chart is bullish. Towards the end of last week, USDJPY had some bullish momentum upwards due to the strengthening of the DXY. Price is currently trading above the support at 148.214. If this bullish momentum continues, expect USDJPY to head upwards and retest the 1st resistance at 149.343 where the 161.8% Fibonacci extension line is located.
Areas of consideration:
- H4 time frame, 1st resistance at 149.343
- H4 time frame, 1st support at 147.410
DXY:
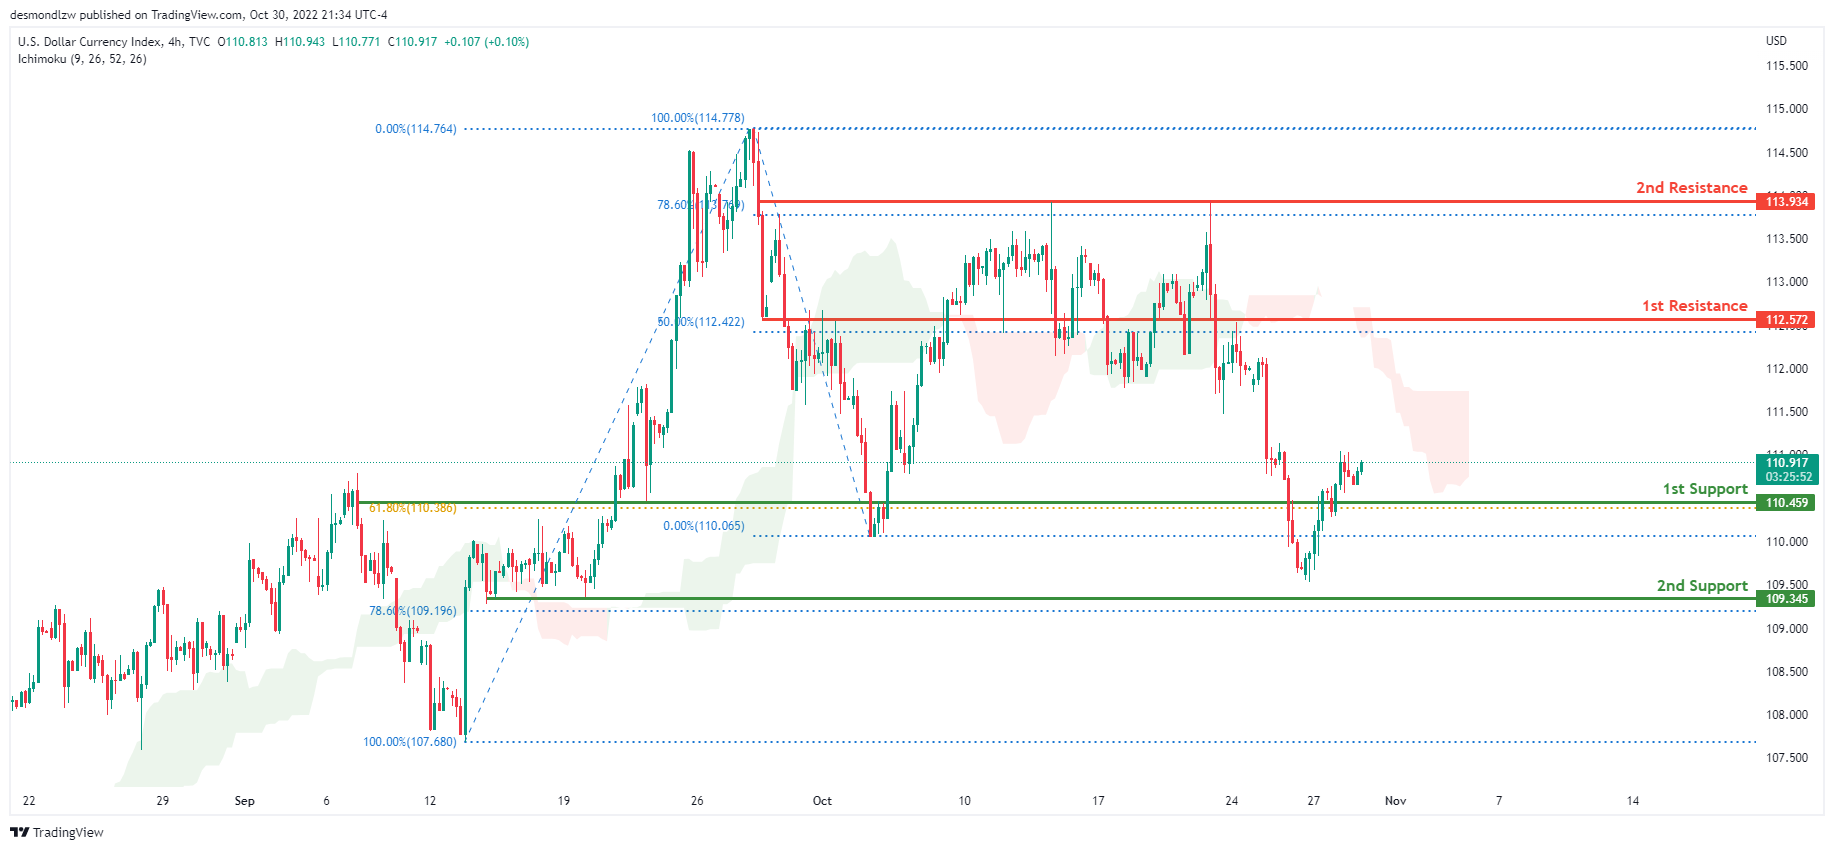
On the H4 chart, the overall bias for DXY is bearish. To add confluence to this, the price is below the Ichimoku cloud which indicates a bearish market. Towards the end of last week, DXY had bullish momentum going above the 1st support at 110.459 where the 61.8% Fibonacci line is located and is currently trading above it. If this bearish momentum continues, expect price to possibly head towards the 2nd support at 109.340, where the 78.6% Fibonacci line is located.
Areas of consideration:
- H4 time frame, 1st resistance at 112.572
- H4 time frame, 1st support at 110.459
EUR/USD:
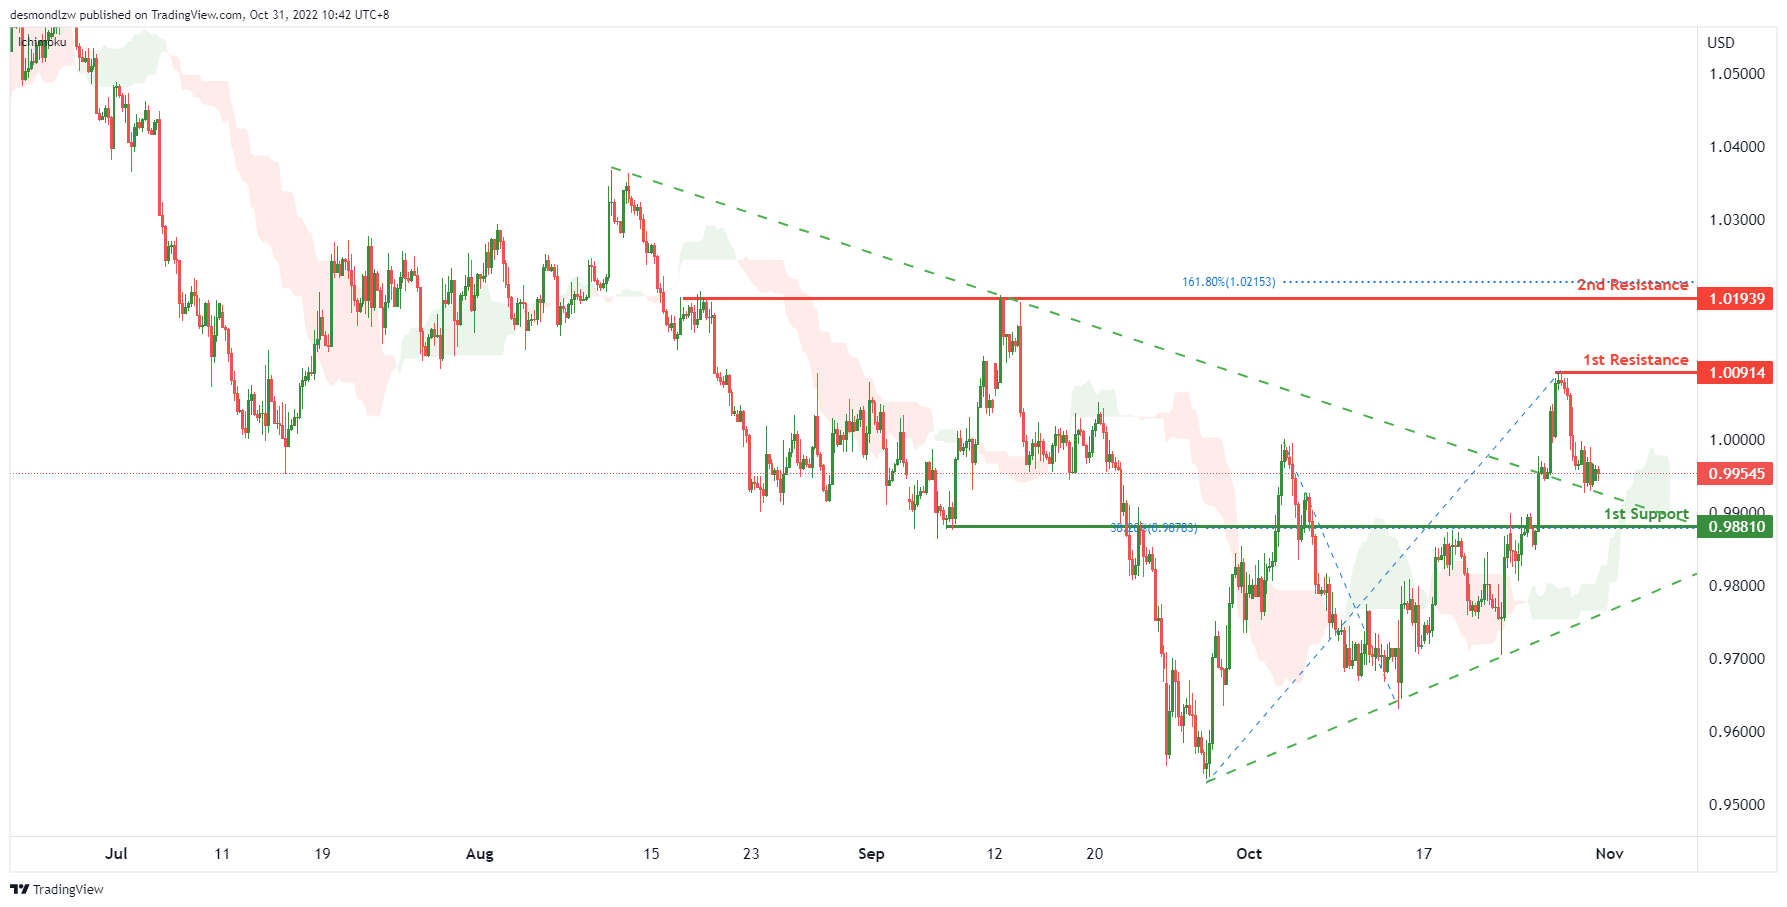
On the H4, price is dropping to the long term descending trendline, the price may drop to the 1st support at 0.98810, which is in line with the 38.2% fibonacci retracement and overlap support. Alternatively, as the price is above ichimoku cloud and short term ascending trendline, we can expect the price to rise to the 1st resistance at 1.00914, which is in line with the previous swing high. If the 1st resistance is broken, the 2nd resistance is at 1.01939, where the 161.8% fibonacci extension and previous swing highs are.
Areas of consideration :
- H4 1st support at 0.98810
- H4 1st resistance at 1.00914
GBP/USD:
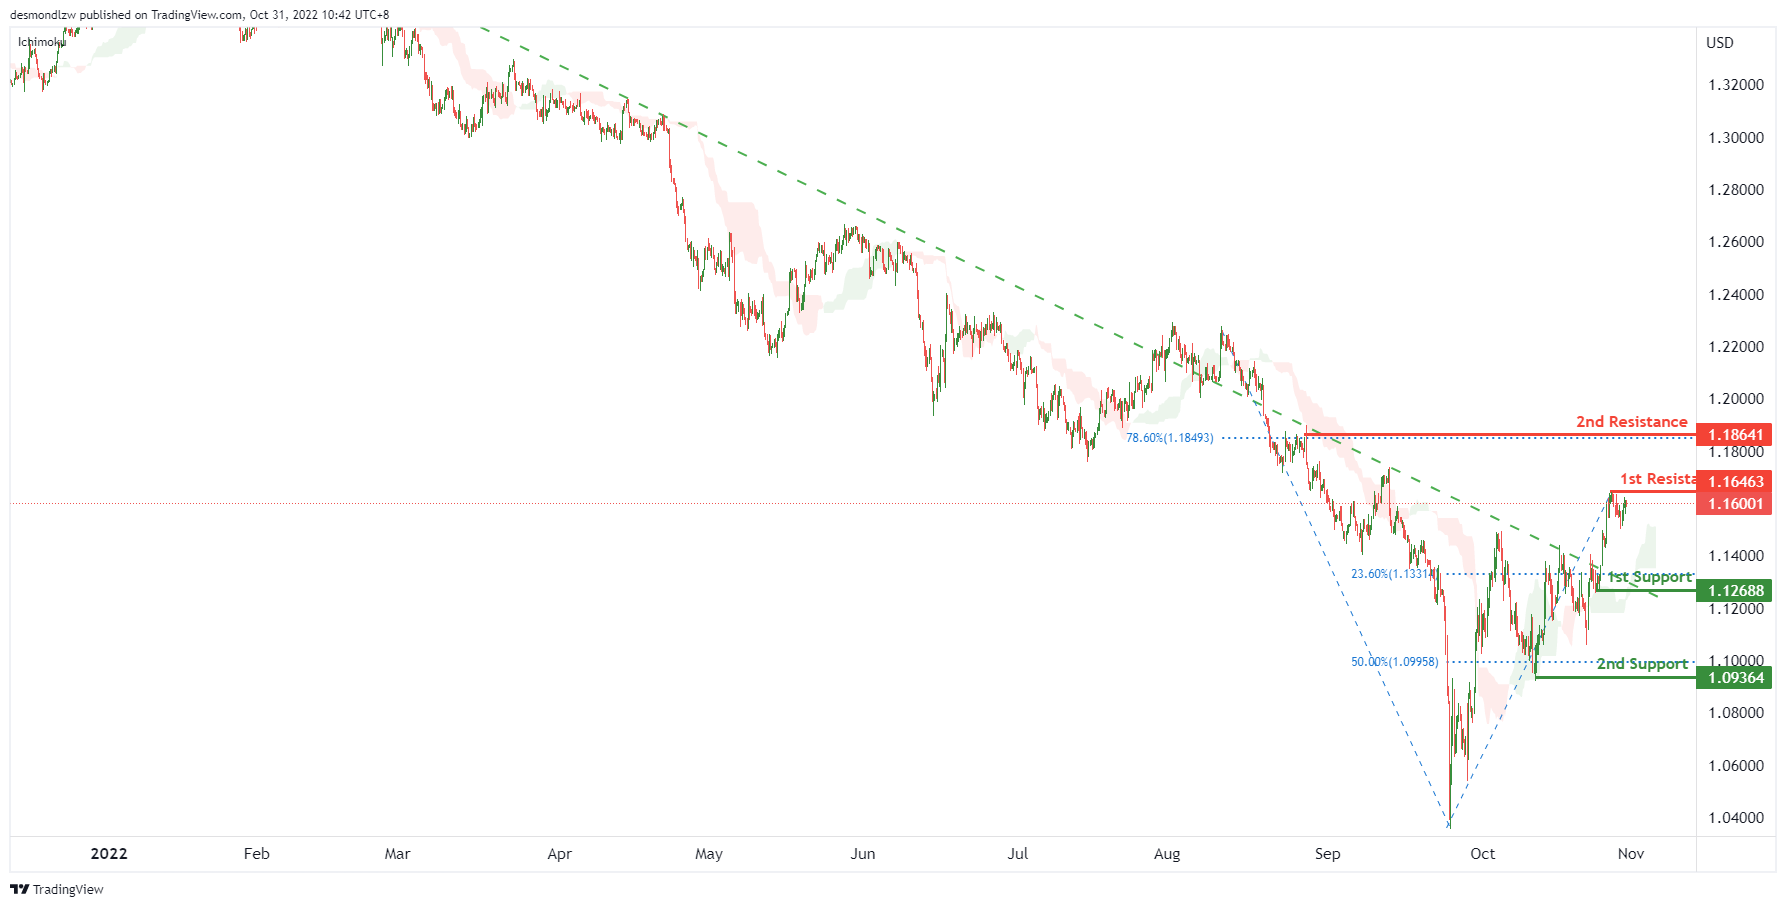
On the H4, price is crossing the ichimoku cloud and breaking the descending trendline, we have a bullish bias that the price may test the 1st resistance at 1.16463, which is in line with the previous swing high. If the 1st resistance is broken, the 2nd resistance is at 1.18641, where the 78.6% fibonacci retracement sits. Alternatively, the price may drop to the 1st support at 1.12688, where the swing low support and 23.6% fibonacci retracement are. If the 1st support is broken, the 2nd support is at 1.09364, which is in line with the 50% fibonacci retracement.
Areas of consideration:
- H4 1st resistance at 1.16463
- H4 2nd resistance is at 1.18641
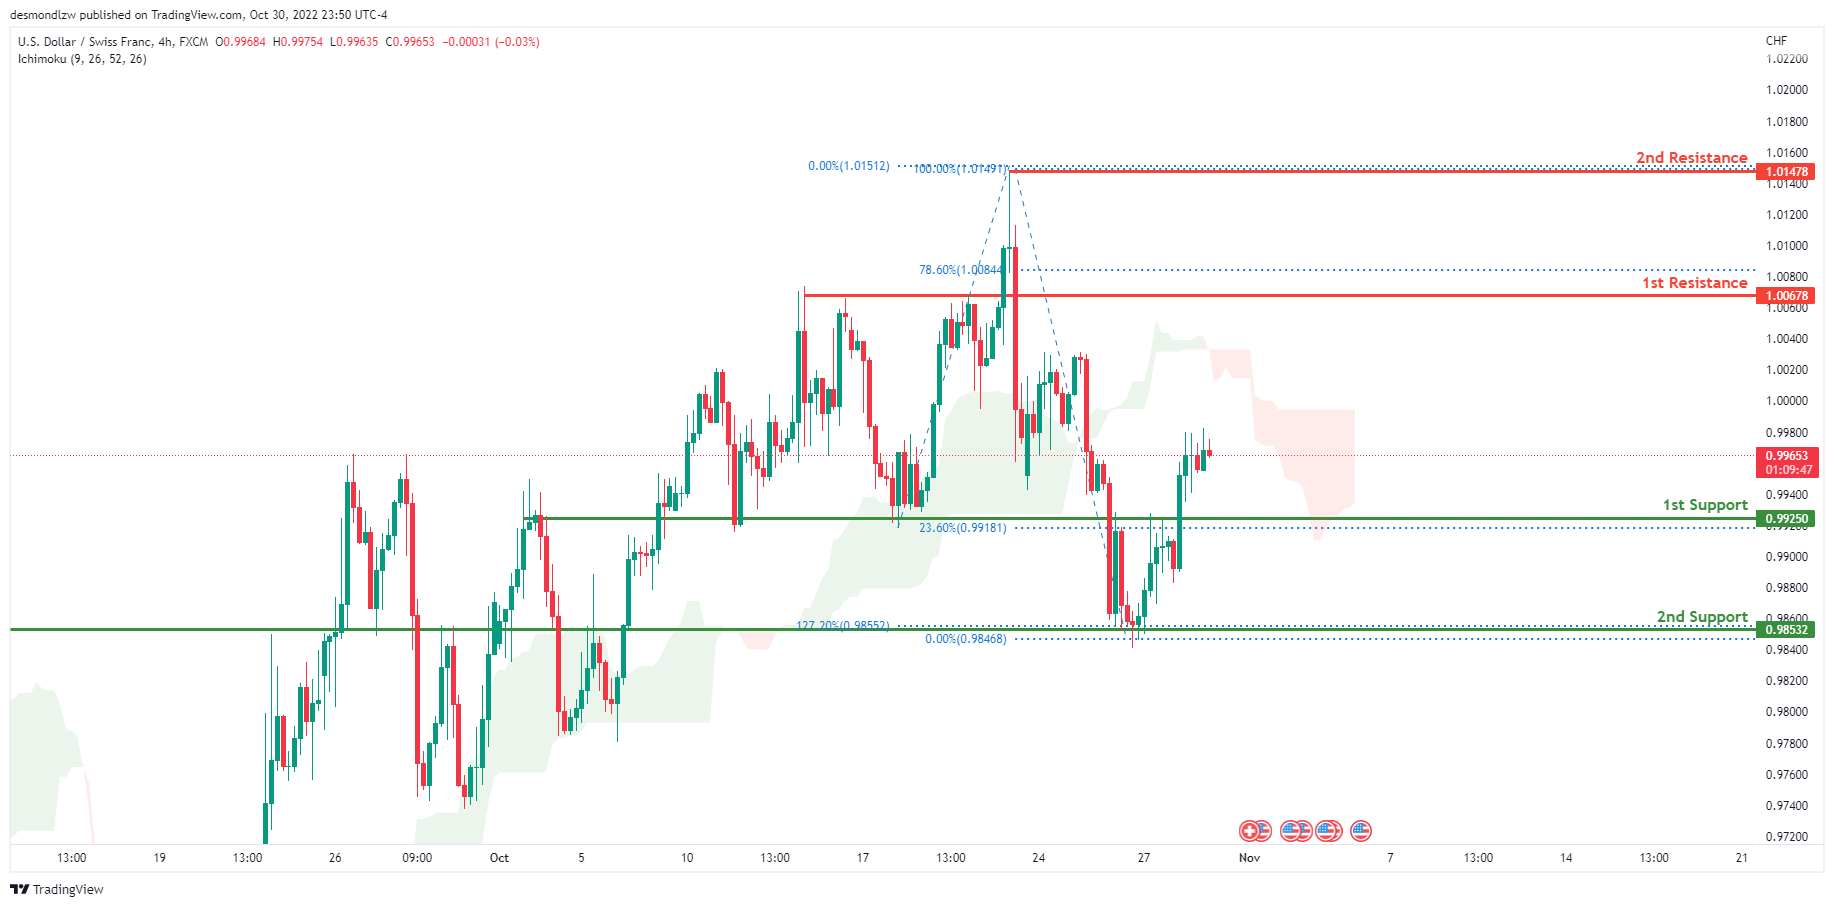
USD/CHF:
On the H4 chart, the overall bias for USDCHF is bearish. To add confluence to this, the price is below the Ichimoku cloud which indicates a bearish market. Towards the end of last week, USDCHF had some bullish momentum with price bouncing off the 2nd support at 0.98532 with price currently trading above the 1st support at 0.99250 where the 23.6% Fibonacci line is located. Expecting price to possibly head back up to retest the 1st resistance line at 1.00678 where the 78.6% Fibonacci line is located.
Areas of consideration
- H4 1st support at 0.99250
- H4 2nd support at 0.98532
- H4 1st resistance at 1.00678
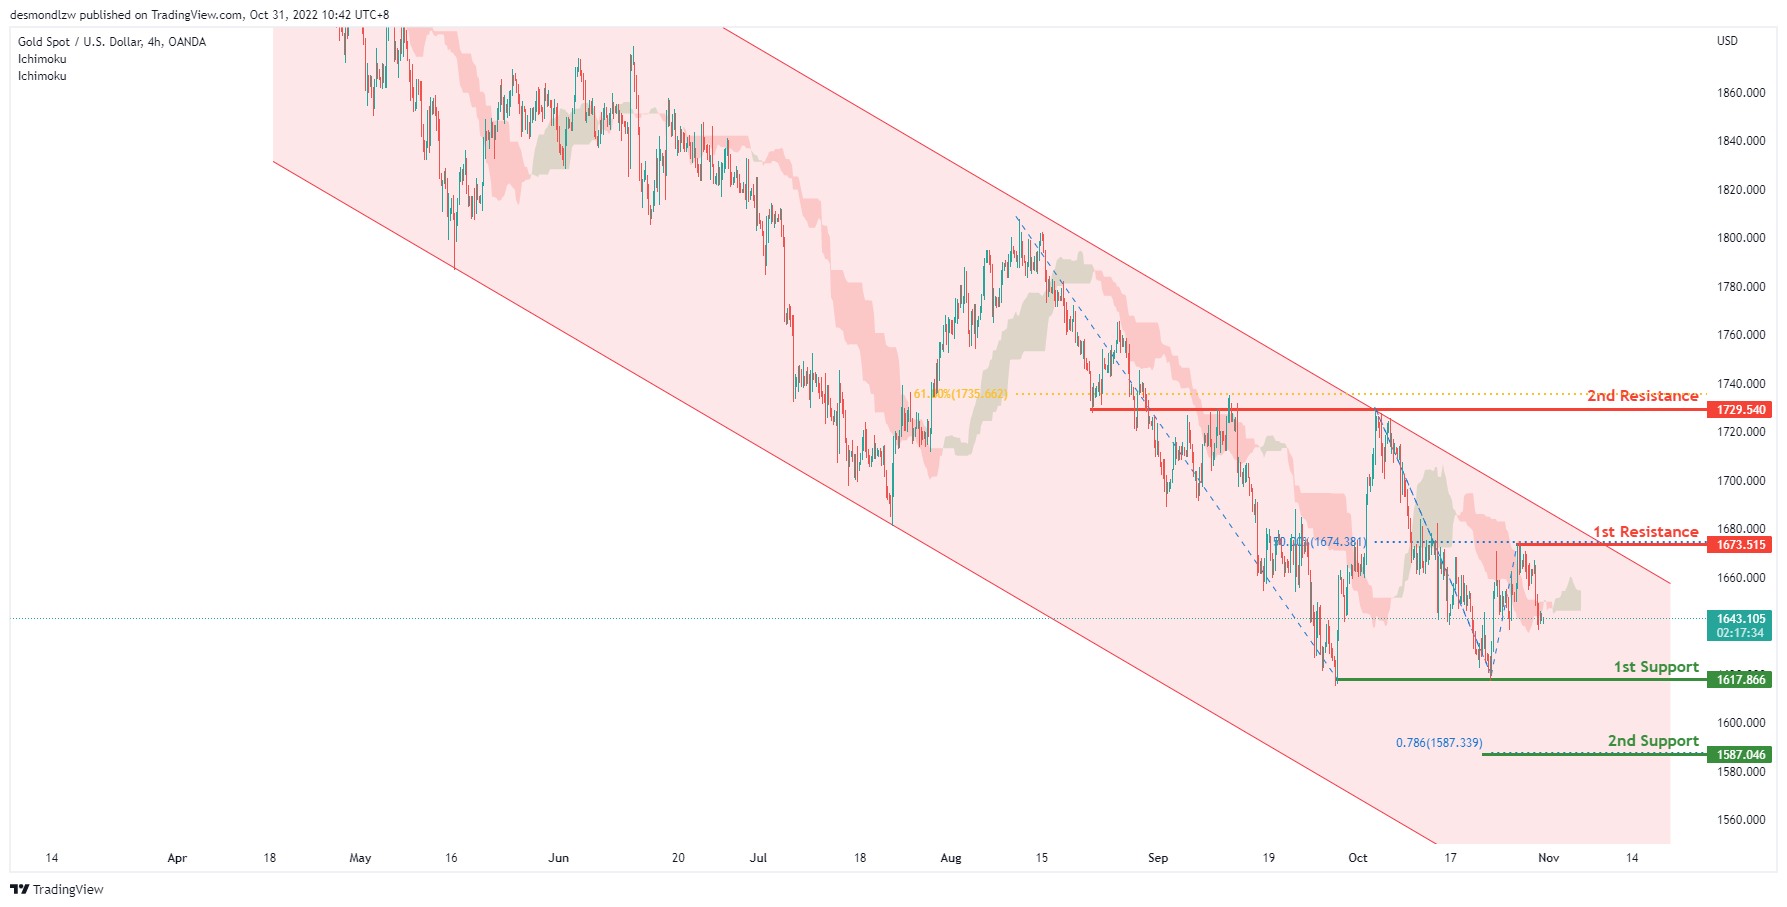
XAU/USD (GOLD):
On H4, with the price within the descending channel and crossing ichimoku cloud, we have a bearish bias that the price may drop to test the 1st support at 1617.866, where the previous swing lows are. If the 1st support is broken, the 2nd support could be at 1587.046, which is in line with the 78.6% fibonacci projection. Alternatively, the price may rise to retest the 1st resistance at 1673.515, which is in line with the 50% fibonacci retracement and previous swing high. If the 1st resistance is broken, the 2nd resistance is at 1729.540, where the 61.8% fibonacci retracement and previous swing high are.
Areas of consideration:
- H4 time frame, 1st resistance at 1673.515
- H4 time frame, 1st support at 1617.866
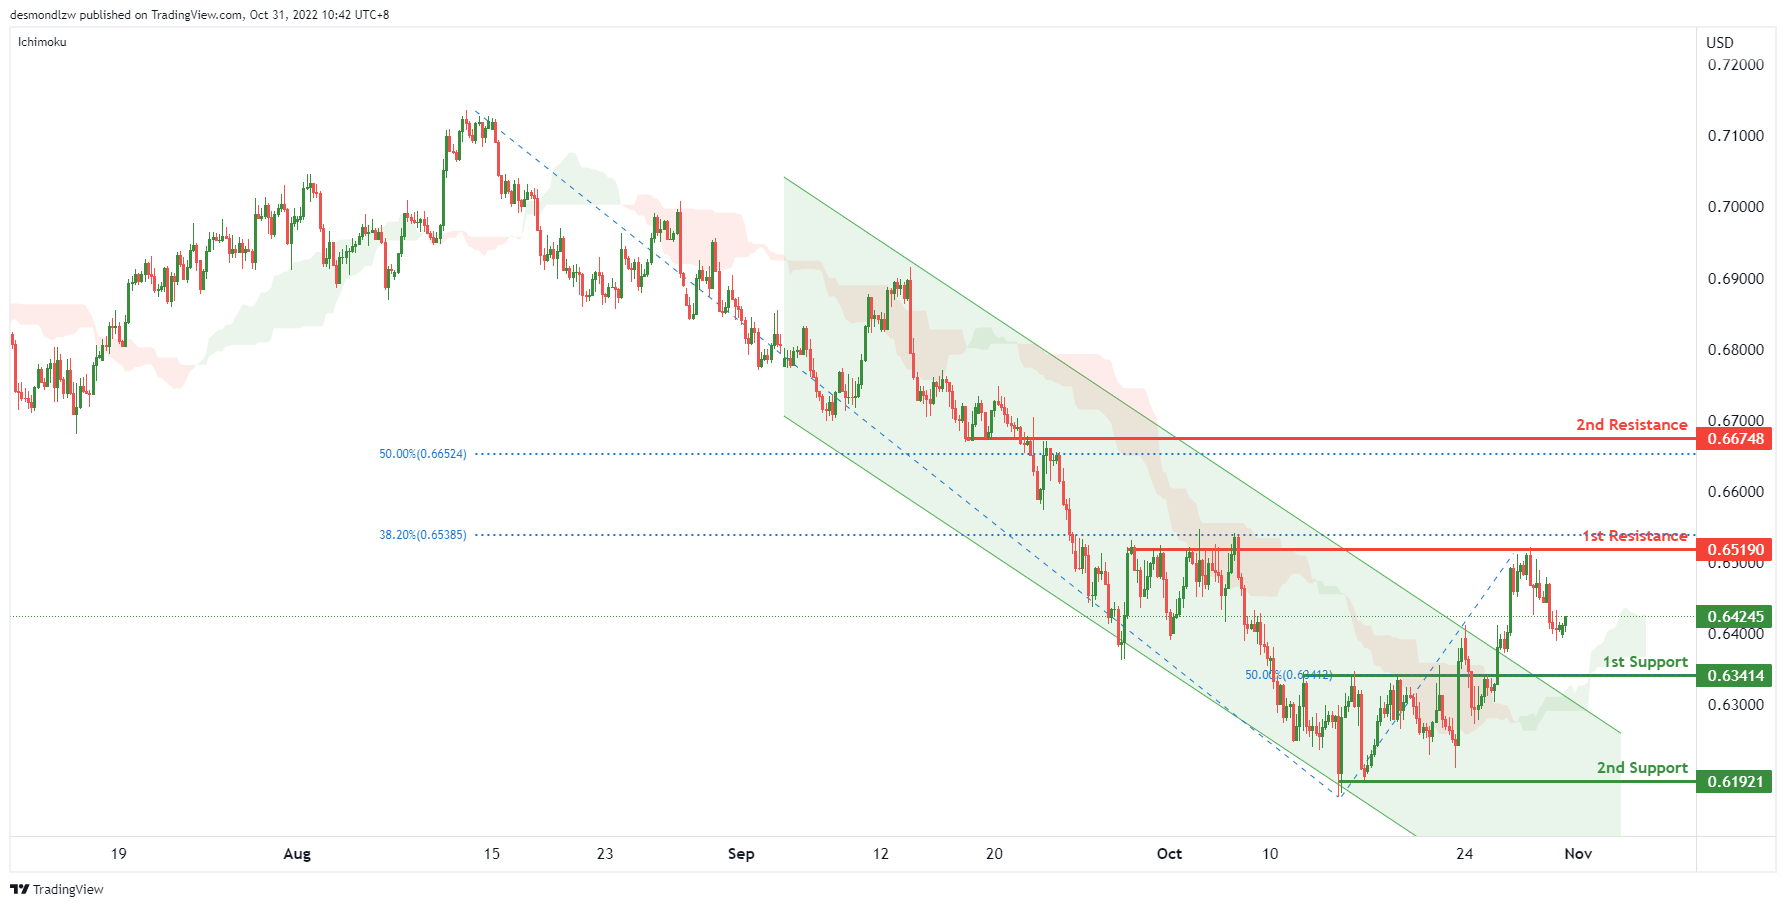
AUD/USD:
On the H4, with the price breaking the descending channel and above ichimoku cloud, we have a bullish bias that the price may retest the 1st resistance at 0.65190, which is in line with the overlap resistance, if the 1st resistance is broken, the 2nd resistance is at 0.66748, where the 50% fibonacci retracement is. Alternatively, the price may drop to the 1st support at 0.63414, which is in line with the 50% fibonacci retracement. If the 1st support is broken, the price may drop to the 2nd support at 0.61921, where the previous swing low is.
Areas of consideration
- H4, 1st resistance at 0.65190
- H4, 1st support at 0.63414
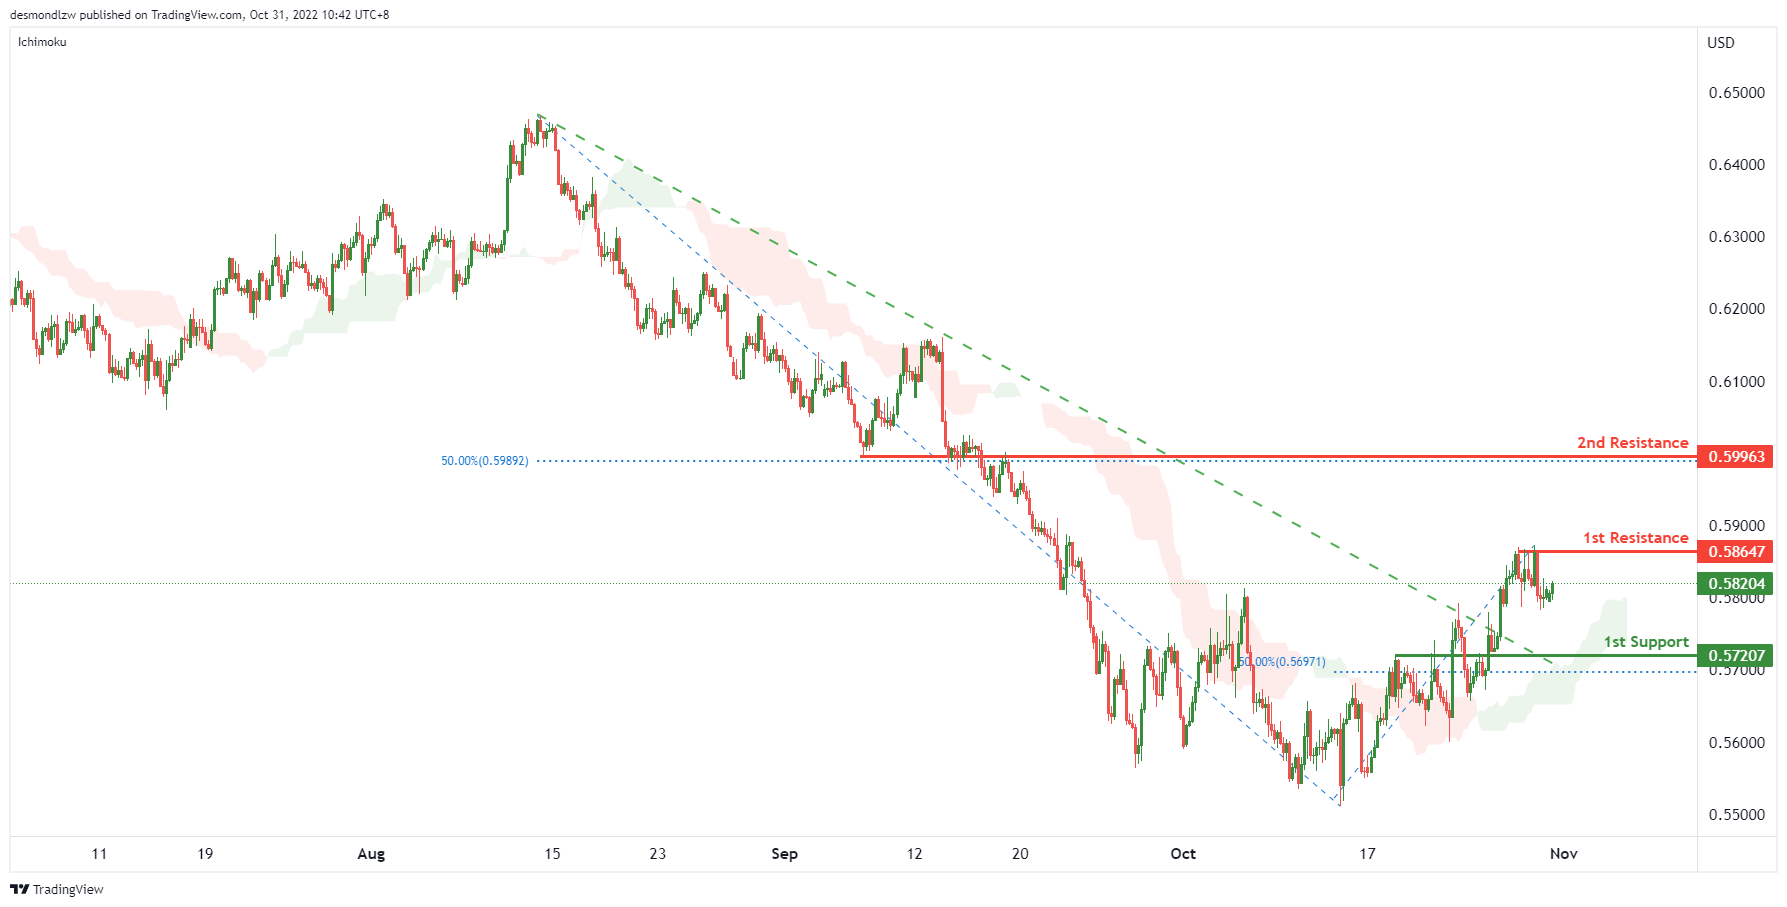
NZD/USD:
On the H4 chart, as the price is breaking the descending trendline and the price is above ichimoku cloud, we have a bullish bias that the price may rise to the 1st resistance at 0.58647, which is in line with the previous swing high. If the 1st resistance is broken, the 2nd resistance is at 0.59963, where the 50% fibonacci retracement is. Alternatively, the price may drop to the 1st support at 0.57207, where the previous swing low and 50% fibonacci retracement are.
Areas of consideration:
- H4 time frame, 1st resistance at 0.58647
- H4 time frame, 2nd resistance is at 0.59963
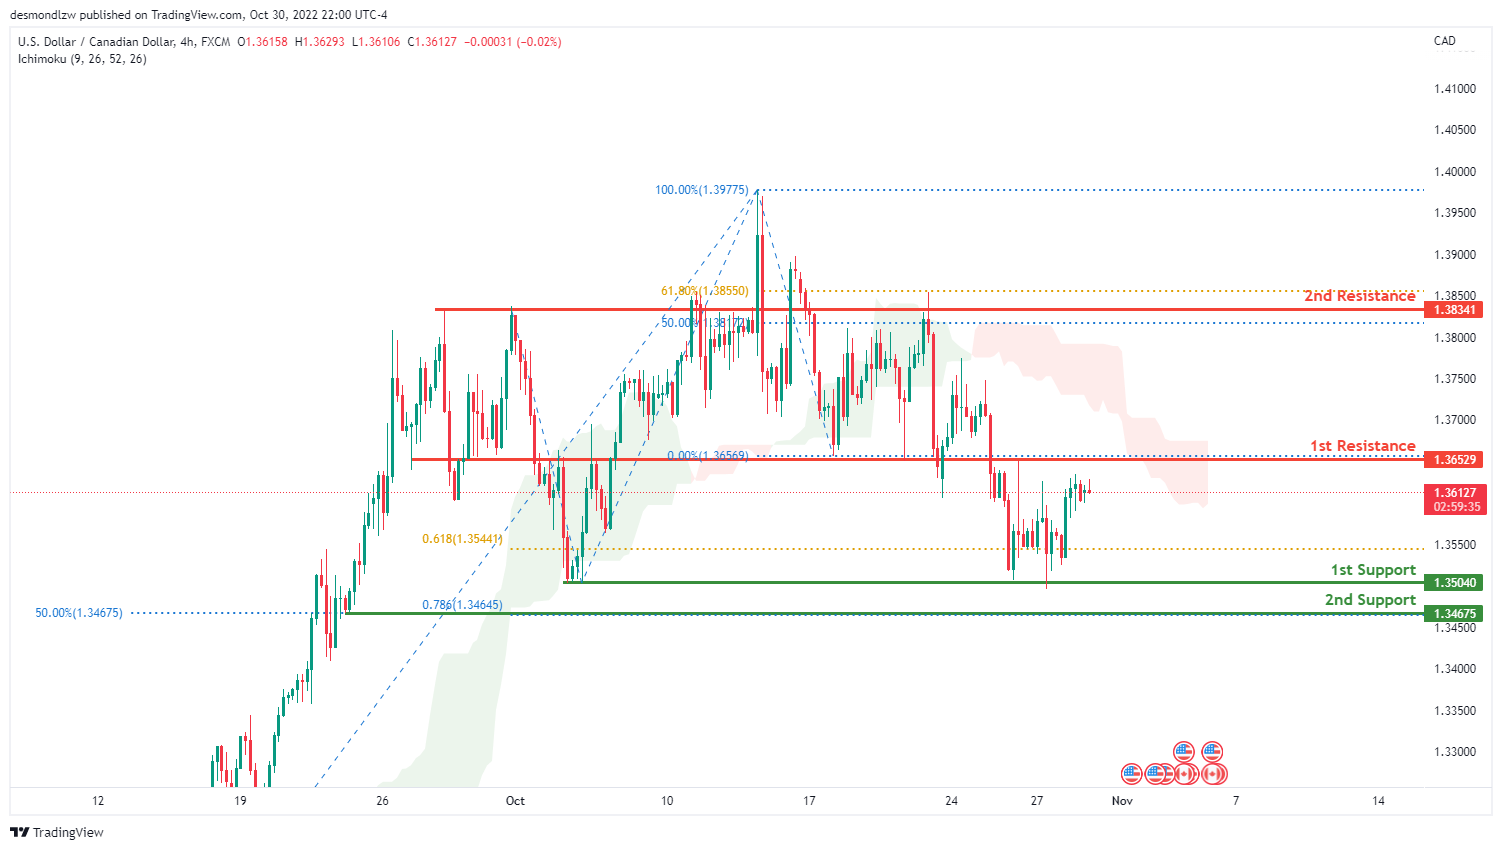
USD/CAD:
On the H4 chart, the overall bias for USDCAD is bearish. To add confluence to this, the price is below the Ichimoku cloud which indicates a bearish market. Towards the end of last week, price reflected off the 1st support at 1.35029 where the previous low is. If this bearish momentum continues, expect price to break the 1st support and head towards the 2nd support at 1.34675 where the -61.8% Fibonacci expansion line and 50% Fibonacci line is located.
Areas of consideration:
- H4 time frame, 1st resistance at 1.36751
- H4 time frame, 1st support at 1.35029
- H4 time frame, 2nd support at 1.34675
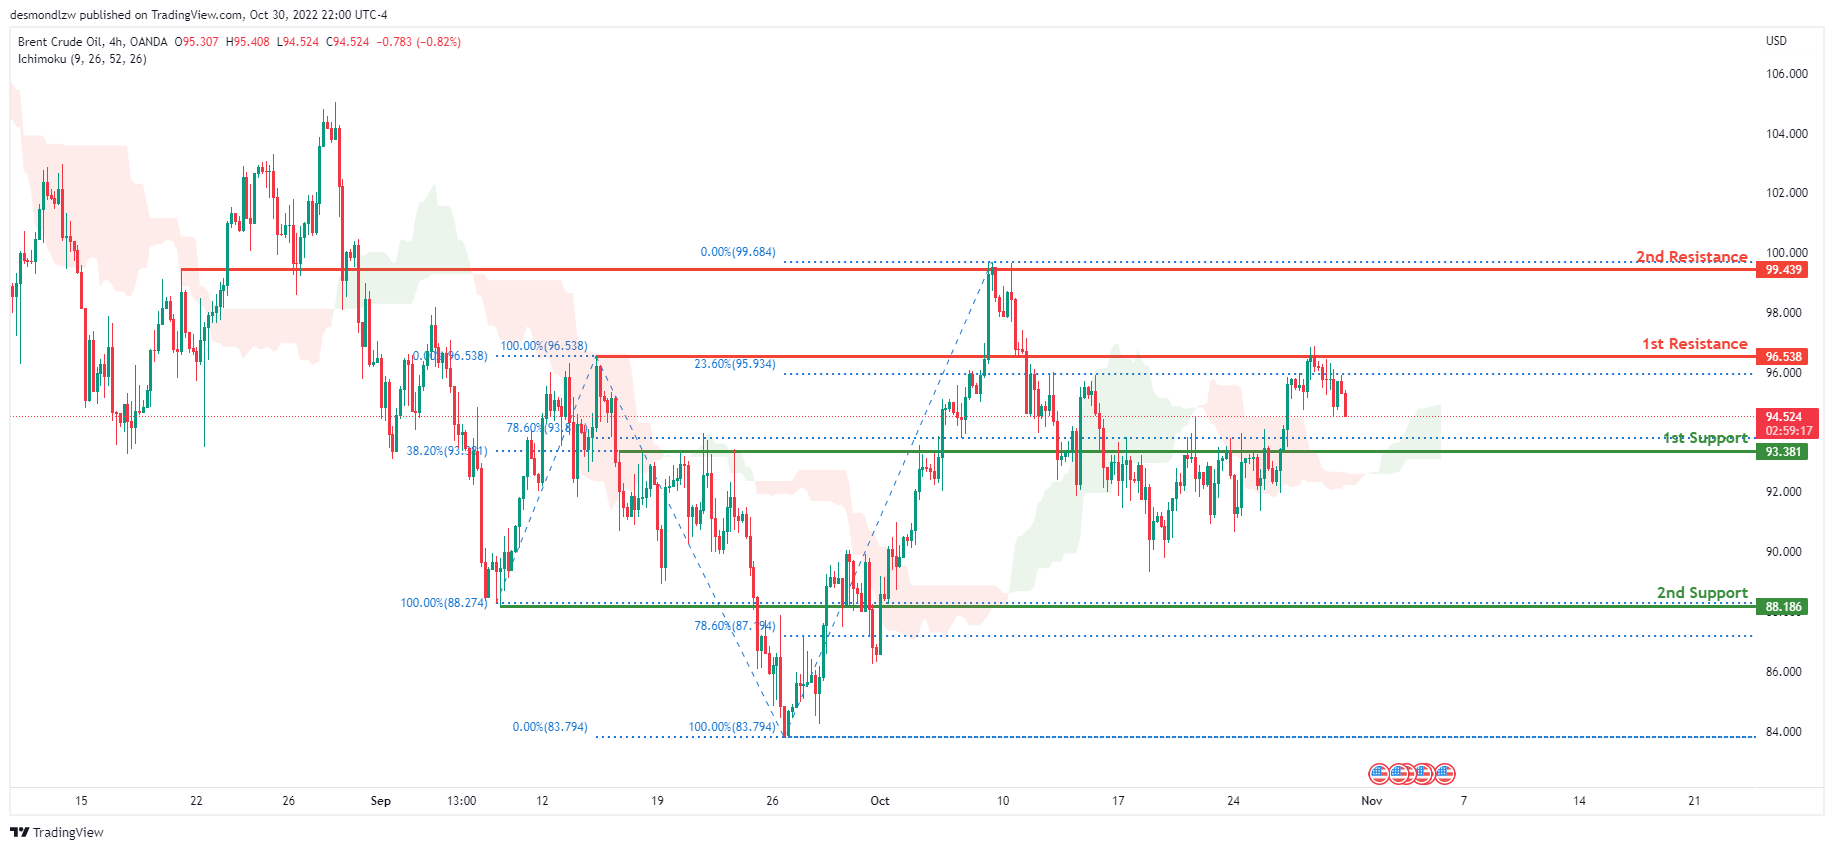
OIL:
Looking at the H4 chart, the current overall bias for Oil is bullish. To add confluence to this, the price is above the Ichimoku cloud which indicates a bullish market. Towards the end of last week, price reflected off the 1st resistance line at 96.538 where the 100% and 23.6% Fibonacci lines are. If this bullish momentum continues, expect price to possibly break above the 1st resistance and head towards the 2nd resistance at 99.439 where previous swing high and 0% Fibonacci line is located.
Areas of consideration:
- H4 time frame, 1st resistance at 93.381
- H4 time frame, 2nd resistance at 99.439
- H4 time frame, 1st support at 93.381
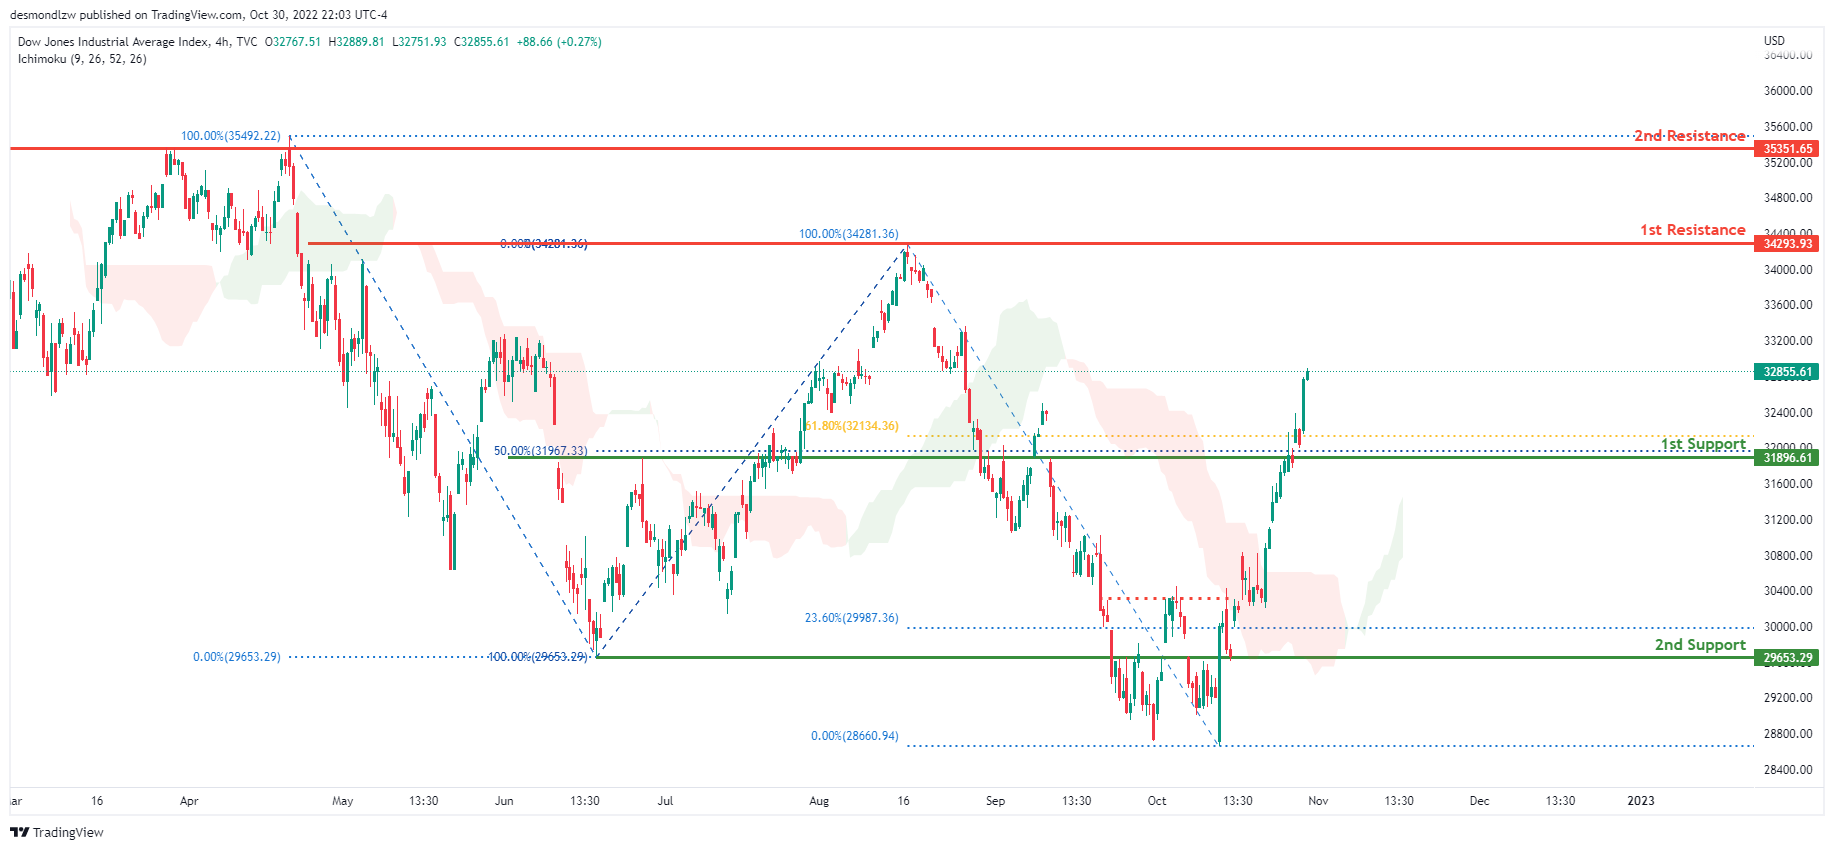
Dow Jones Industrial Average:
On the H4 chart, the overall bias for DJI is bullish. To add confluence to this, the price is above the Ichimoku cloud which indicates a bullish market. Towards the end of last week, price had massive bullish momentum upwards due to the weakening of the DXY. Price has closed above the 1st support at 31896.61, where the 61.8% and 50% Fibonacci lines are. If this bullish momentum continues, expect the price to possibly head towards the 1st resistance at 34293.93 where the previous swing high and 100% Fibonacci line is located.
Areas of consideration:
- H4 time frame, 1st support at 31896.61
- H4 time frame, 1st Resistance at 34293.93
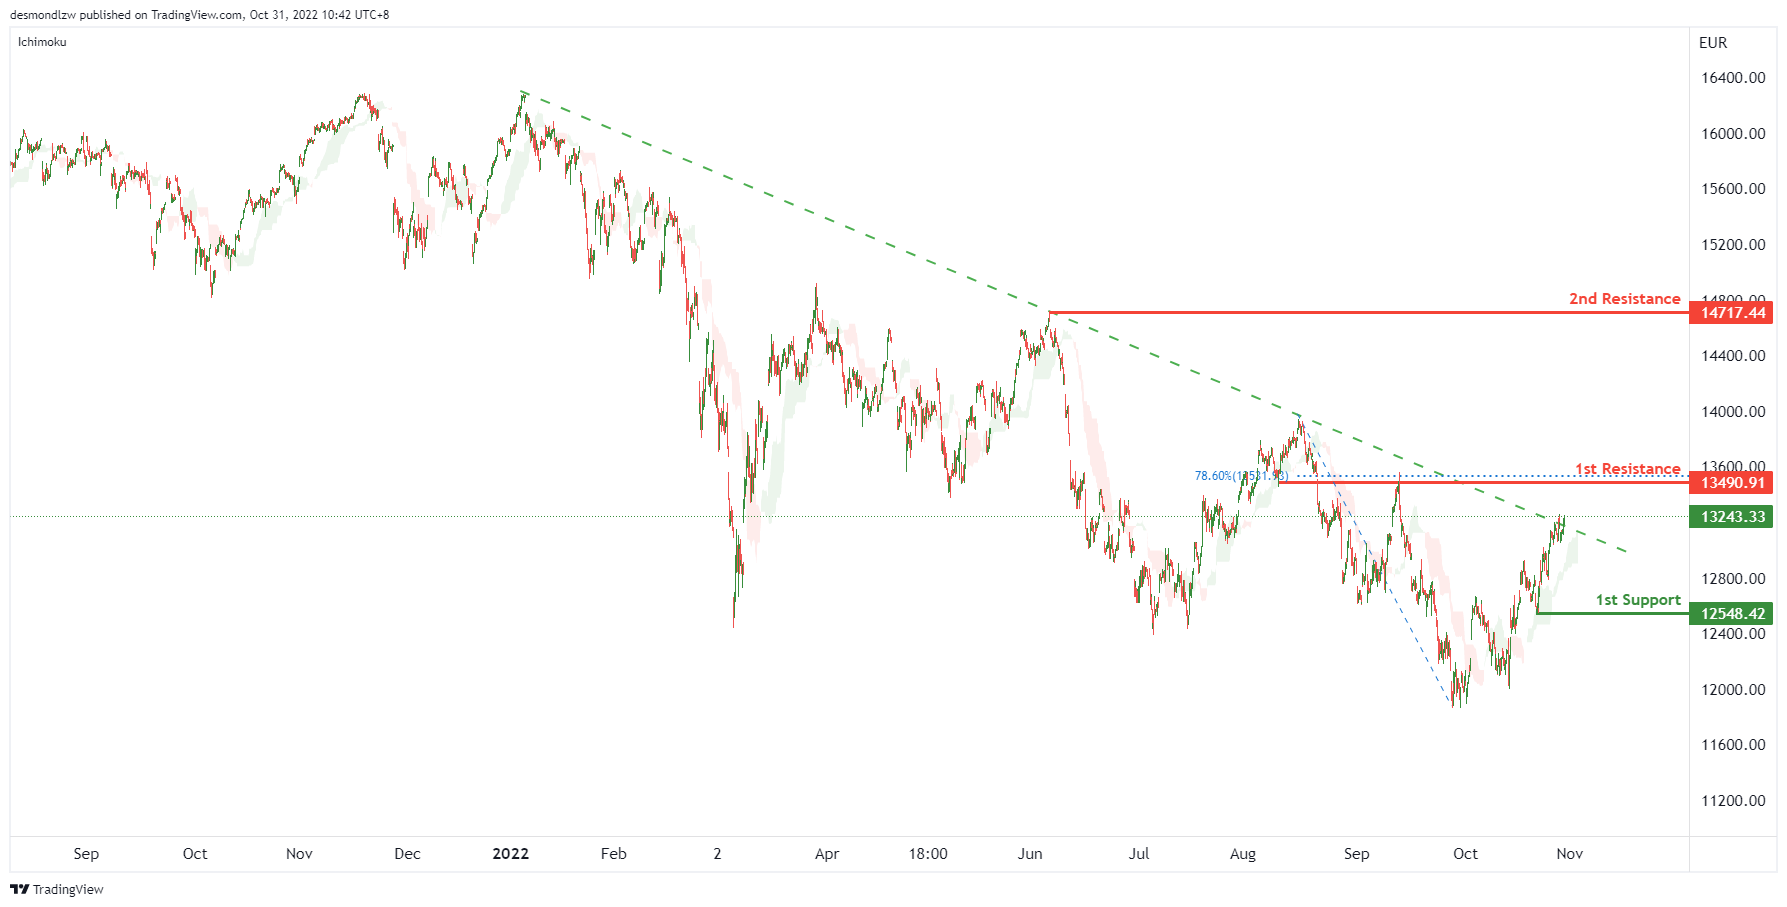
DAX:
On the H4 chart, the price has now closed above the Ichimoku cloud which indicates a breakout of a descending trendline. Expecting price to possibly continue this bullish momentum and head towards the 1st resistance at 13490.91, where the 78.6% Fibonacci line is located. If the 1st resistance is broken, the 2nd resistance could be at 14717.44, which is in line with the previous swing high. Alternatively, the price may drop to the 1st support at 12548.42, which is in line with the swing low.
Areas of consideration:
- H4 time frame, current price
- H4 time frame, 1st resistance at 13490.91
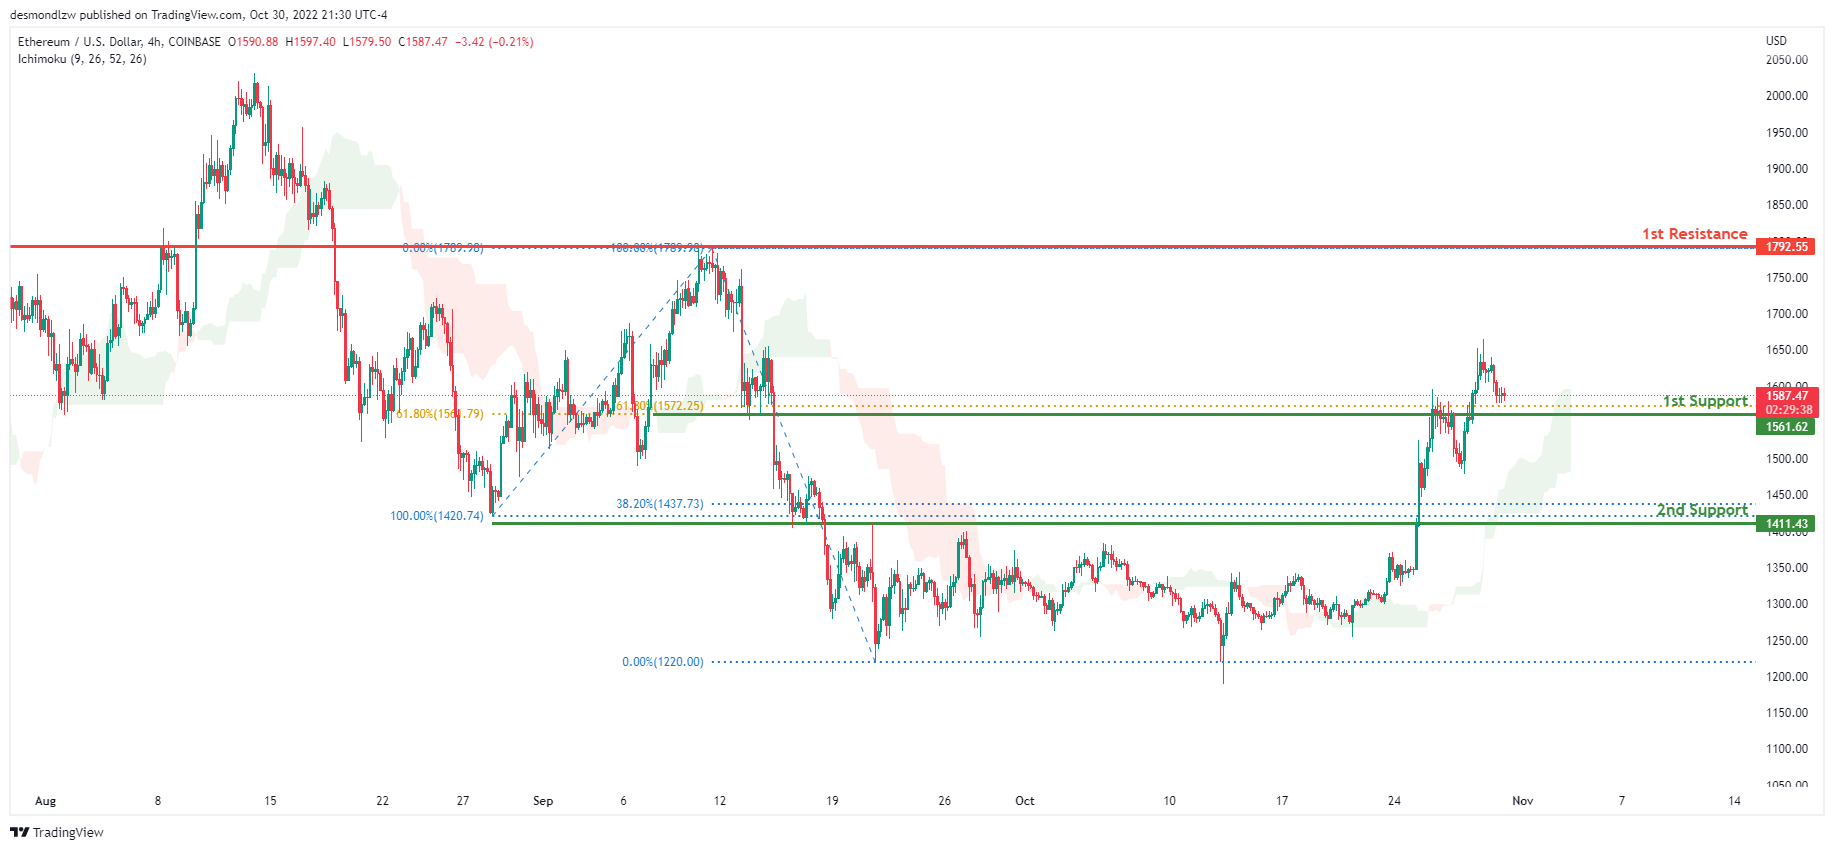
ETHUSD:
Looking at the H4 chart, the current overall bias for ETHUSD is bullish. To add confluence to this, the price is above the Ichimoku cloud which indicates a bullish market. Over the last week, price had bullish momentum upwards with the price currently trading above the 1st support level at 1561.62 where 2 of the 61.8% Fibonacci lines are located. If this bullish momentum continues, expect the price to head towards the 1st resistance at 1792.55 where the previous swing high and 100% Fibonacci line is located.
Areas of consideration:
- H4 time frame, 1st resistance of 1792.55
- H4 time frame, 1st support at 1561.62
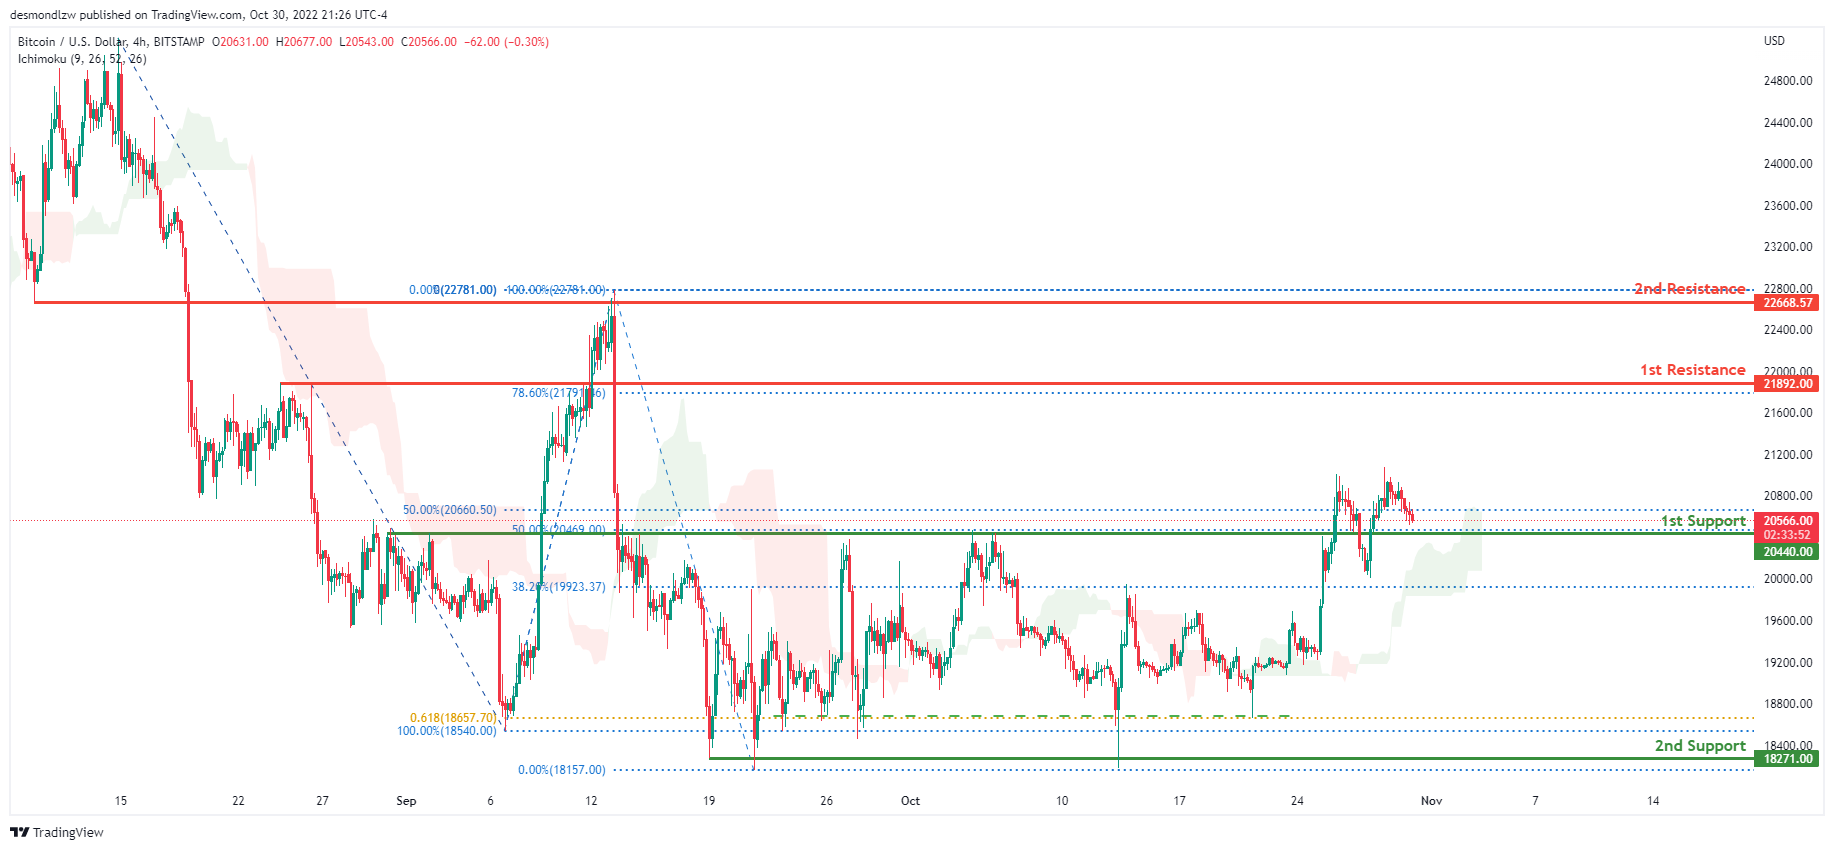
BTCUSD:
On the H4 chart, the overall bias for BTCUSD is bullish. To add confluence to this, the price is above the Ichimoku cloud which indicates a bullish market. Towards the 3nd of last week, price continued to consolidate along the 1st support at 20440.00 where the 2 of the 50% Fibonacci lines are located. If this bullish momentum continues, expect the price to head towards the 1st resistance at 21892.00, where the 78.6% Fibonacci line is located.
Areas of consideration:
- H4 time frame, 1st resistance 21892.00
- H4 time frame, 1st support at 20440.00
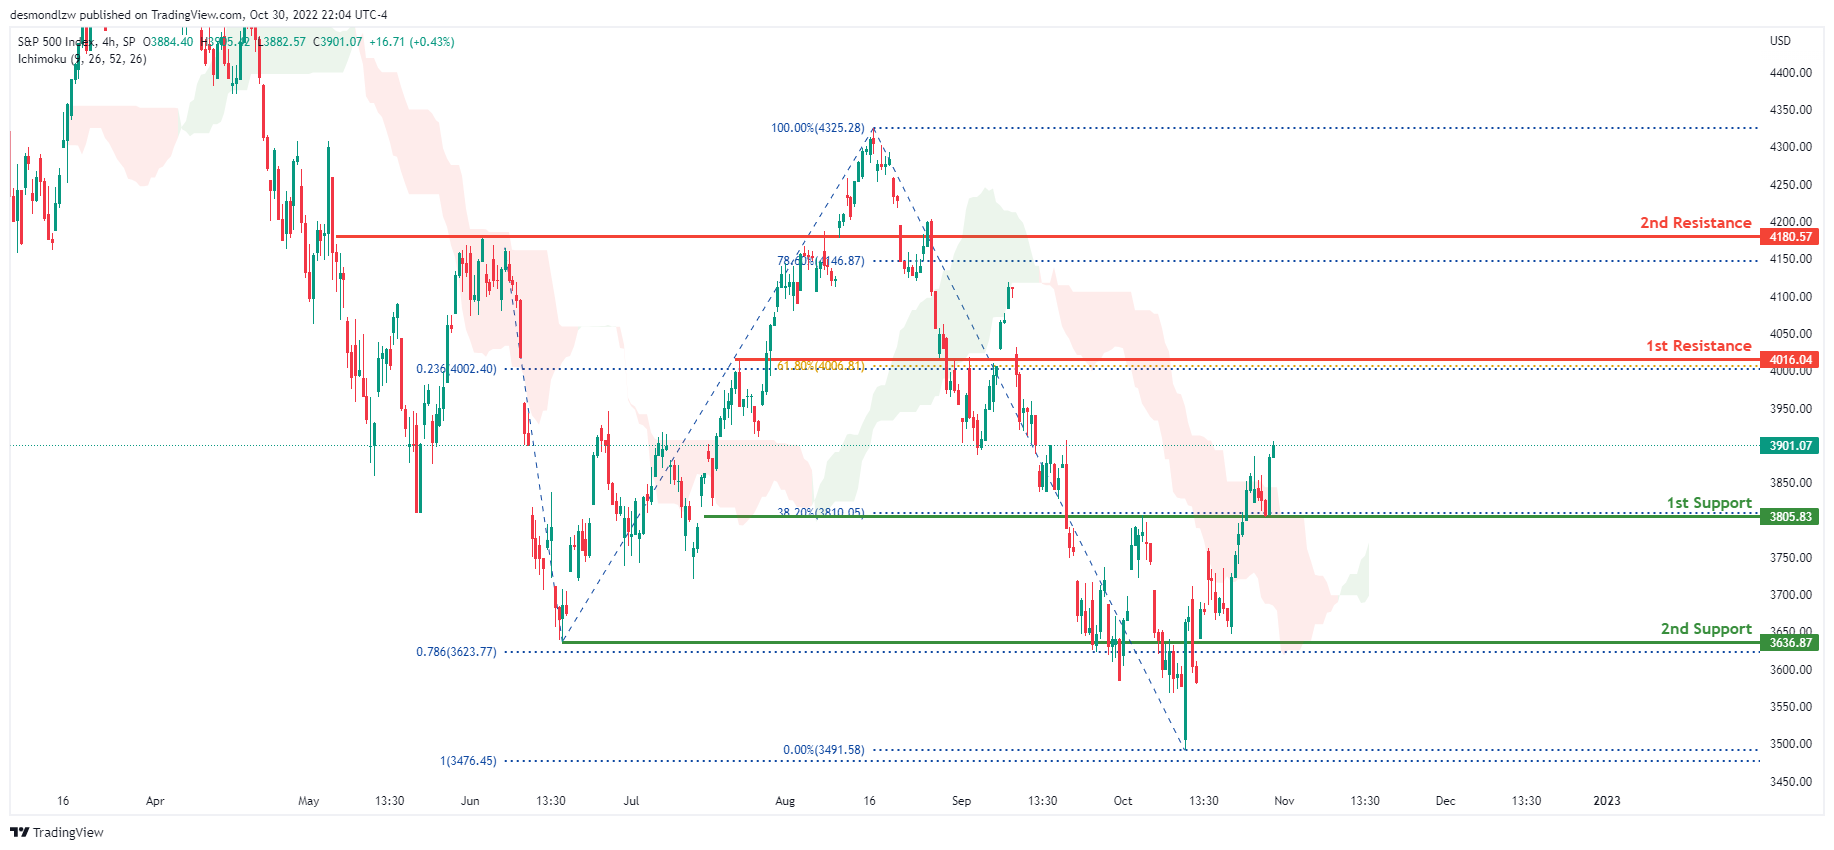
S&P 500:
On the H4 chart, the overall bias for S&P500 is bearish. However due to the weakening of the DXY, S&P500 had bullish momentum during the course of last week. Towards the end of last week, price reflected off the 1st support at 3805.83 where the 38.2% Fibonacci line is located. If this bullish momentum continues, expect price to possibly head towards the 1st resistance at 4016.04 where the 61.8% Fibonacci line and 23.6% Fibonacci projection line is located.
Areas of consideration:
- H4 time frame, 1st support at 3805.83
- H4 time frame, 1st resistance at 4016.04


