
EUR/USD
It was another rough start to the week for the EUR as the common currency was affected by political jitters in Spain. The Catalonian referendum, which resulted in hundreds injured as the central police clashed with local voters, revived concerns over the fragility of the union, after Brexit. The unsought violence only deepened Spain political crisis, triggered the response of the UN High Commissioner for Human Rights, Zeid Ra’ad Al Hussein, called for "independent and impartial investigations into all acts of violence." This comes after a sour Merkel’ victory the previous week in the German election. Despite macroeconomic data indicated solid growth in the EU, such figures are worthless when the union itself it’s on doubt.
In the data front, September final Markit manufacturing PMI for the EU was revised to 58.1 from a preliminary estimate of 58.2, anyway above August reading of 57.4, indicating that conditions in the manufacturing sector strengthened to the greatest extend in over six-and-a-half years, according to the official report. US numbers, however, were also above expected, preventing the pair from recovering later on the day, as the US ISM Manufacturing index came in at 60.8 in September from previous 58.8. Dollar’s advance was halted by a dovish speech from Minneapolis Fed Kashkari, who claimed that the Fed is responsible for the weaker inflation, and shouldn’t raise rates before inflation hits 2.0%.
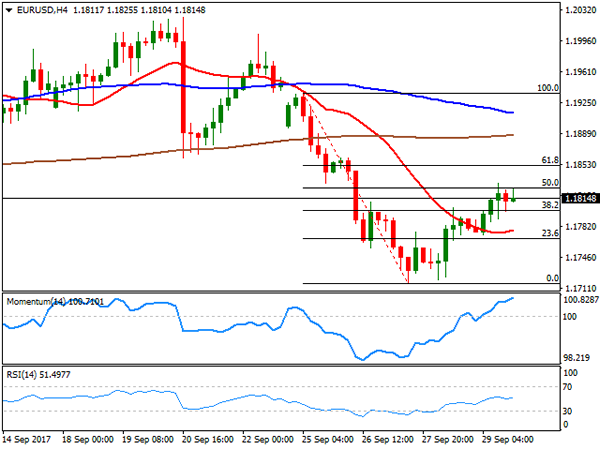
The pair settled in the 1.1740 region after trading as low as 1.1730, heading into the Asian opening with a persistent bearish tone in intraday charts, as the price holds near its September low of 1.1716, and further away from the 1.1820/30 region, a now key resistance area. In the 4 hours chart, the price settled below all of its moving averages, although the 20 SMA remains flat around 1.1780, indicating that the bearish trend has lost momentum, at least temporarily. In the same chart, technical indicators suggest the same, having turned flat, but given that they hold within bearish territory, the downside remains favored towards 1.1661, August monthly low.
Support levels: 1.1720 1.1690 1.1660
Resistance levels: 1.1780 1.1825 1.1860
USD/JPY
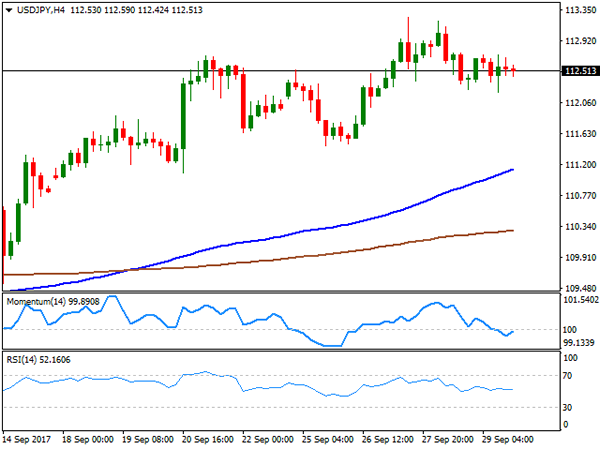
The USD/JPY pair struggled for direction this Monday, ending the day marginally higher around 112.60. The pair advanced up to 113.05 at the beginning of the day, but bulls lost the grip, despite positive US data and rising US yields. Earlier on the day, Japan’s quarterly Tankan business sentiment survey surged to its highest in a decade, with the main index for Q3 up to 22 from previous 17, a sign that the economic recovery is broadening. In the US, yields mover marginally higher, with the 10-year note benchmark up to 2.34% after closing on Friday at 2.32%. Also, the Nikkei Manufacturing PMI rose in September to 52.9, beating previous estimates of 52.6. The pair is in a consolidative phase with the bullish trend holding in the background. In the 4 hours chart, technical indicators continue to be stuck around their mid-lines, but the price remains above a strongly bullish 100 SMA, which now advanced up to the 111.60 region. The pair topped at 113.25 last week, the level to surpass to confirm another leg higher, which can extend up to the critical 114.40 region during the following sessions.
Support levels: 112.20 111.85 111.50
Resistance levels: 112.90 113.25 113.60
GBP/USD
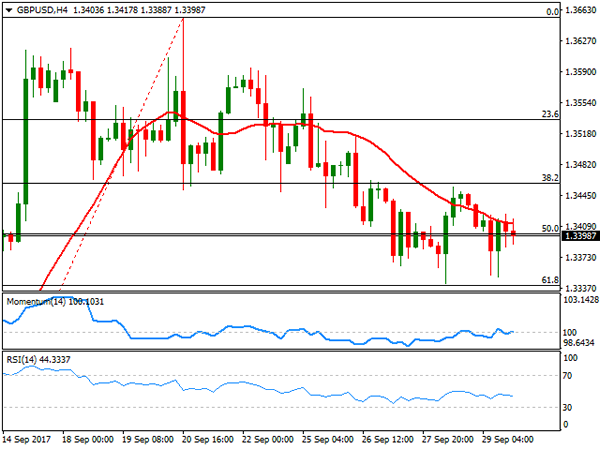
The GBP/USD pair plunged to 1.3256, its lowest ever since the latest BOE’s meeting, when Governor Carney said markets could be underestimating odds of a rate hike in the UK. The pair was trading around 1.3200 ahead of the event, as it has now become a probable bearish target, as despite the hawkish rhetoric towards rate hikes persists, they are being offset by concerns about the economic consequences on Brexit, and the absence of progress in negotiations, despite latest PM May’s speech. The pair fell after breaking a key support, the 61.8% retracement of the latest bullish run at 1.3340, later fueled by a disappointing September Markit manufacturing PMI for the UK, down to 55.6 against the previous 56.7 and the expected 56.4. The pair recovered modestly from the mentioned low, but stands barely 20 pips above the level, and still bearish according to technical readings, as in the 4 hours chart, the 20 SMA extended its decline well above the current level, whilst technical indicators barely decelerate their declines, now trying to stabilize within oversold readings. The same chart shows that the price met support around its 200 EMA, usually a tough bone to break, but also a line in the sand, as a bearish extension below it will likely result in a steeper decline during the following sessions.
Support levels: 1.3250 1.3210 1.3170
Resistance levels: 1.3300 1.3340 1.3385
GOLD
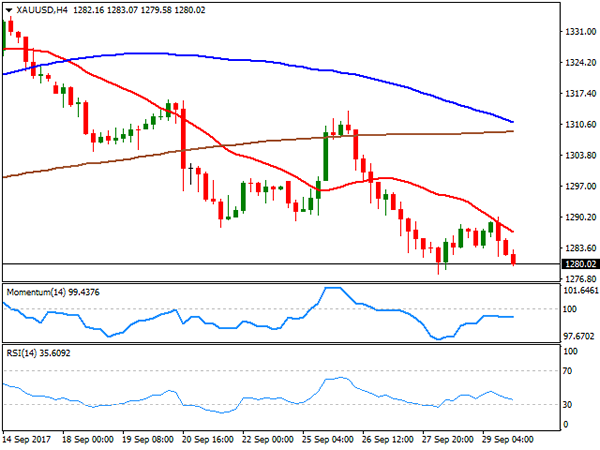
Gold’s bearish trend persisted, with spot down to fresh over 1-month low at the beginning of the week, with spot closing the day at $1.274.38 a troy ounce after falling to 1,271.10. Broad dollar’s strength kept the commodity under pressure, further undermined by US equities rallying to record highs. Negative comments from US Fed members prevented gold from falling further, as adding to Kashkari comments, later on the day Fed’s Kaplan warned that Q3 growth may be sluggish, amid the hurricanes that hit the US this past September. The fact that the bounce was shallow, suggest that the market still believes the Fed will pull the trigger next December, and therefore leans the scale towards the downside. Spot gold’s daily chart shows that the yellow metal ended the session around its 100 DMA, and well below a bearish 20 DMA, whilst technical indicators hold near oversold territory, supporting additional slides ahead. The next key support comes at 1,261.30, the 200 DMA in the same chart. In the shorter term, and according to the 4 hours chart, spot is also biased lower, despite technical indicators lost downward momentum, as they hold anyway within negative territory, whilst the price keeps developing below sharply bearish moving averages.
Support levels: 1,271.10 1,261.30 1,252.90
Resistance levels: 1,283.10 1.294.25 1,303.95
WTI CRUDE OIL
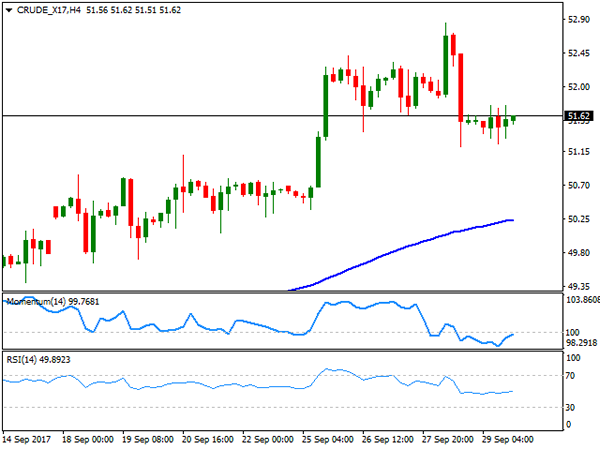
Crude oil prices plunged this Monday, hit by news indicating a decline in OPEC’s compliance with the output cut agreement in September, according to a Reuters’ poll, which estimates compliance in the month was just of 86%. Also, broad dollar’s strength weighed on the black gold, with WTI futures ending the day around $50.55 a barrel, after trading as low as 50.03. The US benchmark closed the day right below the 38.2% retracement of its latest bullish run between 46.99 and 52.84 at 50.60, keeping the risk towards the downside for this Tuesday. In the daily chart, technical indicators maintain their strong bearish within positive territory, now nearing their mid-lines, whilst the price remains well above the 100 and 200 DMAs, maintaining the current decline as corrective. In the 4 hours chart, the price settled a few cents above a bullish 100 SMA after falling to near the 50% retracement of the mentioned rally at 49.90, whilst technical indicators bounced modestly from oversold readings, but are far from suggesting an upcoming recovery.
Support levels: 49.90 49.30 48.65
Resistance levels: 50.60 51.20 51.85
DJIA
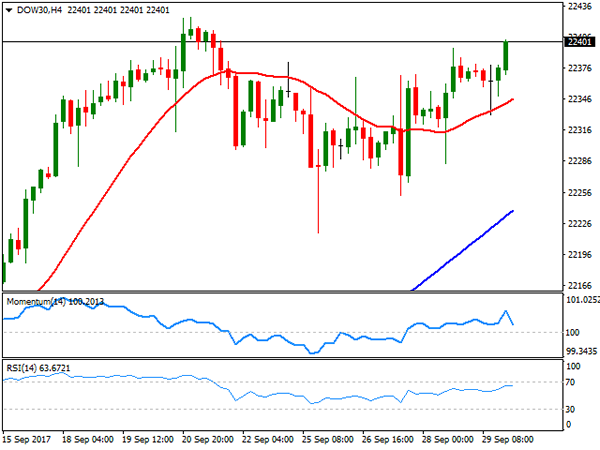
Wall Street ended firmly up this Monday, with the DJIA up 152 points to close at an all-time high of 22,557.60. The Nasdaq Composite added 20 points, to 6,516.72, whilst the S&P gained roughly 10 points, to 2,529.12, both also posting record closes. US equities rally was backed by strong manufacturing figures released early US session, with tech and gun-related equities among the best performers, and casino shares down after the Las Vegas massacre. Within the Dow, Intel Corp. was the best performer, up 2.39%, followed by General Electric that added 1.62%. Coca-Cola led decliners, down 0.48%, followed by Exxon Mobil that lost 0.43% amid falling oil prices. Dow’s daily chart shows that the RSI indicator accelerated north, currently at 75, while the Momentum lags, consolidating anyway within bullish territory. Furthermore, the index continues developing above bullish moving averages, all of which favors further gains ahead. Shorter term, and according to the 4 hours chart, the index maintains its strong bullish bias, also advancing sharply beyond bullish moving averages, and while technical indicators remain within extreme overbought territory, anyway presenting upward slopes.
Support levels: 22,500 22,456 22,403
Resistance levels: 22,580 22,625 22,660
FTSE100
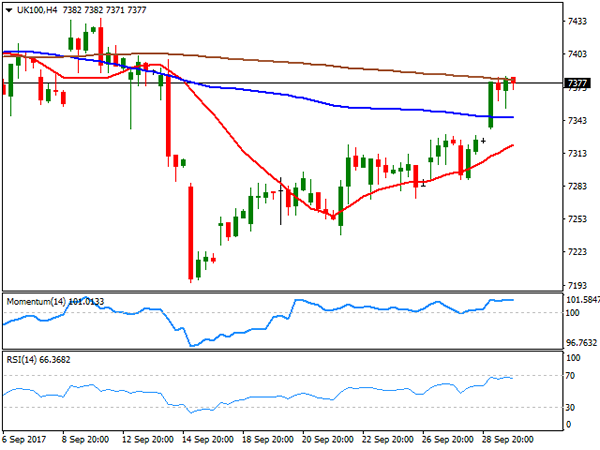
The FTSE 100 closed at 7,438.84, up 66 points or 0.90%, helped by a weakening Pound and strong gains in travel stocks, this last, on news that Monarch airline collapsed, opening market for its rivals. EasyJet led gainers, up 5.18%, followed by Barratt Developments that added 4.23%. Mediclinic International, on the other hand, led decliners, down by 1.08%. The strong intraday advance has took off the negative bias of the benchmark, which ended the day above its 100 DMA for the first time since September 12th. Additionally, and in the daily chart, technical indicators entered bullish territory, indicating that the advance may continue this Tuesday, particularly on a break above 7,441, the daily high and the immediate resistance. Shorter term, and according to the 4 hours chart, the index is also bullish, although technical indicators have lost upward strength after reaching overbought levels. Nevertheless, and in this last time frame, a bullish 20 SMA is crossing above the 100 SMA below the current level, reflecting the ongoing upward momentum and also supporting further gains ahead.
Support levels : 7,354 7,312 7,282
Resistance levels: 7,383 7,422 7,461
DAX
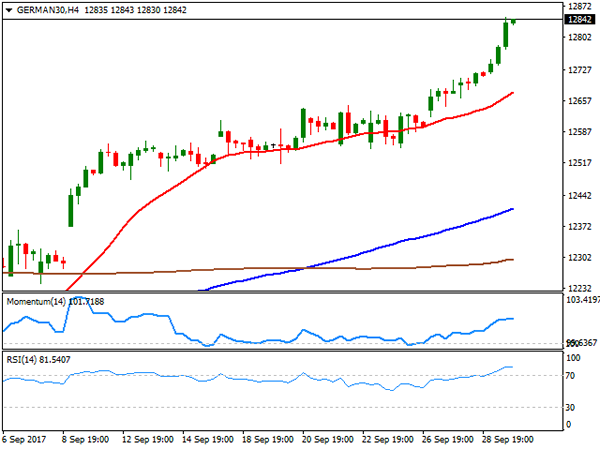
The German DAX advanced 74 points on Monday, to close the day at 12,902.65, with all European indexes closing in the green as the common currency fell. Also, backing the rally in German equities was the local Markit manufacturing PMI, confirmed at 60.6 in September, the strongest growth performance since early 2011. Most members were up within the benchmark, with Deutsche Lufthansa leading advancers, up 3.34%, as airline companies gained on news UK’s Monarch airline declare its bankruptcy. Heidelberg Cement led decliners, down 1.35%, whilst banks also closed in the red, down by around 0.30% each. The index closed at its highest since June, when it posted an intraday record high of 12.953, and technical readings in the daily chart favor additional gains ahead, as technical indicators regained their upward strength, with the RSI indicator currently at 76, as the index moves further above bullish moving averages. In the 4 hours chart, technical readings also support a new leg higher, as the 20 SMA accelerated north below the current level, whilst technical indicators have turned flat after the close, within extreme overbought readings.
Support levels: 12,796 12,752 12,710
Resistance levels: 12,847 12,881 12,933


