
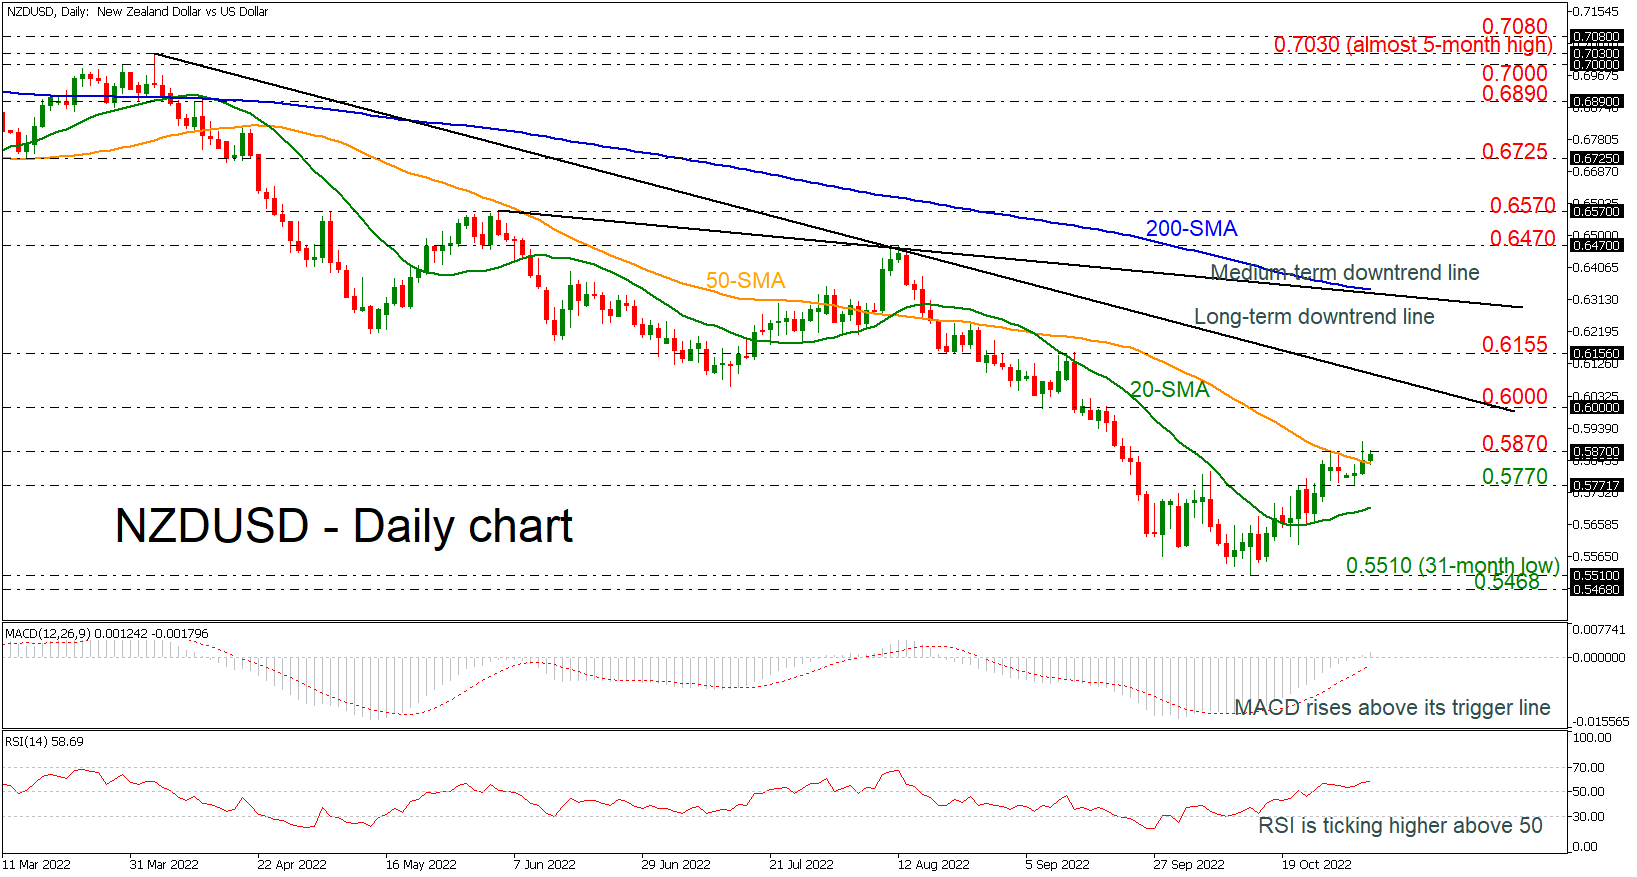
NZDUSD rebounded off the 31-month low of 0.5510 in the mid-October. Currently, the market is advancing above the 50-day simple moving average (SMA) with the technical oscillators showing positive signs as well. The MACD is extending the bullish momentum above its trigger and zero lines, while the RSI is standing above the neutral threshold of 50.
More upside pressures could lead the price towards the 0.6000 psychological mark before meeting the long-term downtrend line around 0.6070. If traders continue to buy the pair, the next immediate resistance could be at 0.6155 ahead of the medium-term descending trend line near the 200-day SMA at 0.6340.
On the other hand, a drop back below the 50-day SMA and the 0.5770 support could meet the 20-day SMA at 0.5710. Steeper losses could open the way towards the 31-month of 0.5510 and a lower low near 0.5468.
All in all, NZDUSD appears bullish in the short-term timeframe. However, in the medium- and long-term pictures the price is strongly bearish.


