
USD/JPY:
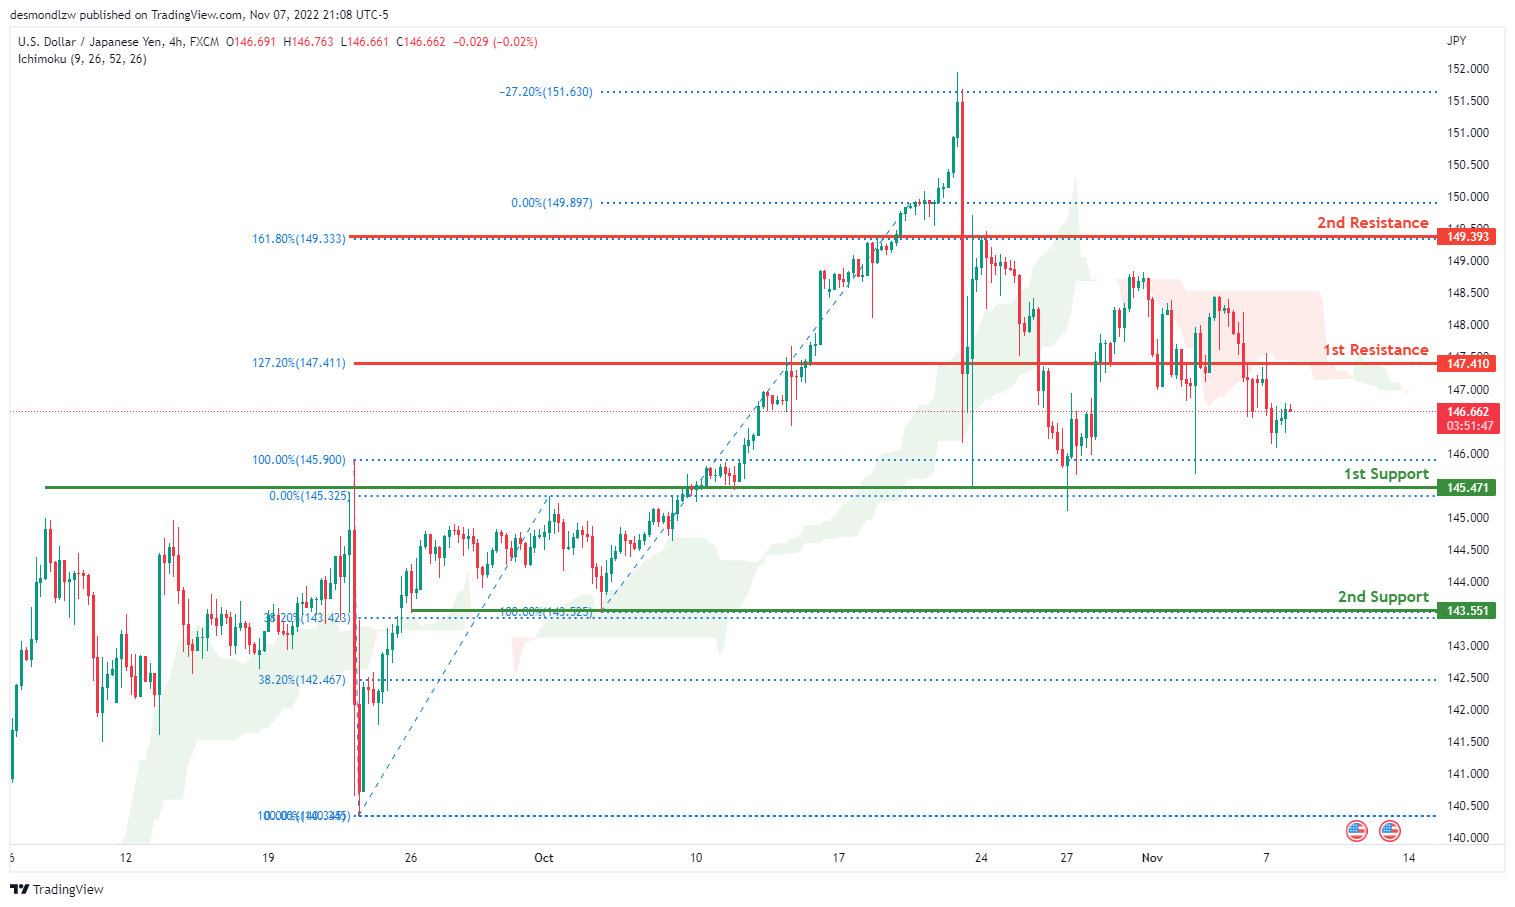
The current general bias for USDJPY on the H4 chart is bearish. To add confluence to this, the price is below the Ichimoku cloud which indicates a bearish market. Overnight, USDJPY continued its bearish momentum with the price currently below the 1st resistance line at 147.410 where the 127.2% Fibonacci extension line is located. Price is currently trading at 146.677 at time of writing. If the bearish momentum continues, expect USDJPY to possibly head towards the 1st support line at 145.471, where the 100% and 0% Fibonacci lines are located. In an alternative scenario, price could break above the 1st resistance and head towards the 2nd resistance at 149.393 where the 161.8% and 0% Fibonacci lines are located.
Areas of consideration:
- H4 time frame, 1st resistance at 147.410
- H4 time frame, 1st resistance at 149.393
- H4 time frame, 1st support at 145.471
DXY:
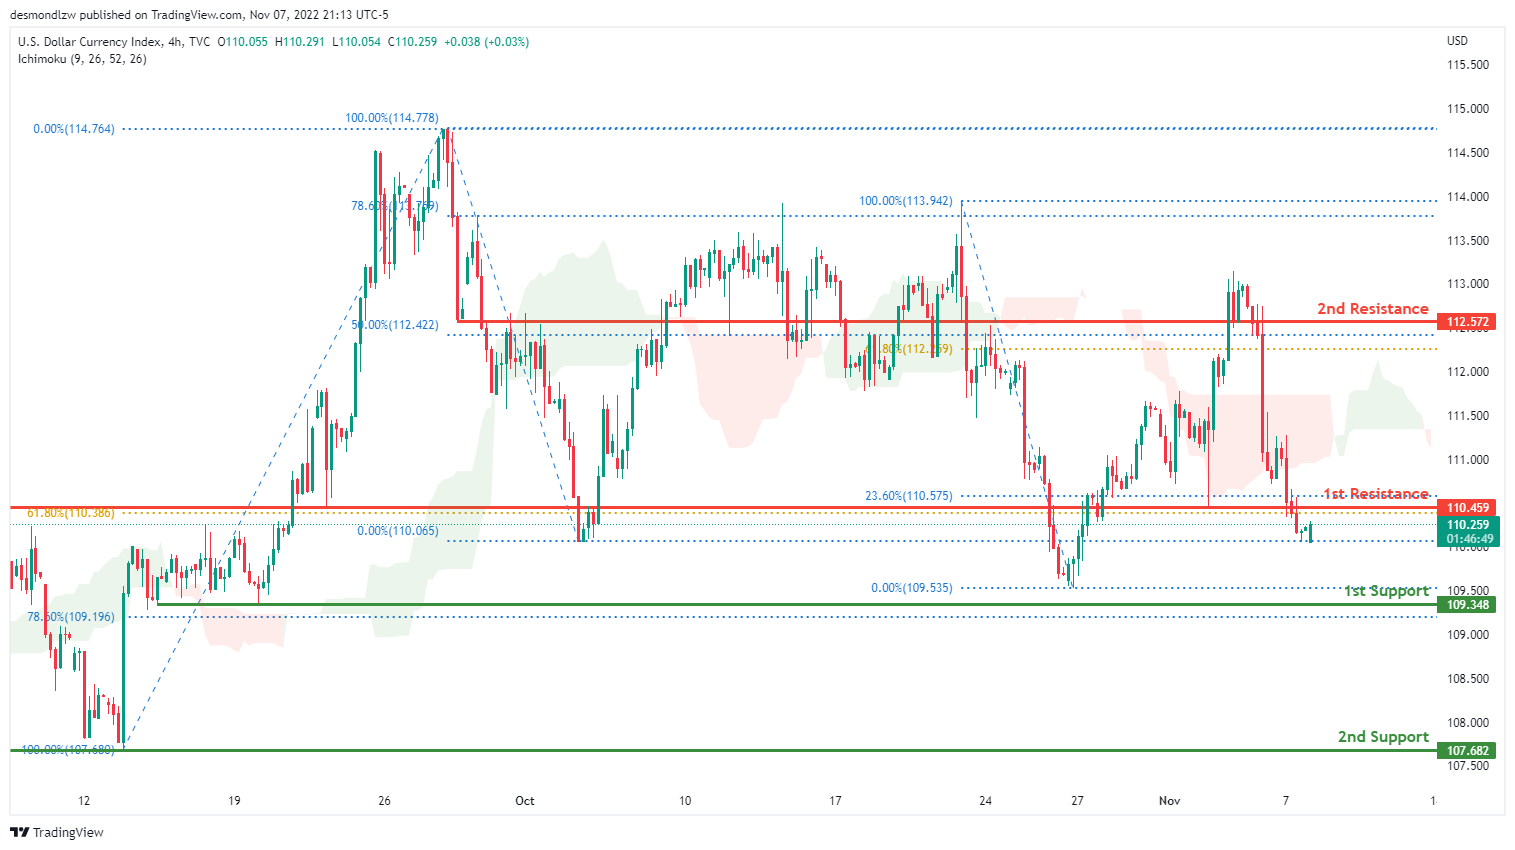
On the H4 chart, the overall bias for DXY is bearish. To add confluence to this, the price is crossing below the Ichimoku cloud which indicates a bearish market. Overnight, price continued its bearish momentum downwards with price closing under the 1st resistance at 110.459 where the 61.8% and 23.6% Fibonacci lines are located. The price is currently trading at 110.258 at the time of writing. If this bearish momentum continues, price could head towards the 1st support line at 109.348 where the 78.6% Fibonacci line and previous low are located. In an alternative scenario, price could head back up to retest the 1st resistance line.
Areas of consideration:
- H4 time frame, 1st resistance at 110.459
- H4 time frame, 1st support at 109.348
EUR/USD:
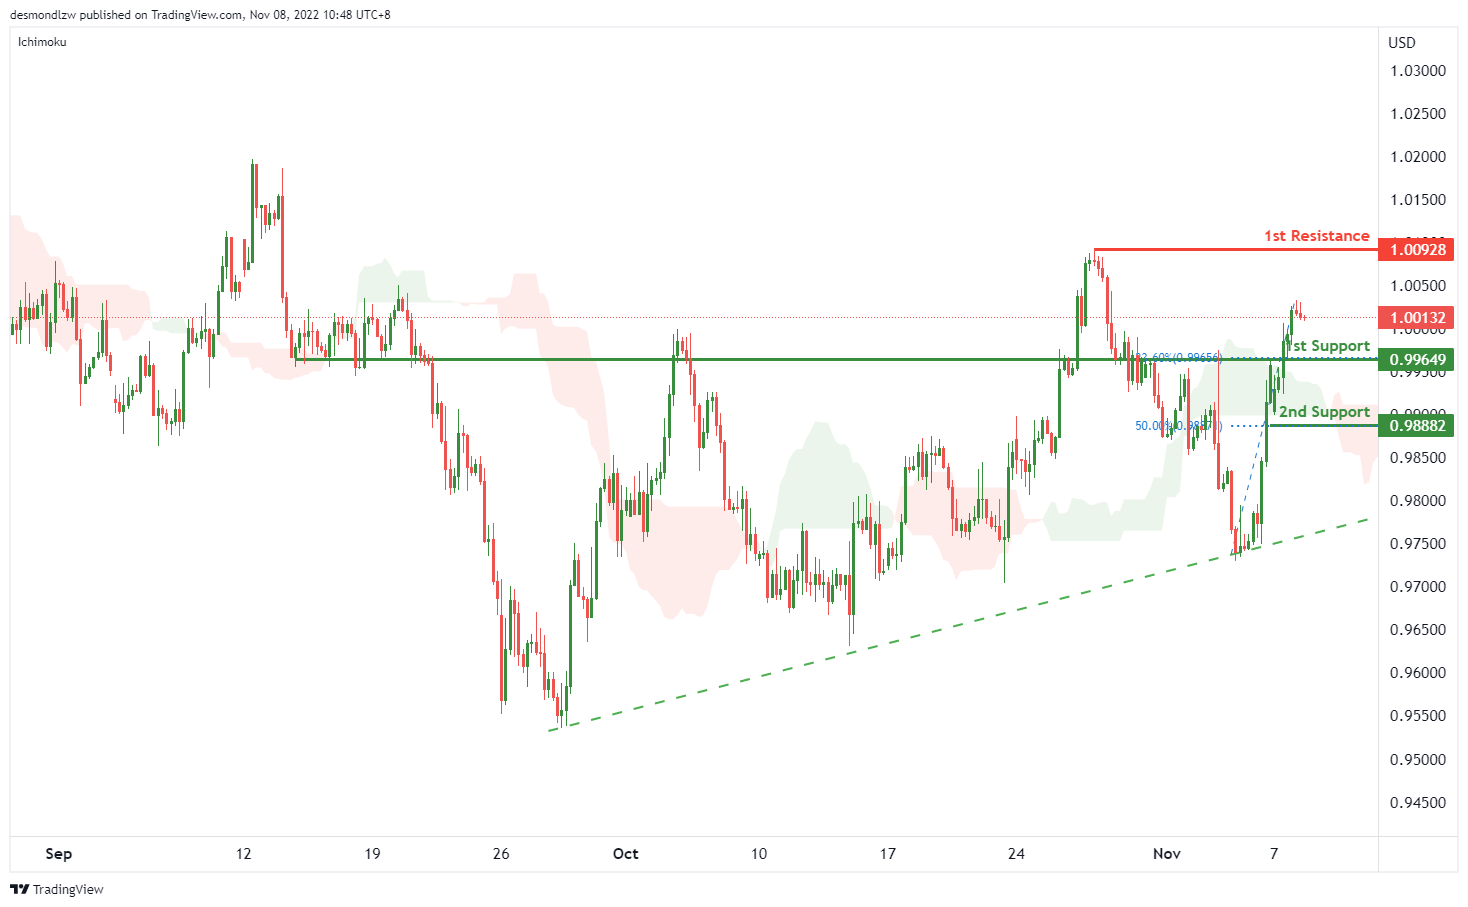
On H4, with the price moving above the ichimoku cloud and ascending trendline, we have a bullish bias that the price may rise from 1st support at 0.99649, which is in line with the 23.6% fibonacci retracement and previous swing lows to the 1st resistance at 1.00928, where the swing high is. Alternatively, the price may drop to the 2nd support at 0.98882, which is in line with the 50% fibonacci retracement .
Areas of consideration :
- H4 1st support at 0.99649
- H4 1st resistance at 1.00928
GBP/USD:
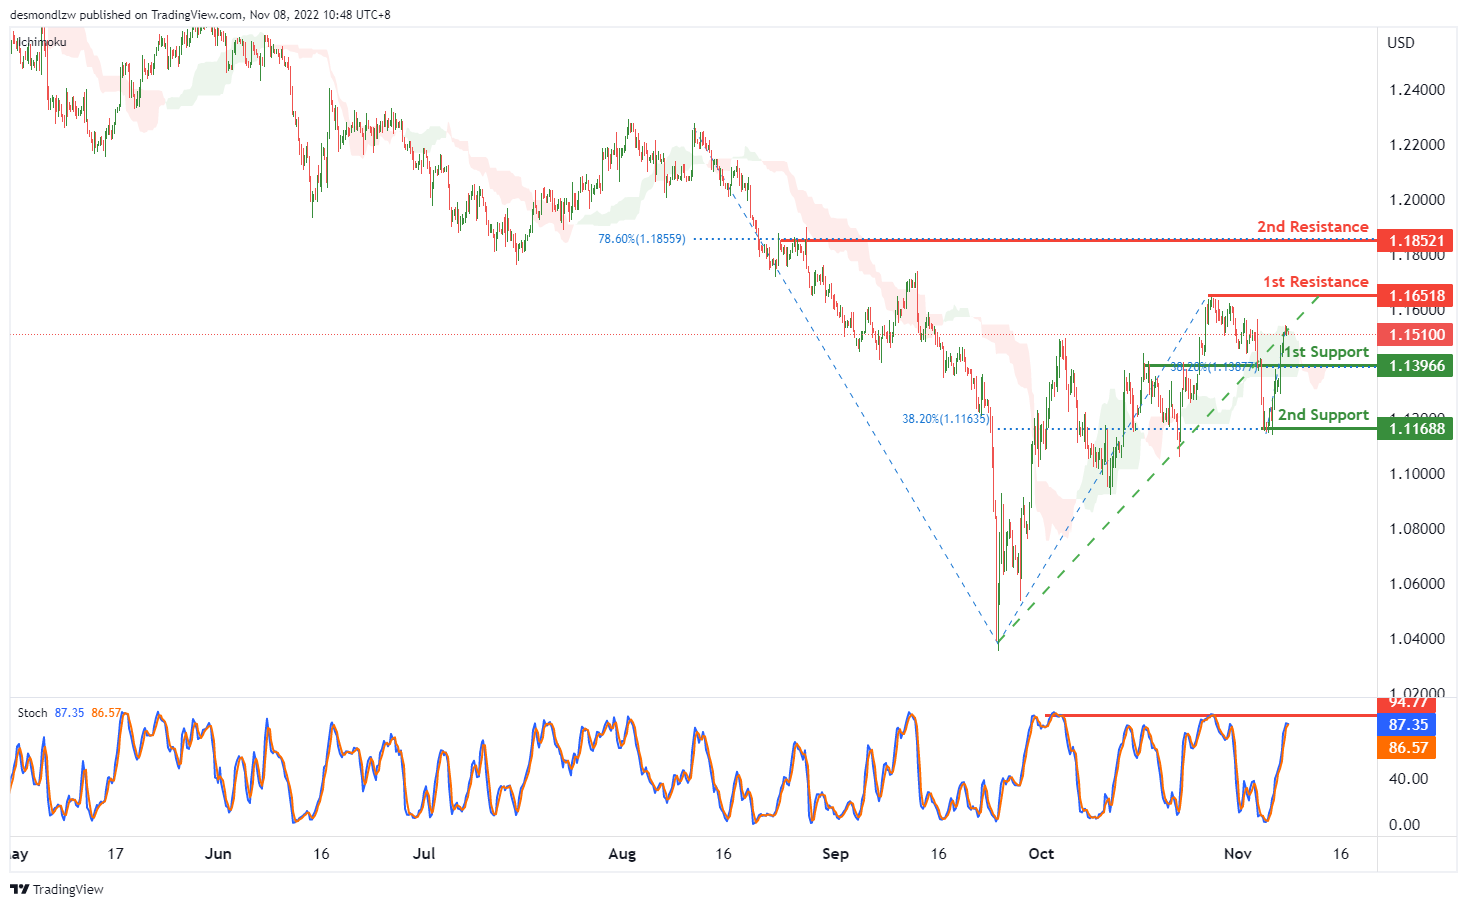
On the H4, price is crossing the ichimoku cloud and rising back to the ascending trendline, we have a bullish bias that the price may rise to test the 1st resistance at 1.16518, which is in line with the previous swing high to the 2nd resistance at 1.18521, where the 78.6% fibonacci retracement is. Alternatively, the price may drop to the 1st support at 1.13966, where the 38.2% fibonacci retracement is, if the 1st support is broken, the 2nd support is at 1.11688, which is in line with the previous swing low and 38.2% fibonacci retracement.
Areas of consideration:
- H4 1st resistance at 1.16518
- H4 2nd resistance at 1.18521
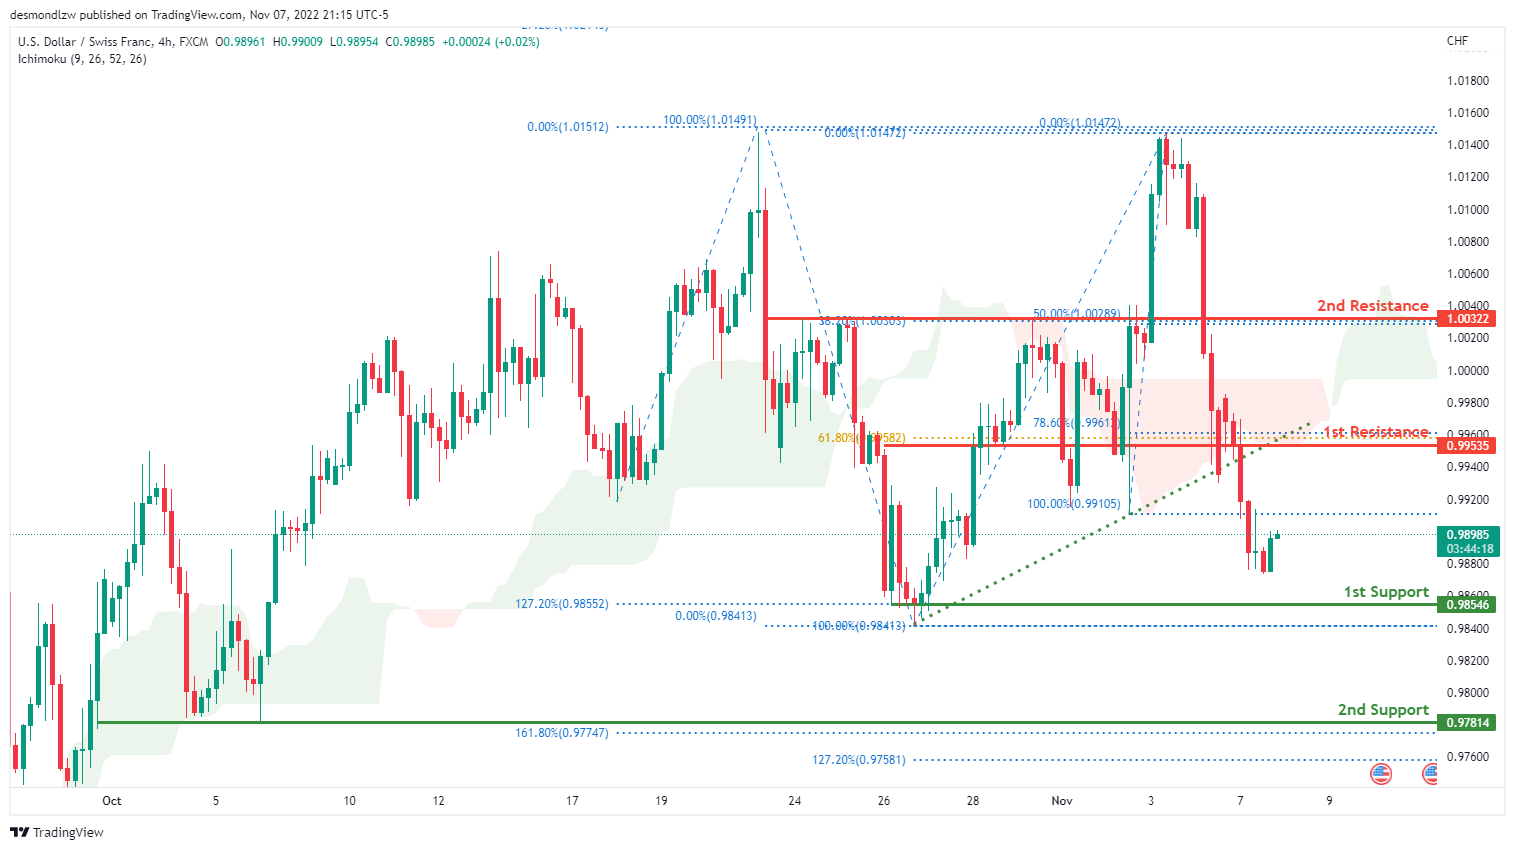
USD/CHF:
On the H4 chart, the overall bias for USDCHF is bearish. To add confluence to this, the price is below the Ichimoku cloud which indicates a bearish market. Overnight, price continued its bearish momentum downwards with price closing under the 1st resistance line at 0.99535 where the 61.8% and 78.6% Fibonacci lines are located . The price is currently trading at 0.99535 at the time of writing. If this bearish momentum continues, expect price to head towards the 1st support line at 0.98546, where the 127.2% Fibonacci extension line, 100% Fibonacci line and previous swing low are located. In an alternative scenario, price could head back up to retest the 1st resistance line.
Areas of consideration
- H4 1st support at 0.98546
- H4 1st resistance at 0.99535
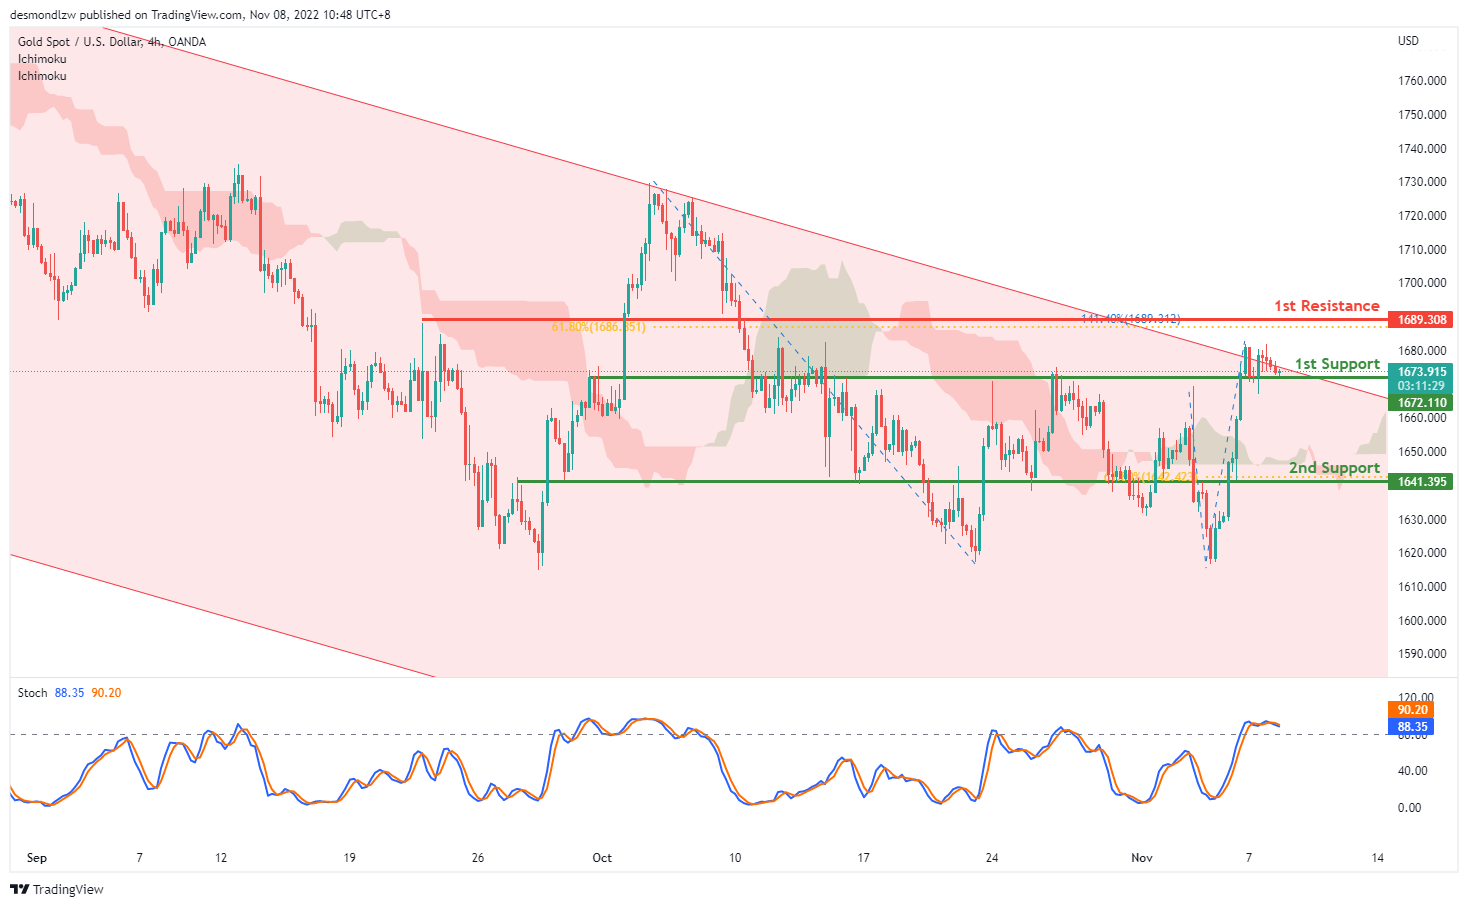
XAU/USD (GOLD):
On H4, with the price dropping back to the descending channel and stoch is above 80, showing an overbought signal, we can expect the price to drop from the 1st support at 1672.110, which is in line with the previous swing high to the 2nd support at 1641.395, where the overlap support and 61.8% fibonacci retracement are. Alternatively, the price may rise to the 1st resistance at 1689.308, where the 61.8% fibonacci retracement and 141.4% fibonacci extension sit.
Areas of consideration:
- H4 time frame, 1st support at 1672.110
- H4 time frame, 2nd support at 1641.395
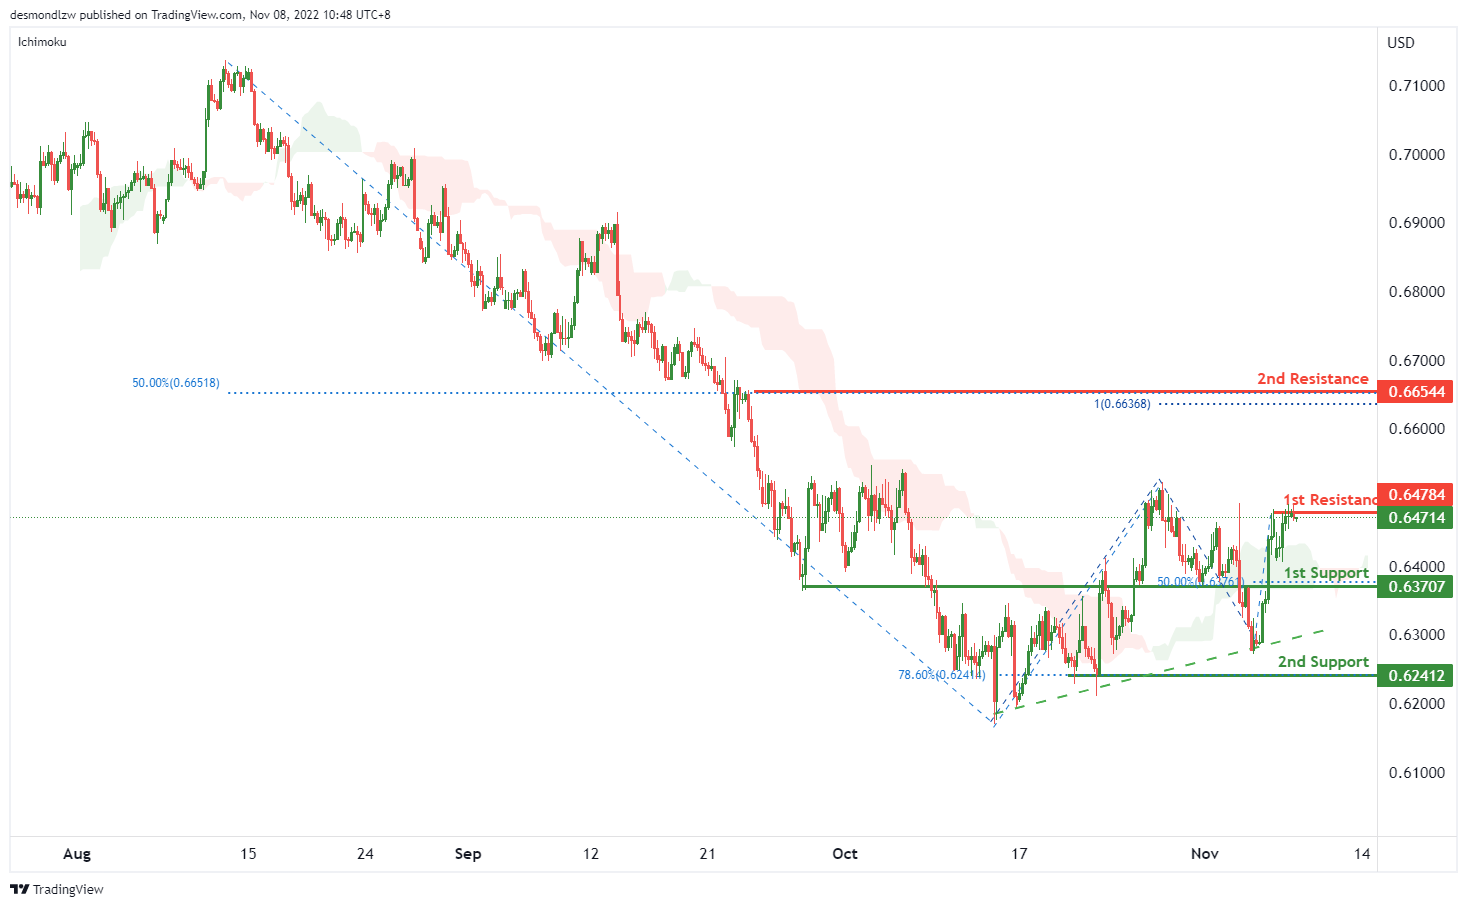
AUD/USD:
On the H4, with the price crossing the ichimoku cloud and moving above the ascending trendline, we can expect the price to break the 1st resistance at 0.64784, which is in line with the swing high. If the 1st resistance is broken, the 2nd resistance is at 0.66544, where the 100% fibonacci projection and 50% fibonacci retracement are. Alternatively, the price may drop from the 1st resistance to the 1st support at 0.63707, where the 50% fibonacci retracement and previous swing low are. If the 1st support is broken, the 2nd support is at 0.62414, where the 78.6% fibonacci retracement is.
Areas of consideration
- H4, 1st resistance at 0.64784
- H4, 2nd resistance at 0.66544
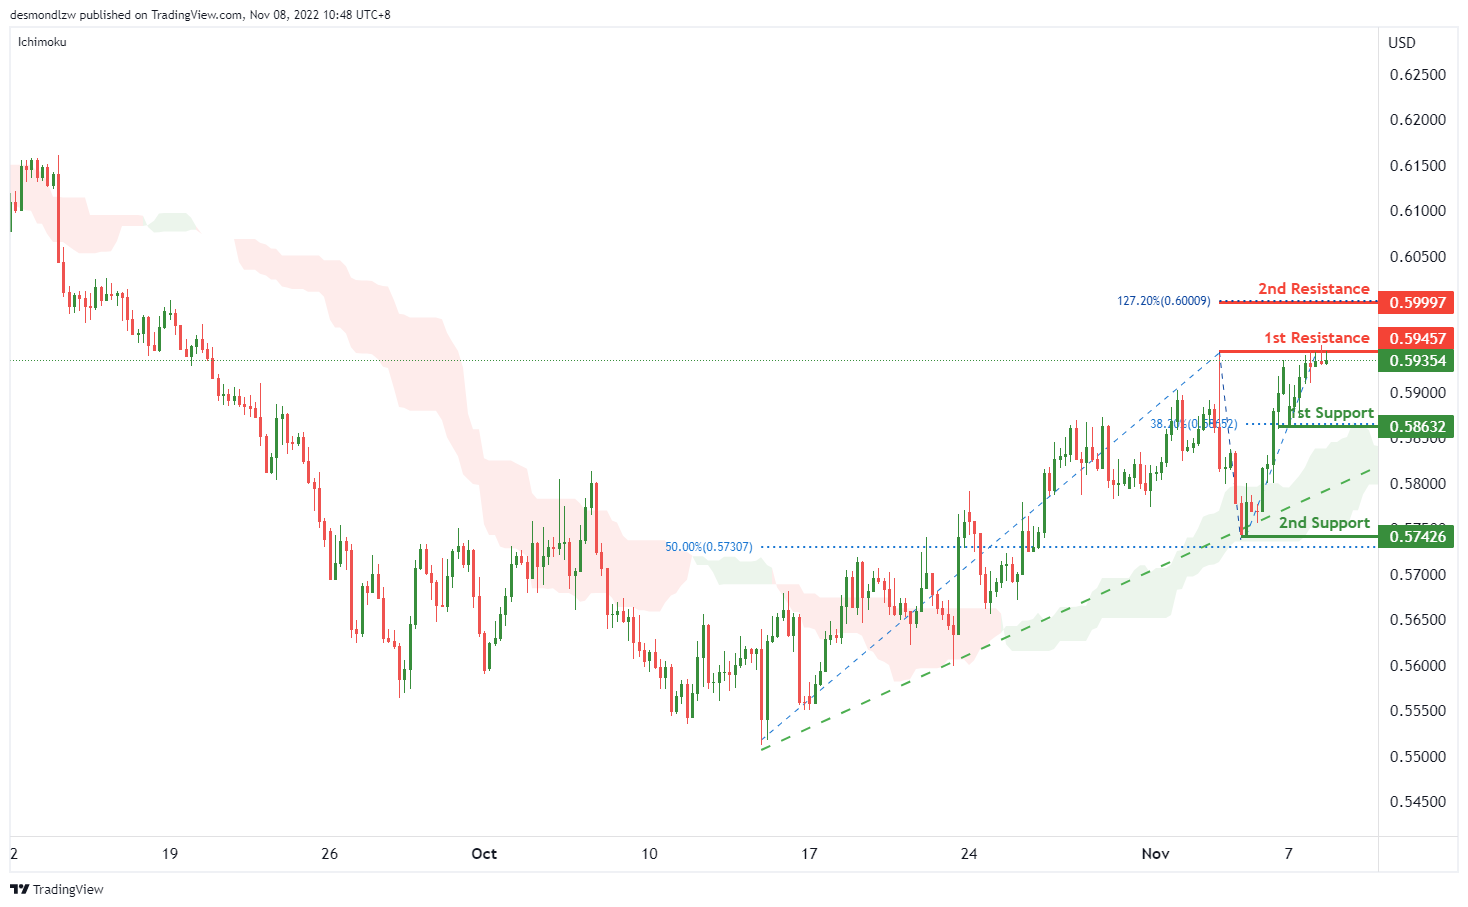
NZD/USD:
On the H4 chart, as the price is moving above ichimoku cloud and ascending trendline, the price may rise to the 1st resistance at 0.59320, which is in line with the swing highs. If the 1st resistance is broken, the 2nd resistance is at 0.59997, which is in line with the 127.2% fibonacci extension. Alternatively, the price may drop to the 1st support at 0.58632, which is in line with the swing low and 38.2% fibonacci retracement. If the 1st support is broken, the 2nd support is at 0.57426, which is in line with the 50% fibonacci retracement.
Areas of consideration:
- H4 time frame, 1st resistance at 0.59320
- H4 time frame, 2nd resistance at 0.59997
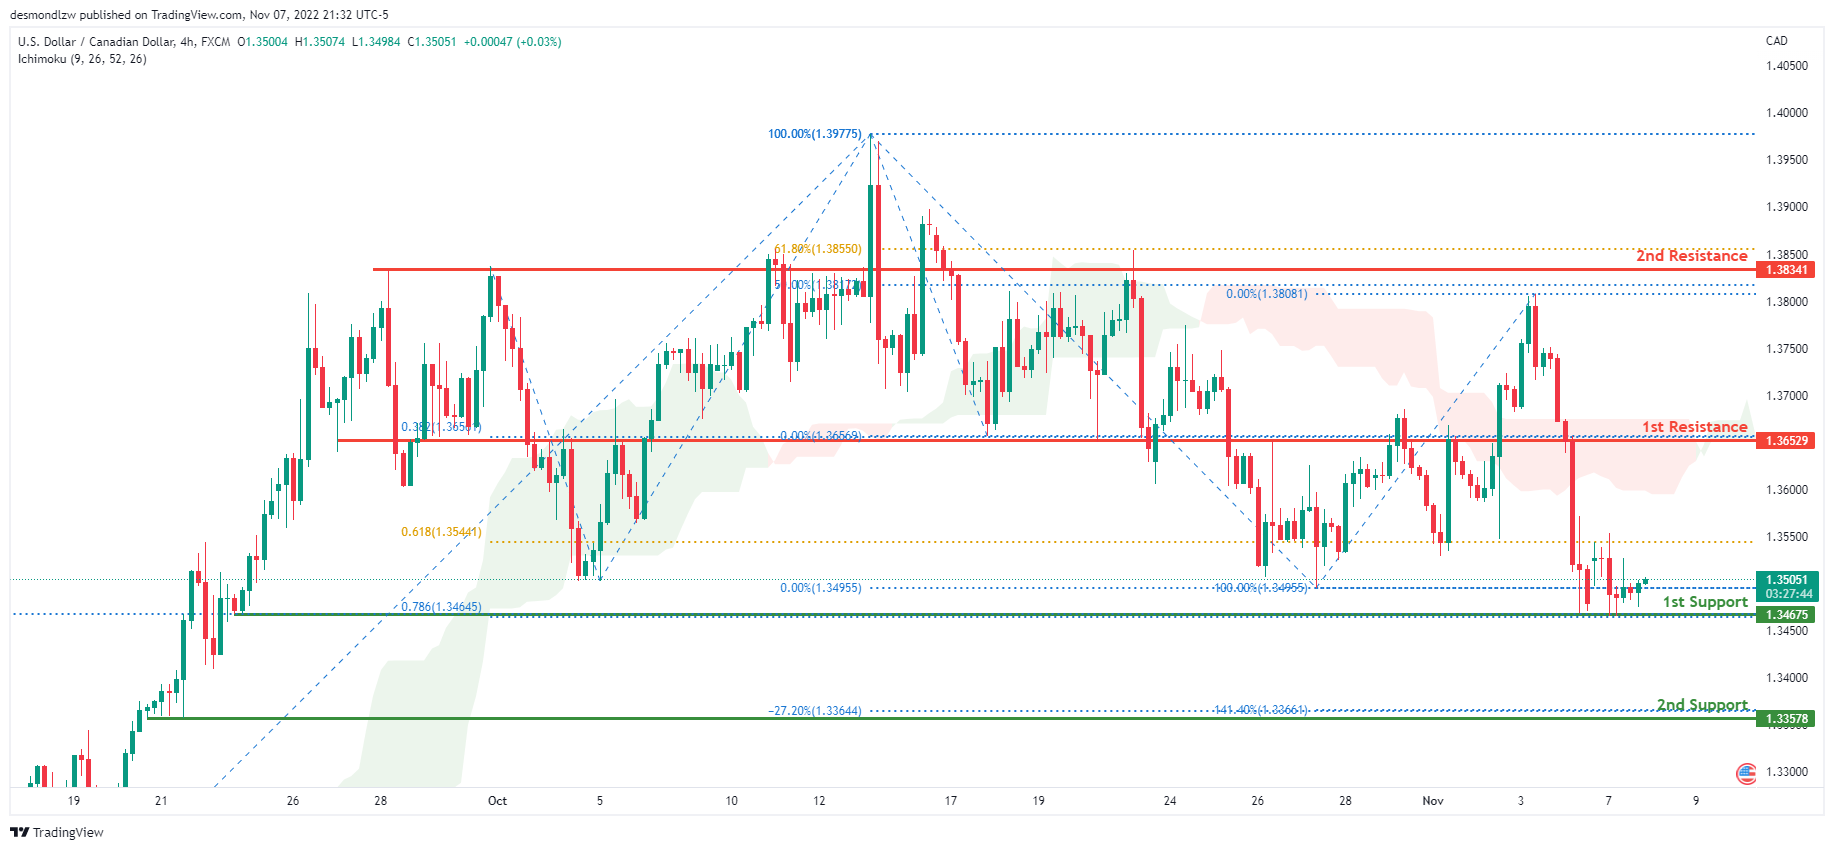
USD/CAD:
On the H4 chart, the overall bias for USDCAD is bearish. To add confluence to this, the price is below the Ichimoku cloud which indicates a bearish market. Overnight, the price continued to consolidate along the 1st support line. The price is currently trading at 1.35068 at the time of writing. If this bearish momentum continues, expect the price to head back down towards the 1st support line at 1.34675 where the 78.6% Fibonacci projection line and previous low is located. In an alternative scenario, price could head back up towards the 1st resistance line at 1.36529, where the 38.2% Fibonacci projection line is located.
Areas of consideration:
- H4 time frame, 1st resistance at 1.36529
- H4 time frame, 1st support at 1.34675
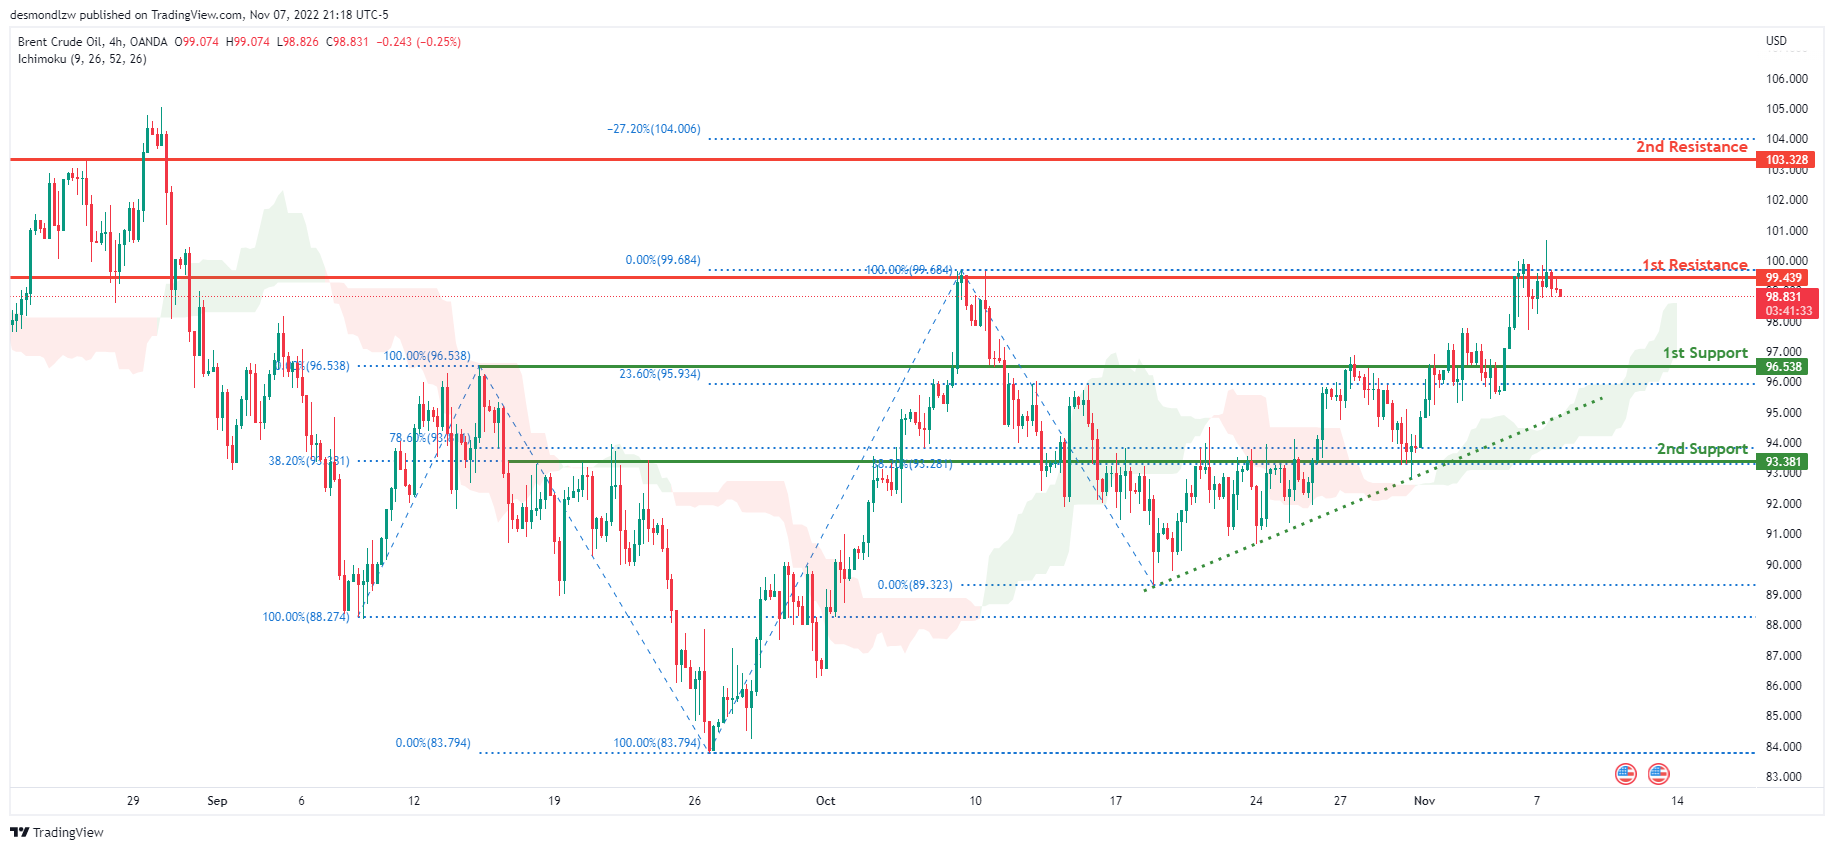
OIL:
Looking at the H4 chart, the current overall bias for Oil is bullish. To add confluence to this, the price is above the Ichimoku cloud which indicates a bullish market. Overnight, price attempted to break through the 1st resistance line but eventually closed underneath it, continuing the consolidation. The price is currently trading at 98.846 at the time of writing. If this bullish momentum continues, expect price to possibly head back up towards the 1st resistance at 99.439 where previous swing high and 0% Fibonacci line is located. In an alternative scenario, price could head back down to the 1st support level at 96.538 where the 23.6% and 100% Fibonacci lines are located.
Areas of consideration:
- H4 time frame, 1st resistance at 99.439
- H4 time frame, 1st support at 96.538
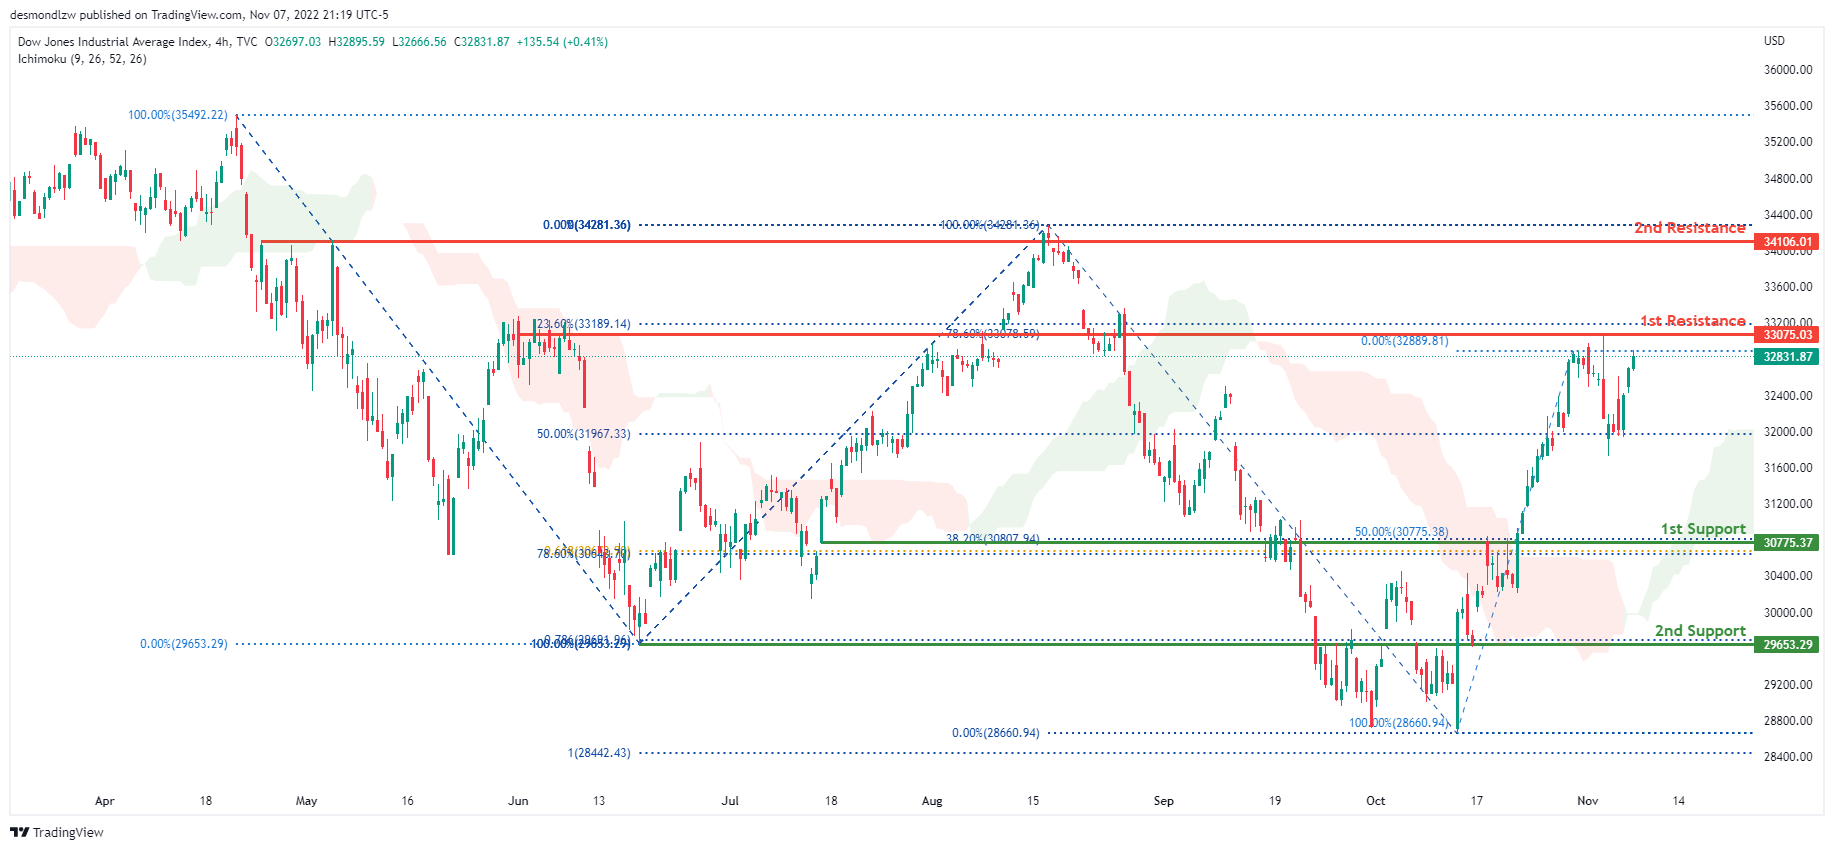
Dow Jones Industrial Average:
On the H4 chart, the overall bias for DJI is bullish. To add confluence to this, the price is above the Ichimoku cloud which indicates a bullish market. Overnight, price continued its bullish momentum upwards. The price is currently trading at 32831.87 at time of writing. If this bullish momentum continues, expect the price to possibly head towards the 1st resistance at 33272.34 where the 23.6% and 78.6% Fibonacci lines are located. In an alternative scenario, price could head towards the 1st support line at 30775.37, where the 38.2% and 50% Fibonacci lines are located.
Areas of consideration:
- H4 time frame, 1st support at 30775.37
- H4 time frame, 1st Resistance at 33272.34
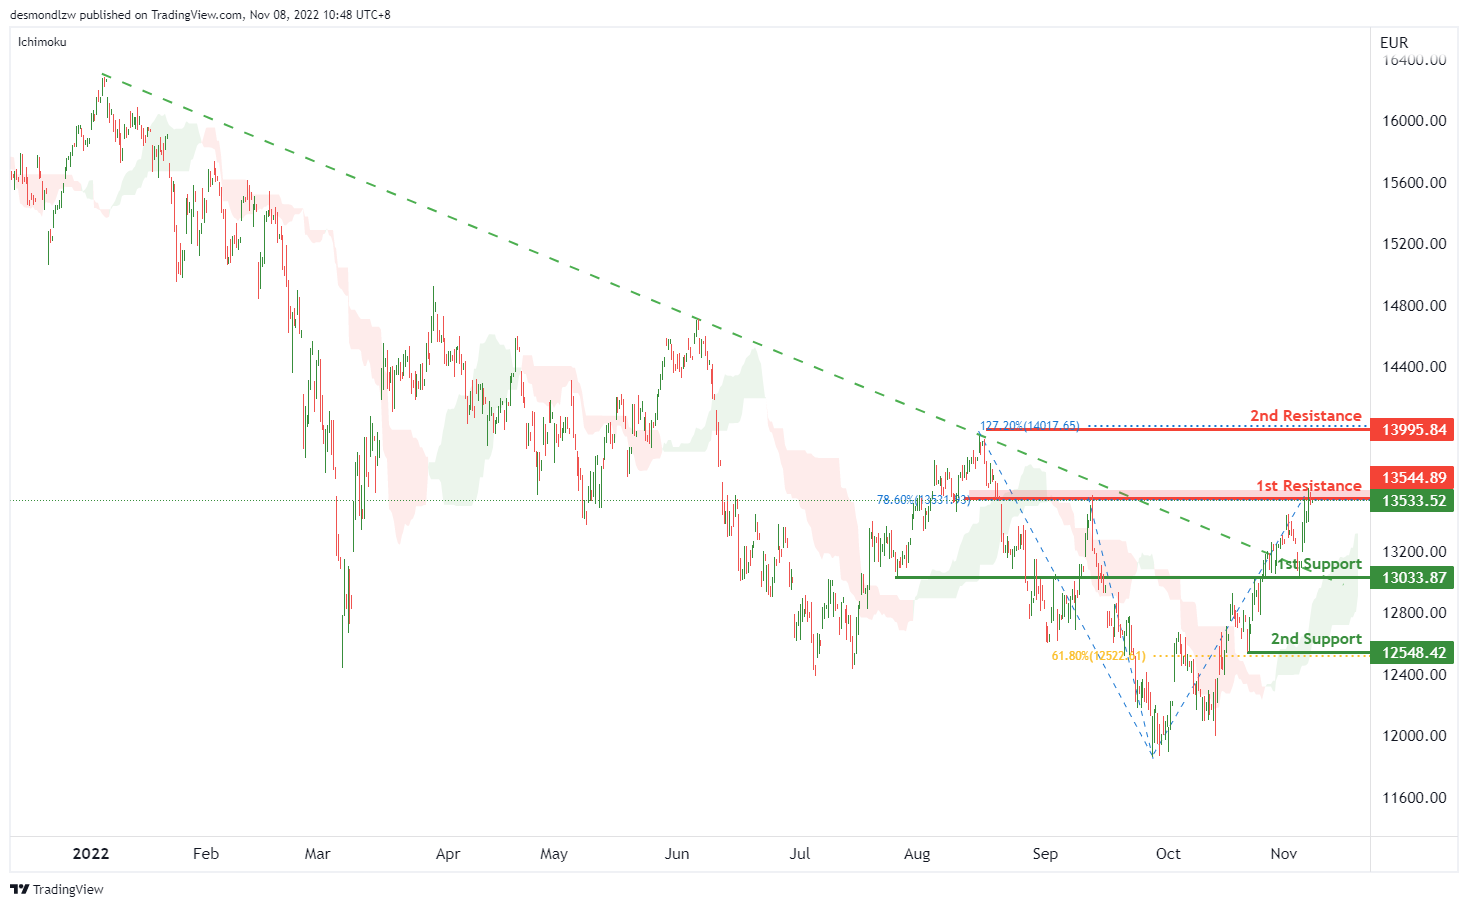
DAX:
On the H4 chart, the price breaks a descending trendline. Expecting price to possibly continue this bullish momentum and break the 1st resistance at 13544.89, which is in line with the previous swing high and 78.6% fibonacci retracement. If the 1st resistance is broken, the 2nd resistance is at 13995.84, where 127.2% fibonacci extension sits. Alternatively, the price may drop to the 1st support at 13033.87, which is in line with the previous swing low, if the 1st support is broken, the 2nd support is at 12548.42, which is in line with the 61.8% fibonacci retracement.
Areas of consideration:
- H4 time frame, 1st resistance at 13544.89
- H4 time frame, 2nd resistance is at 13995.84
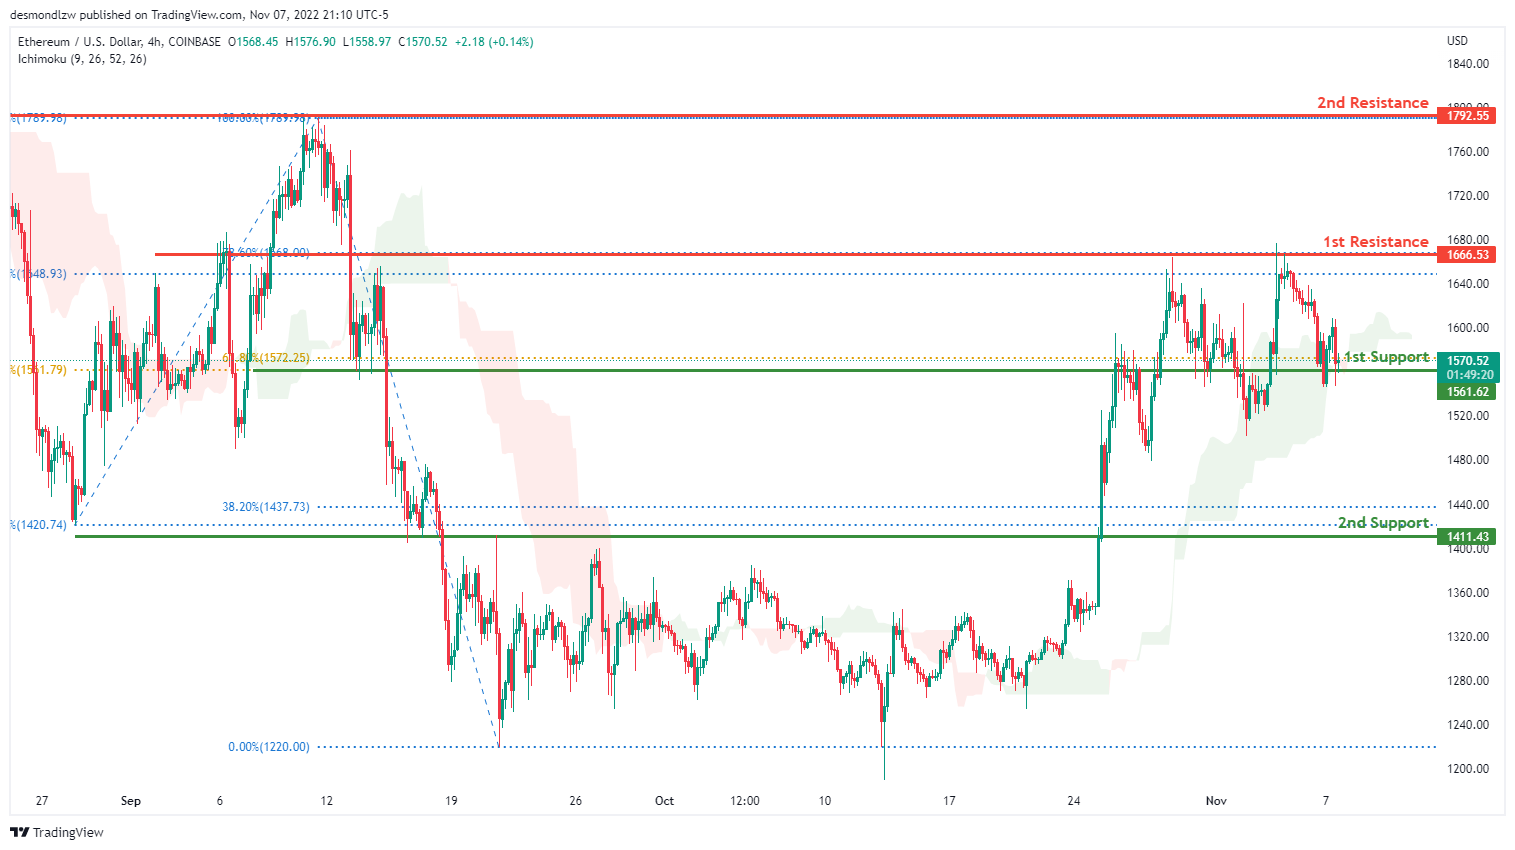
ETHUSD:
Looking at the H4 chart, the current overall bias for ETHUSD is bullish, with price currently within the green Ichimoku cloud. Overnight, price continued to consolidate along the 1st support line at 1561.62, where 2 of the 61.8% Fibonacci lines are located. The price is currently trading at 1570.63 at the time of writing. If this bullish momentum continues, expect the price to head towards the 1st resistance line at 1666.53, where the 78.6% and 38.2% Fibonacci lines are located. In an alternative scenario, price could break the 1st support line and head towards the 2nd support line at 1411.43, where the 38.2% and 100% Fibonacci lines are located.
Areas of consideration:
- H4 time frame, 1st resistance of 1666.53
- H4 time frame, 1st support at 1561.62
- H4 time frame, 2nd support at 1411.43
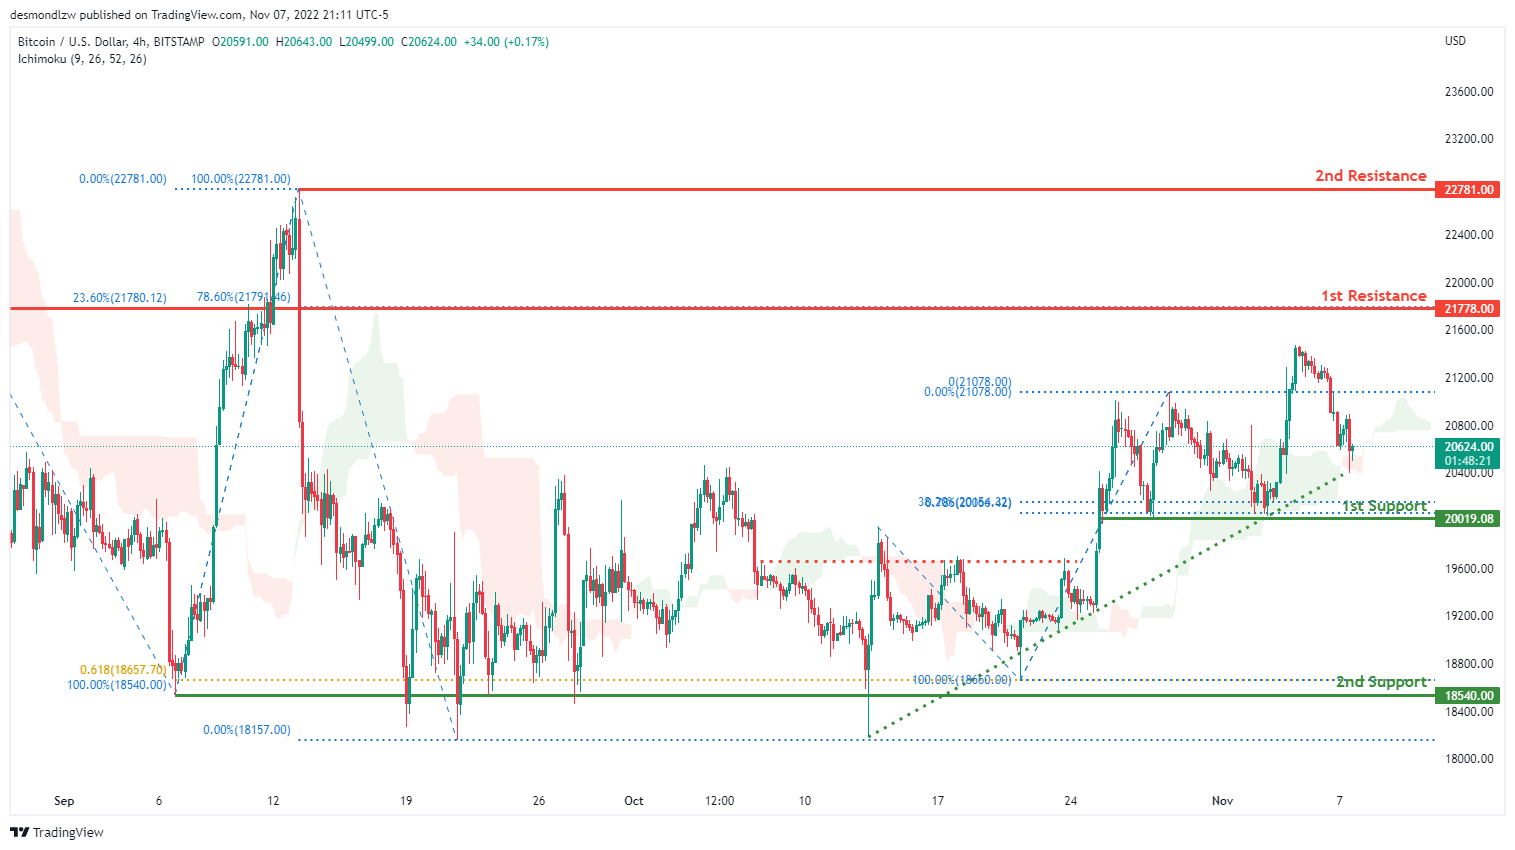
BTCUSD:
On the H4 chart, the overall bias for BTCUSD is bullish. To add confluence to this, the price is above the Ichimoku cloud which indicates a bullish market. Overnight, price continued its downwards bearish retracement towards the 1st support line. Price is currently trading at 20628.00 at time of writing. If this bullish momentum continues, expect the price to head towards the 1st resistance line at 21788.00 where the 78.6% and 23.6% Fibonacci lines are located. In an alternative scenario, price could continue its bearish retracement and head towards the 1st support line at 20019.08, where the 38.2% Fibonacci line and 78.6% Fibonacci projection line is located.
Areas of consideration:
- H4 time frame, 1st resistance 21778.00
- H4 time frame, 1st support at 20019.08
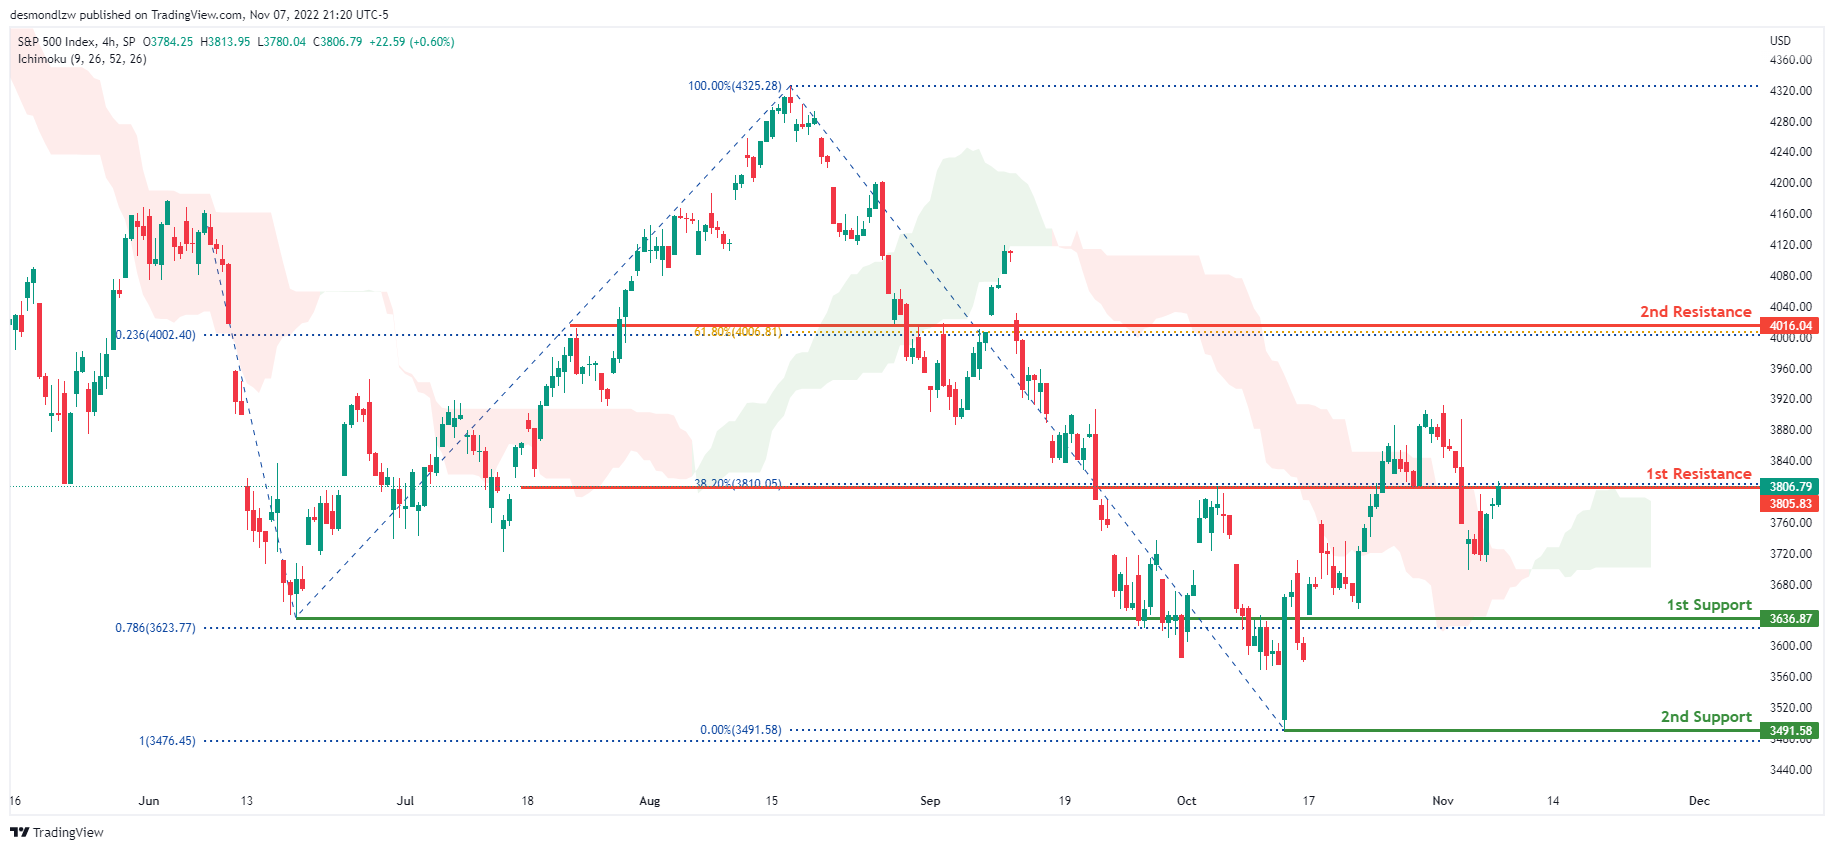
S&P 500:
On the H4 chart, the overall bias for S&P500 is bullish with price currently crossing above the Ichimoku cloud. Overnight, price had bullish momentum with the price closing under the 1st resistance at 3805.83 where the 38.2% Fibonacci line is located. The price is currently trading at 3805.83 at time of writing. If bullish momentum continues, expect price to price could break the 1st resistance line and head towards the 2nd resistance line at 4016.04, where the 23.6% Fibonacci projection line and 61.8% Fibonacci line is located. In an alternative scenario, price could possibly head towards the 1st support at 3636.87 where the previous swing low and 78.6% Fibonacci projection line is located.
Areas of consideration:
- H4 time frame, 1st support at 3636.87
- H4 time frame, 1st resistance at 3805.83
- H4 time frame, 2nd resistance at 4016.04


