
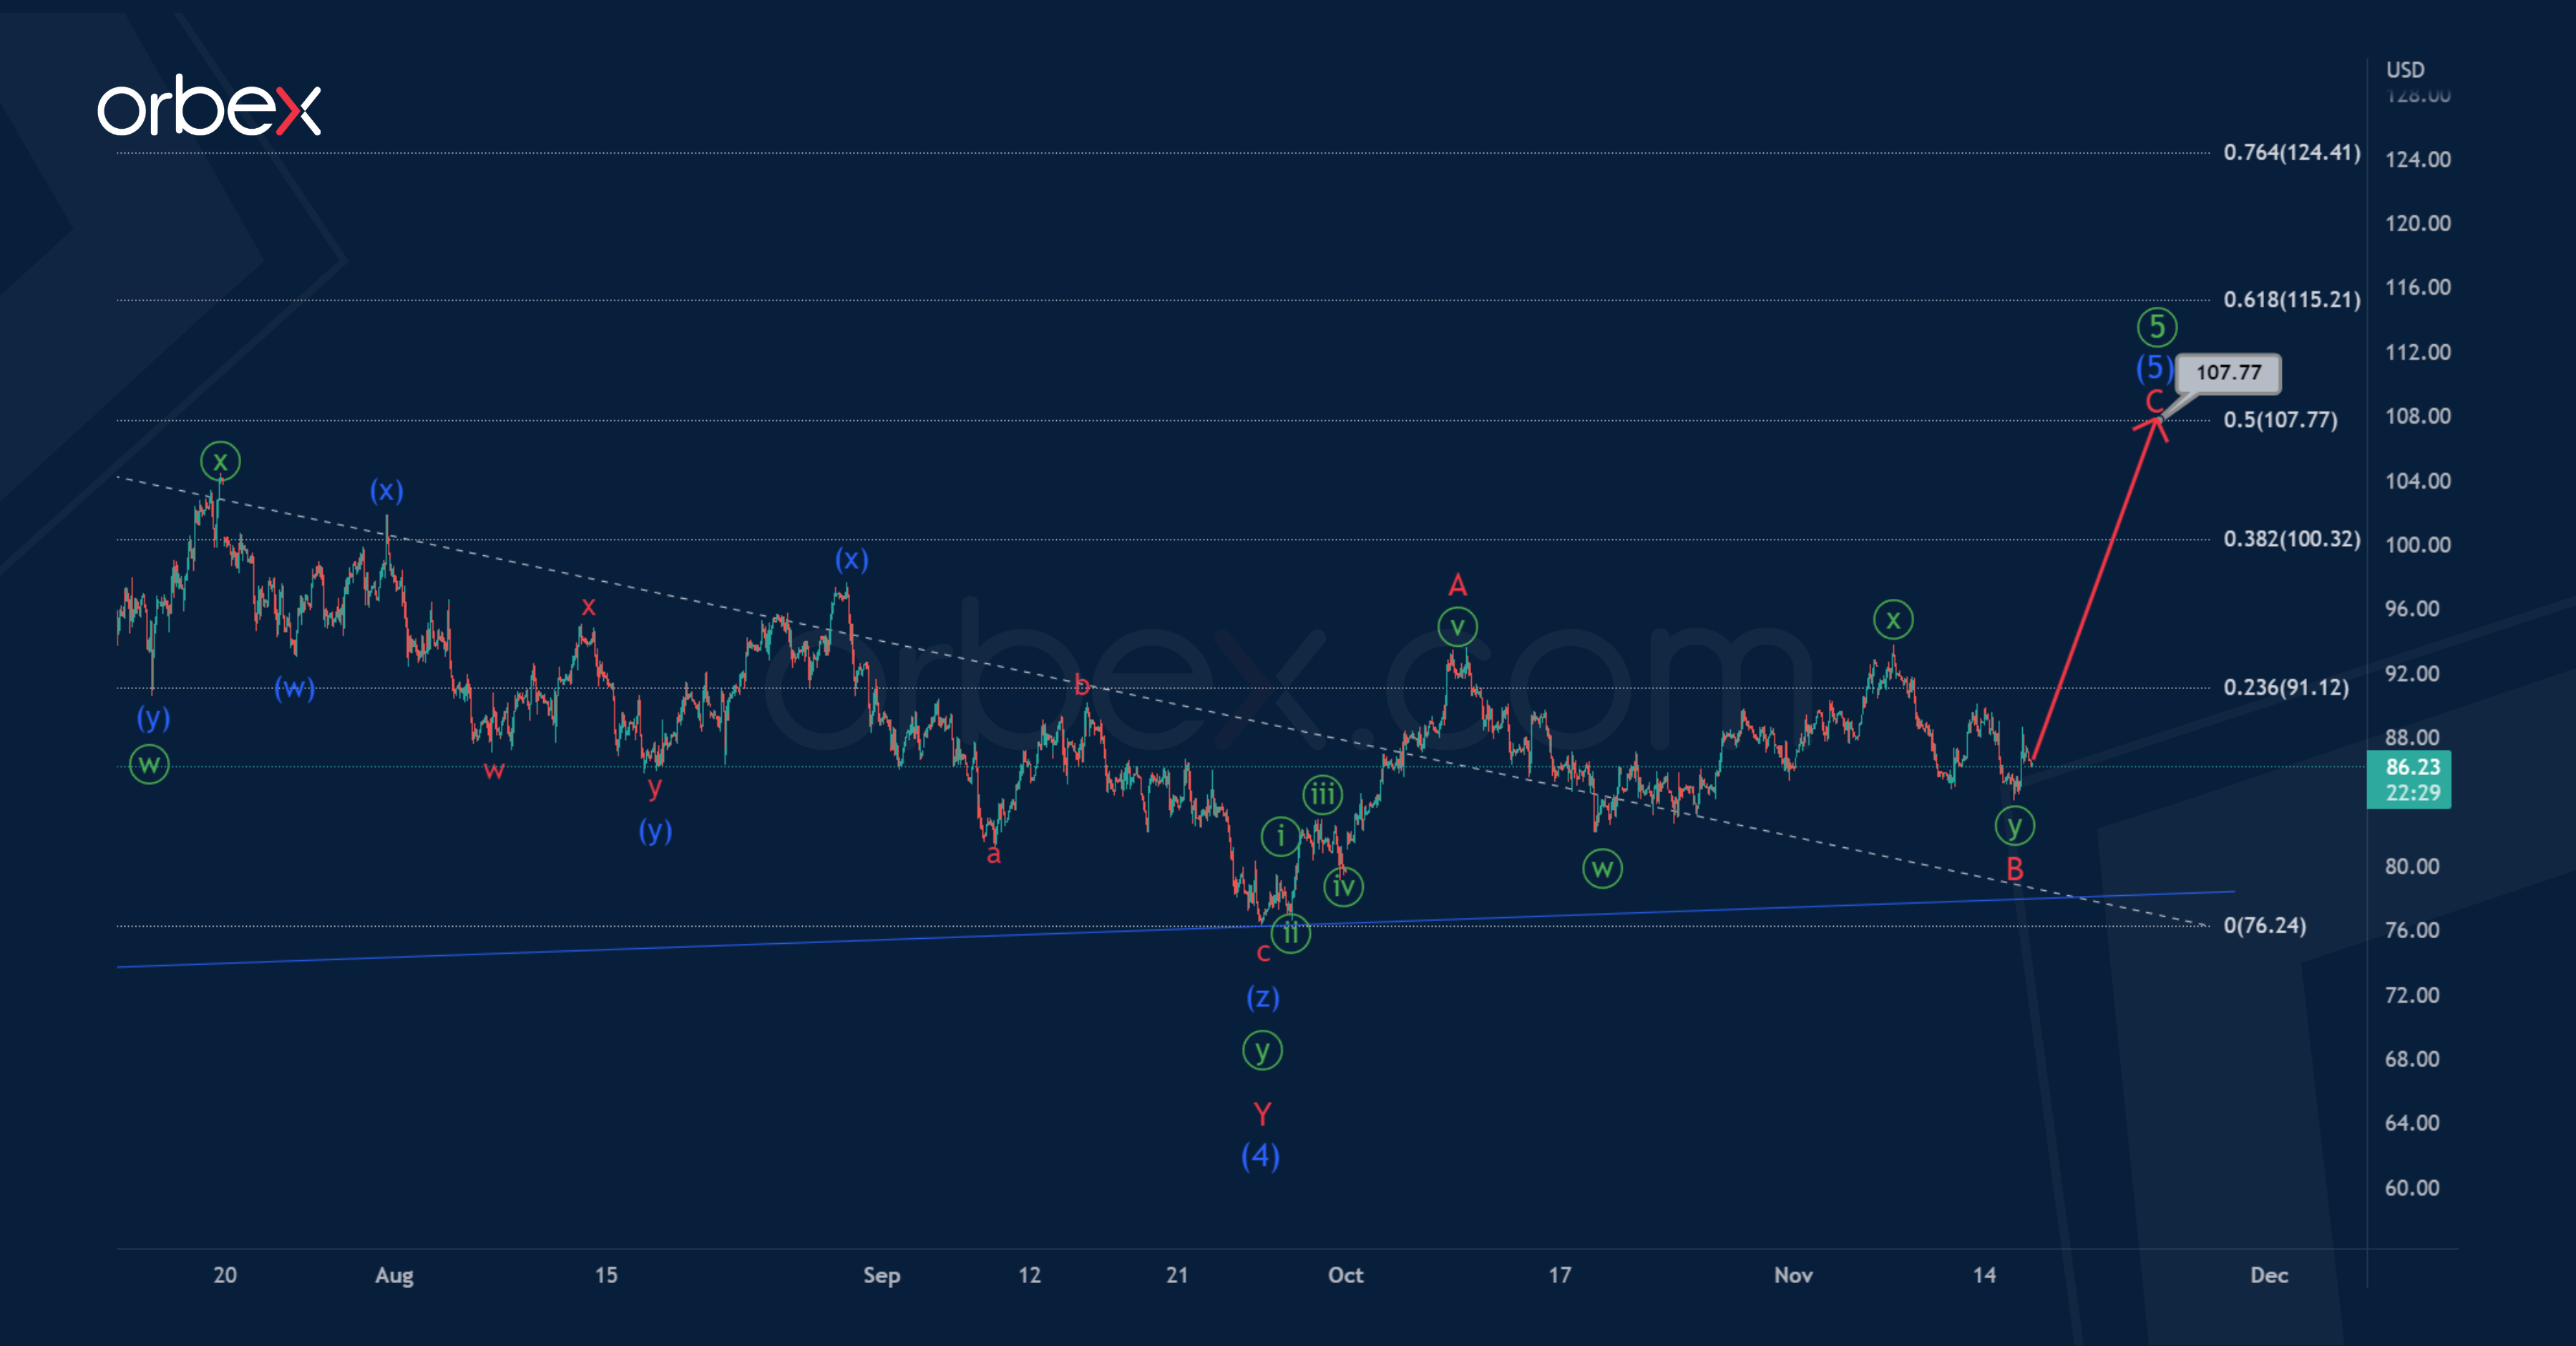
In the long term, USOIL seems to be forming a primary wave ⑤, which takes the form of an intermediate ending diagonal. On the 1H timeframe, we see its second half.
An intermediate correction (4) in the form of a minor double zigzag may have been completed at 76.24.
In the last section of the chart, we see the formation of an intermediate wave (5). It is assumed that the intermediate wave (5) will take the form of a standard 3-wave zigzag A-B-C, where the impulse A and correction B are completed.
The end of this construction is possible near 107.77. At that level, wave (5) will be at the 61.8% Fibonacci extension of impulse (3).
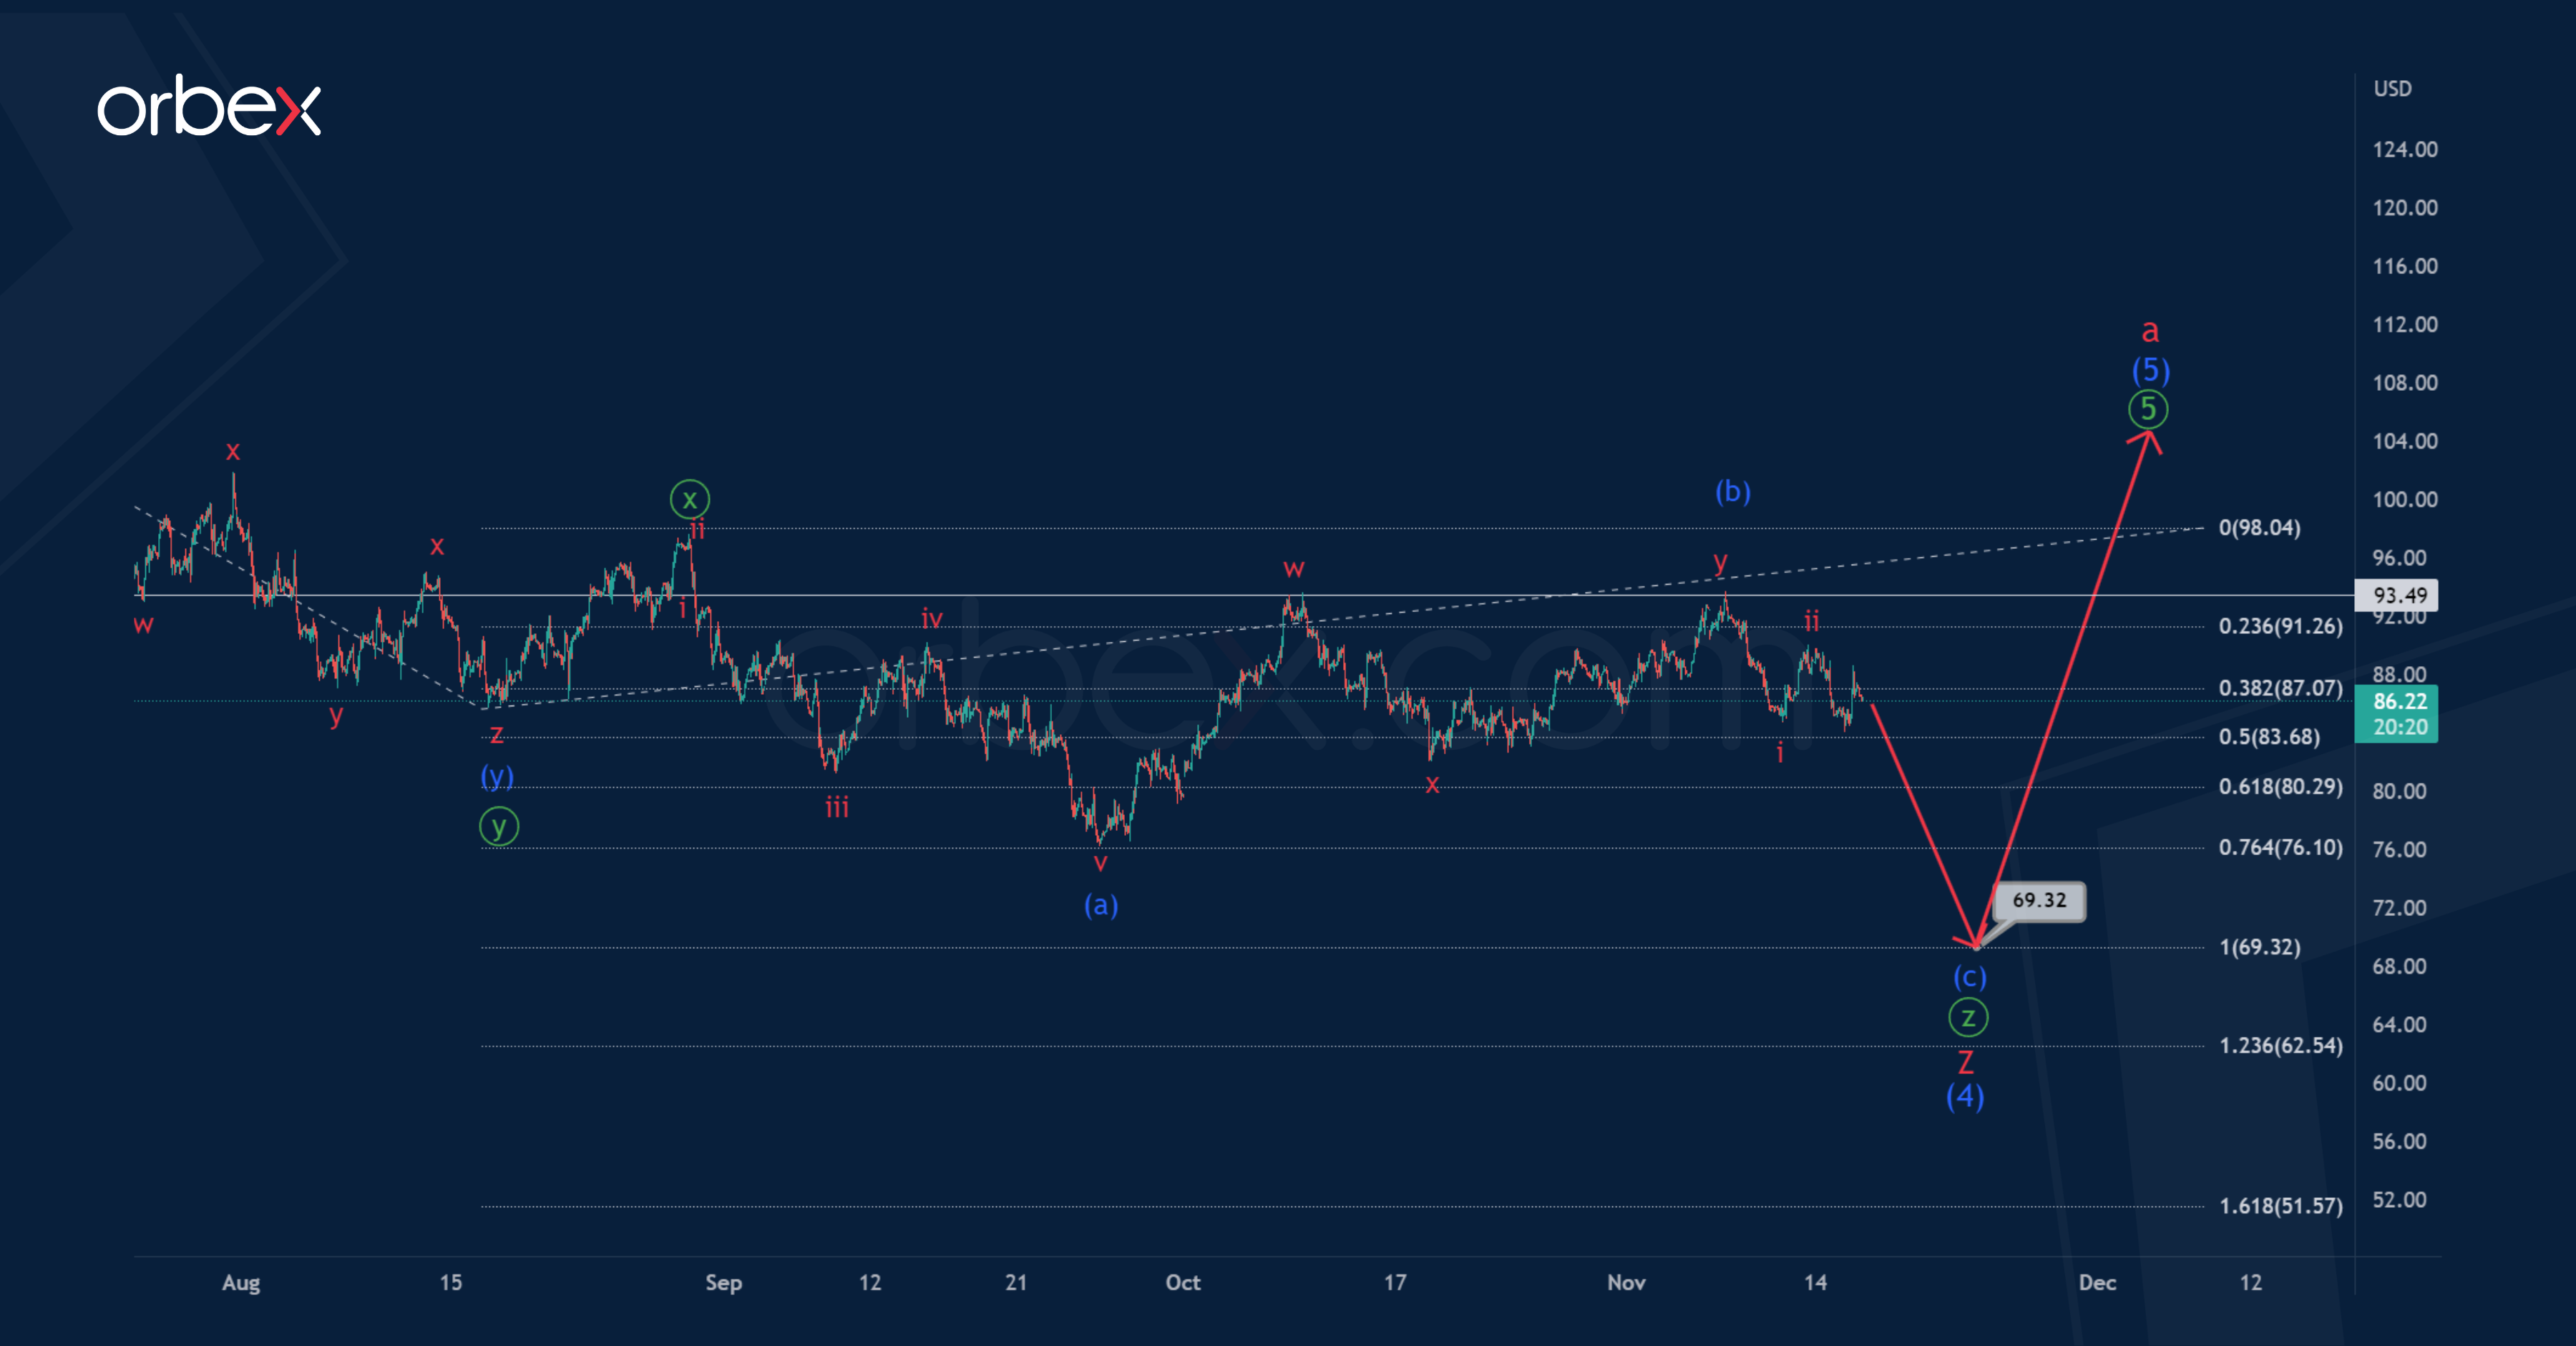
Alternatively, the construction of the intermediate correction (4) can be continued. It is assumed that it will have the form of a triple zigzag W-X-Y-X-Z, where the minor sub-waves W-X-Y-X can be completed.
Thus, in the near future, the downward movement is expected to continue in the final actionary sub-wave Z, which could be completed in the form of a minute triple zigzag ⓦ-ⓧ-ⓨ-ⓧ-ⓩ.
The price of oil may fall to 69.32. At that level, minute actionary waves ⓨ and ⓩ will be equal.


