
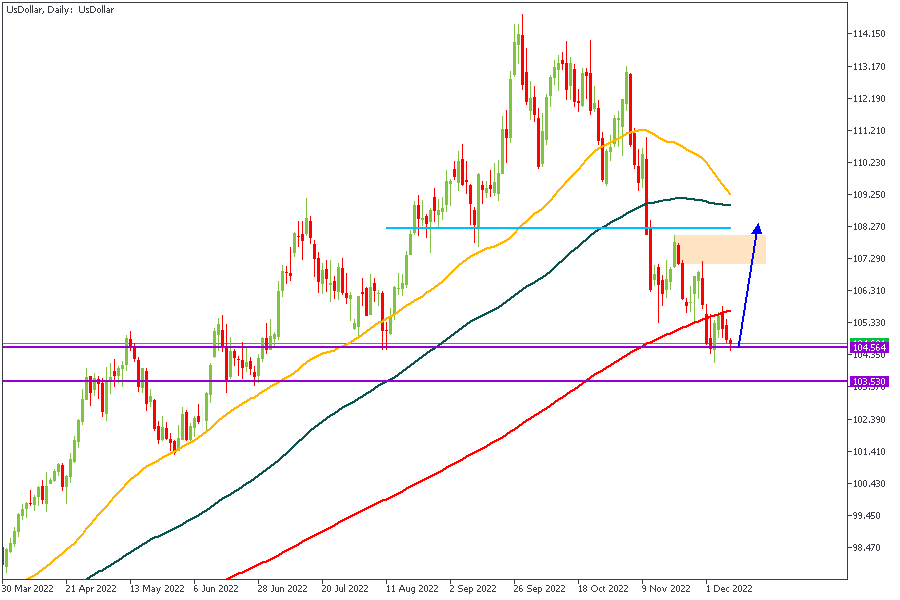
A comparative examination of the strength of the US-Dollar often gives tangible insight into the direction of Gold (XAUUSD). The chart above indicates the expectation of a bullish price reaction from the demand zone. Increased strength for the Dollar simply implies possible bearish reactions for Gold. With this in mind, let’s take a look at the Gold (XauUsd) chart.
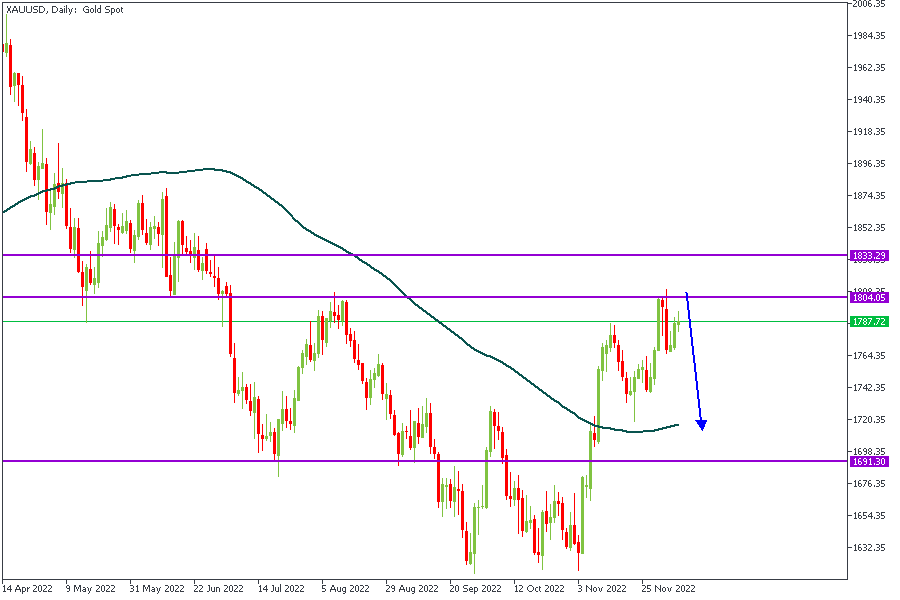
XAUUSD – DAILY
The daily timeframe presents an interesting scenario with the joint confluence of the Pivot zone and the drop-base-drop supply zone – not to forget the 200-Day Moving Average too. These factors line up perfectly in favour of a bearish reversal from the marked zone. Let’s take a deeper dive into the lower timeframe price action though.
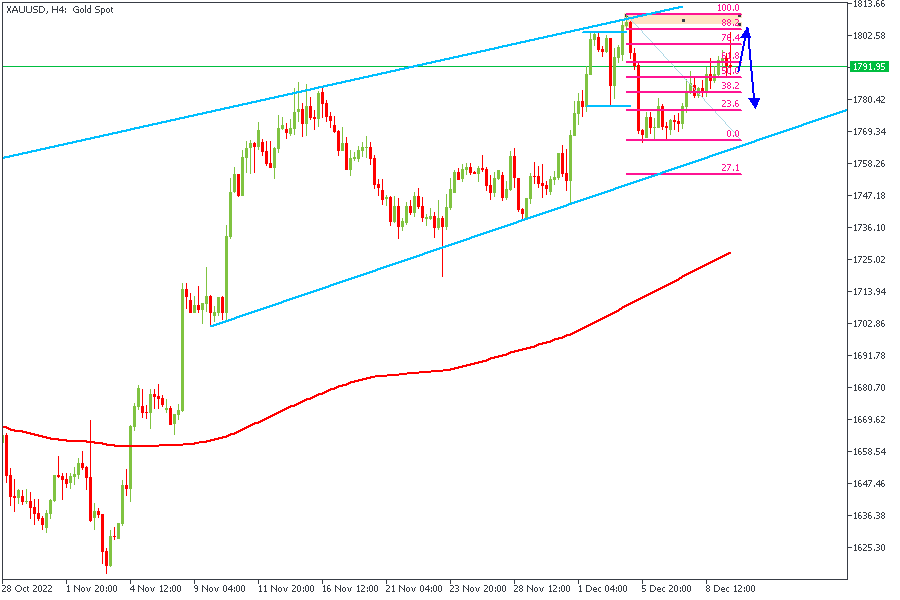
H4 TIMEFRAME
The 4-Hour timeframe shows price wedged between two trendlines but a lower timeframe view makes an even clearer impression.
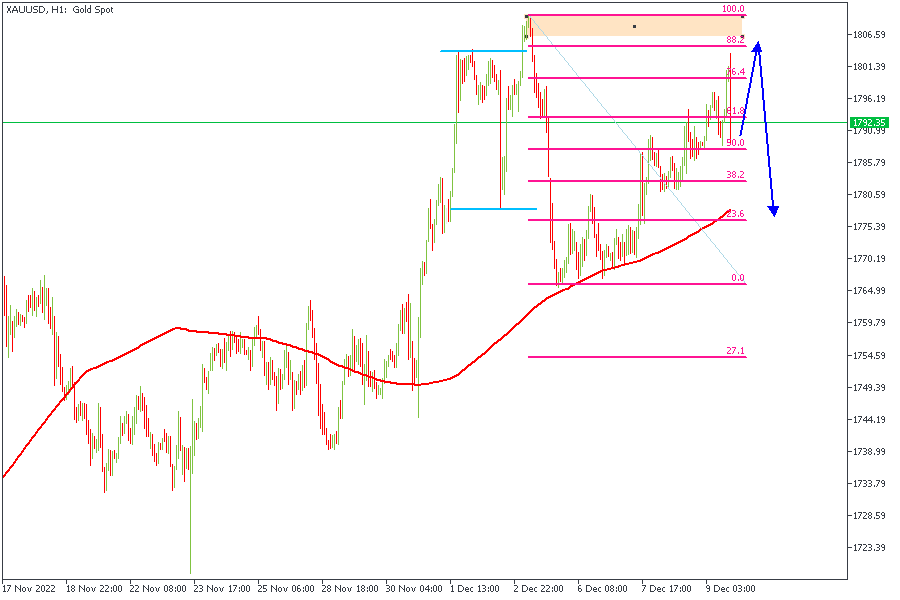
H1 TIMEFRAME
Here on the H1, price seems to be creating an AMD (Accumulation-Manipulation-Distribution) pattern over here which also serves as a bearish confirmation. Profit targets are; 1785, 1765, and 1755.
CONCLUSION
It is important to understand that the trading of CFDs comes at risk; if not properly managed, you may lose all of your trading capital. To avoid costly mistakes while you look to trade these opportunities, be sure to do your own due diligence and manage your risk appropriately.


