
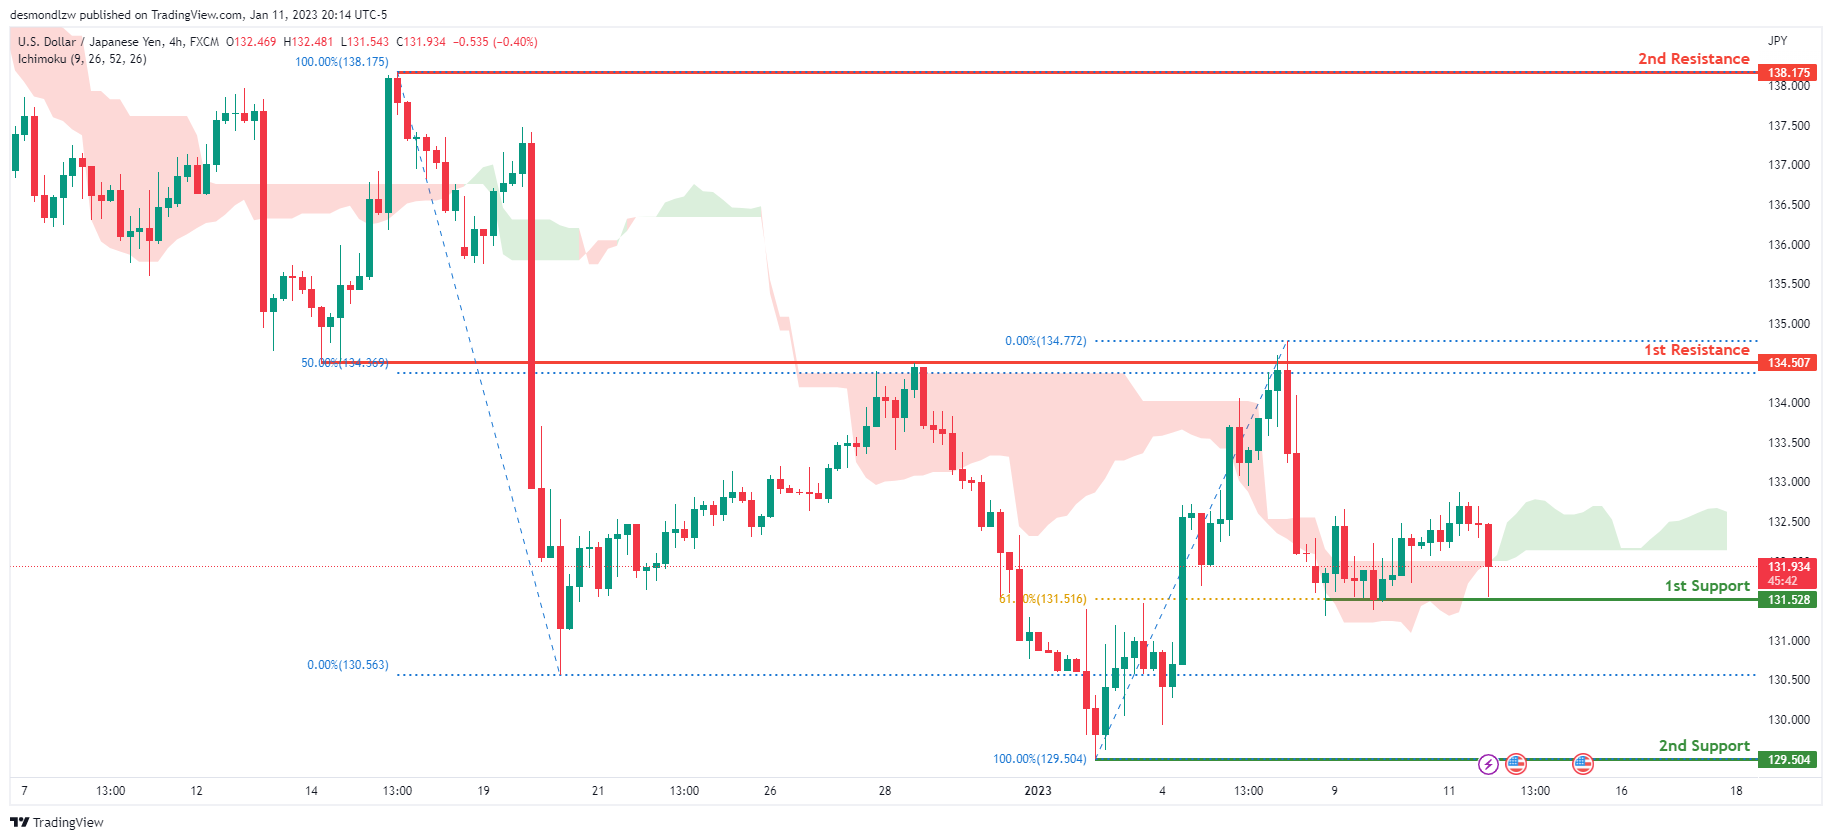
USD/JPY:
Looking at the H4 chart, my overall bias for USDJPY is bullish due to the current price being above the Ichimoku cloud, indicating a bullish market. If this bullish momentum continues, expect the price to possibly head back up towards the 1st resistance level at 134.507, where the 50% Fibonacci line is. In an alternate scenario, price could possibly break the 1st support at 131.528, where the 61.8% Fibonacci line is, before heading towards the 2nd support at 129.504, where the previous swing low is.
Areas of consideration:
- H4 time frame, 1st resistance at 134.507
- H4 time frame, 1st support at 131.528
- H4 time frame, 2nd support at 129.504
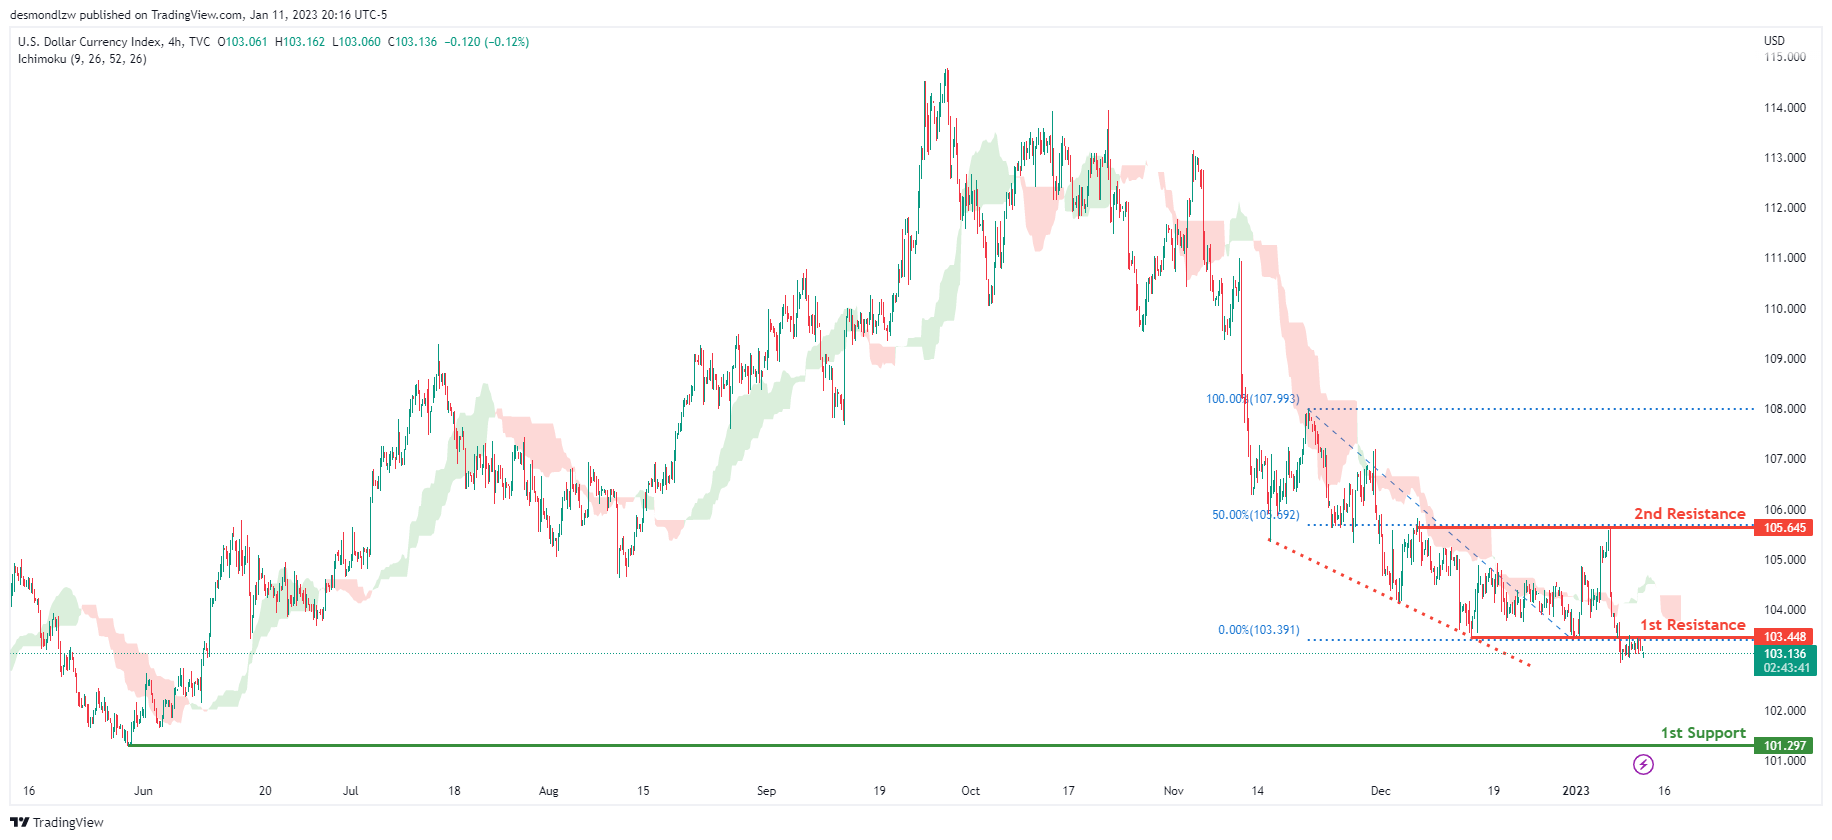
DXY:
Looking at the H4 chart, my overall bias for DXY is bearish due to the current price being below the Ichimoku cloud, indicating a bearish market. To add confluence to this, price is along a descending trend line which indicates a bearish market. If this bearish momentum continues, expect the price to possibly continue heading towards the 1st support at 101.297, where the previous lows and liquidity hotspots are. In an alternative scenario, price could head back up to retest the 1st resistance at 103.448, where the previous low is.
Areas of consideration:
- H4 time frame, 1st resistance at 103.448
- H4 time frame, 1st support at 101.297
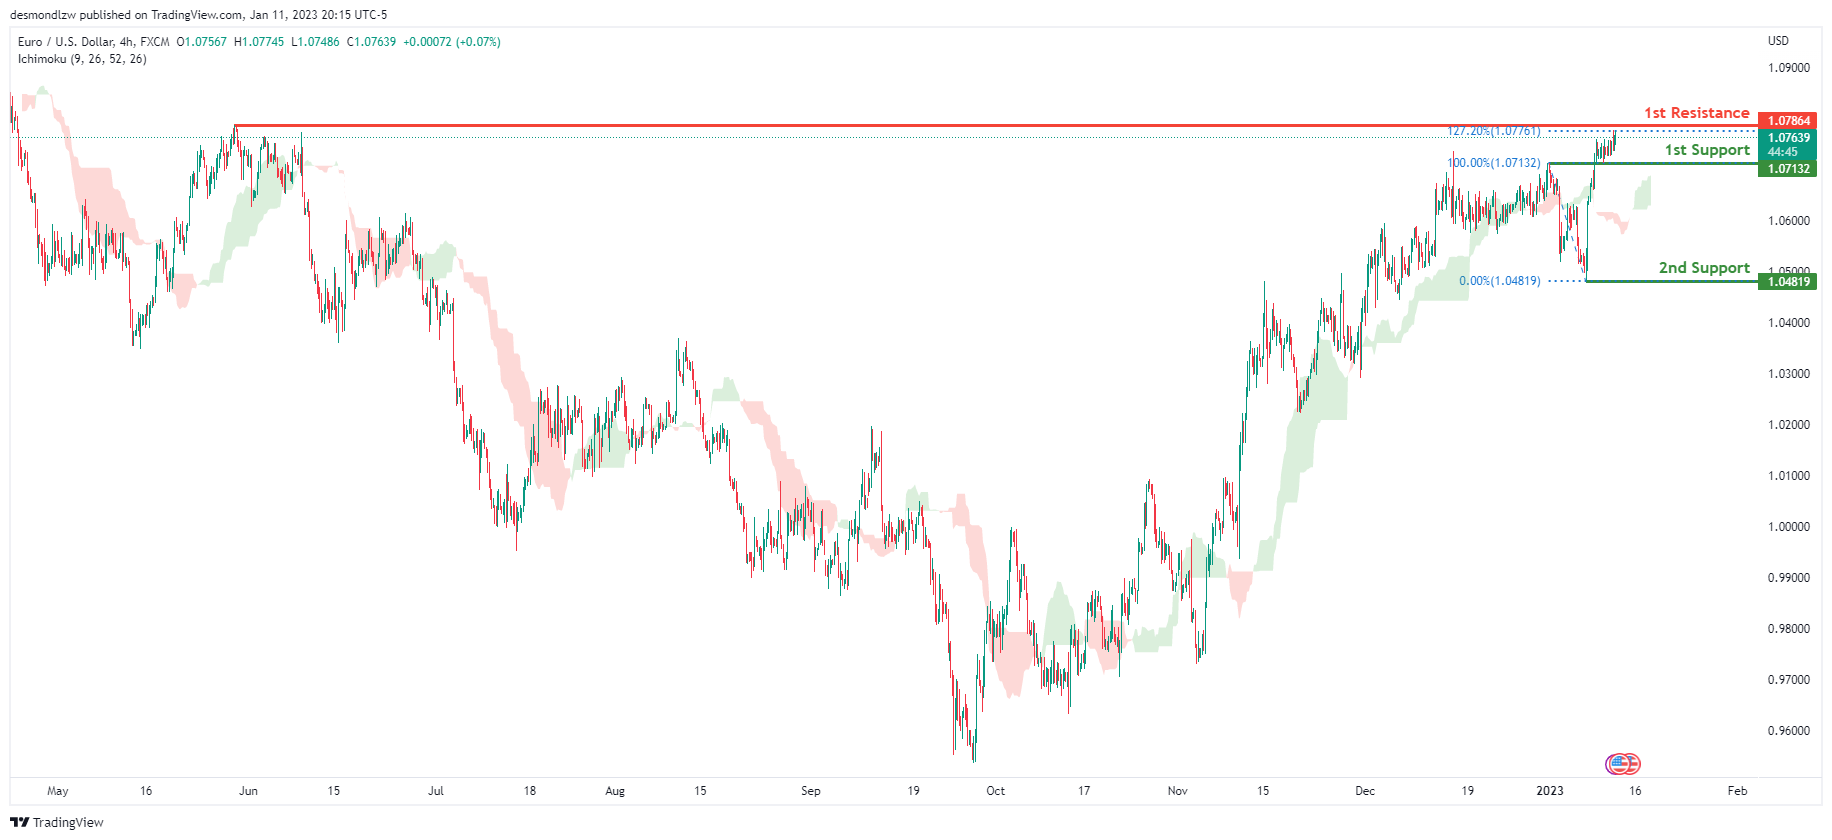
EUR/USD:
Looking at the H4 chart, my overall bias for EURUSD is bullish due to the current price being above the Ichimoku cloud, indicating a bullish market structure. If this bullish momentum continues, expect the price to possibly continue heading towards the 1st resistance at 1.07864, where the previous swing high is. In an alternate scenario, price could possibly head back down to retest the 1st support level at 1.07132, where the previous swing high is.
Areas of consideration :
- H4 1st resistance at 1.07864
- H4 1st support at 1.07132
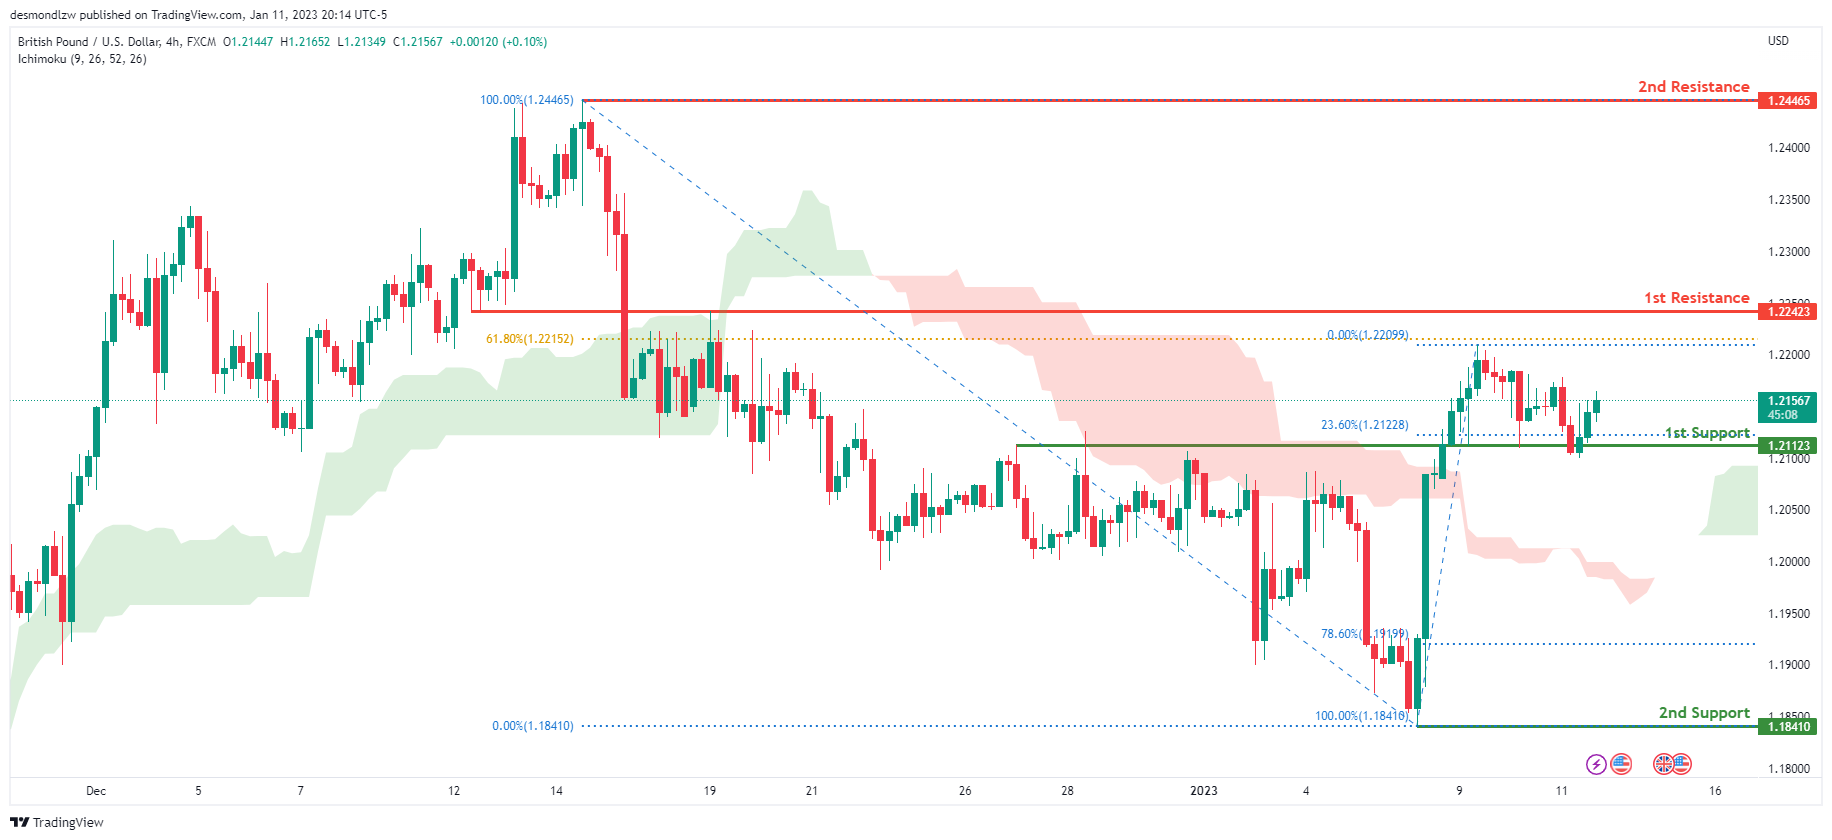
GBP/USD:
Looking at the H4 chart, my overall bias for GBPUSD is bullish due to the current price being above the Ichimoku cloud, indicating a bullish market. If this bullish momentum continues, expect price to possibly continue heading towards the 1st resistance line at 1.22423, slightly above where the 61.8% Fibonacci line is. In an alternate scenario, price could possibly head back down towards the 1st support at 1.21123, where the 23.6% Fibonacci line is
Areas of consideration:
- H4 1st resistance at 1.22423
- H4 1st support at 1.21068
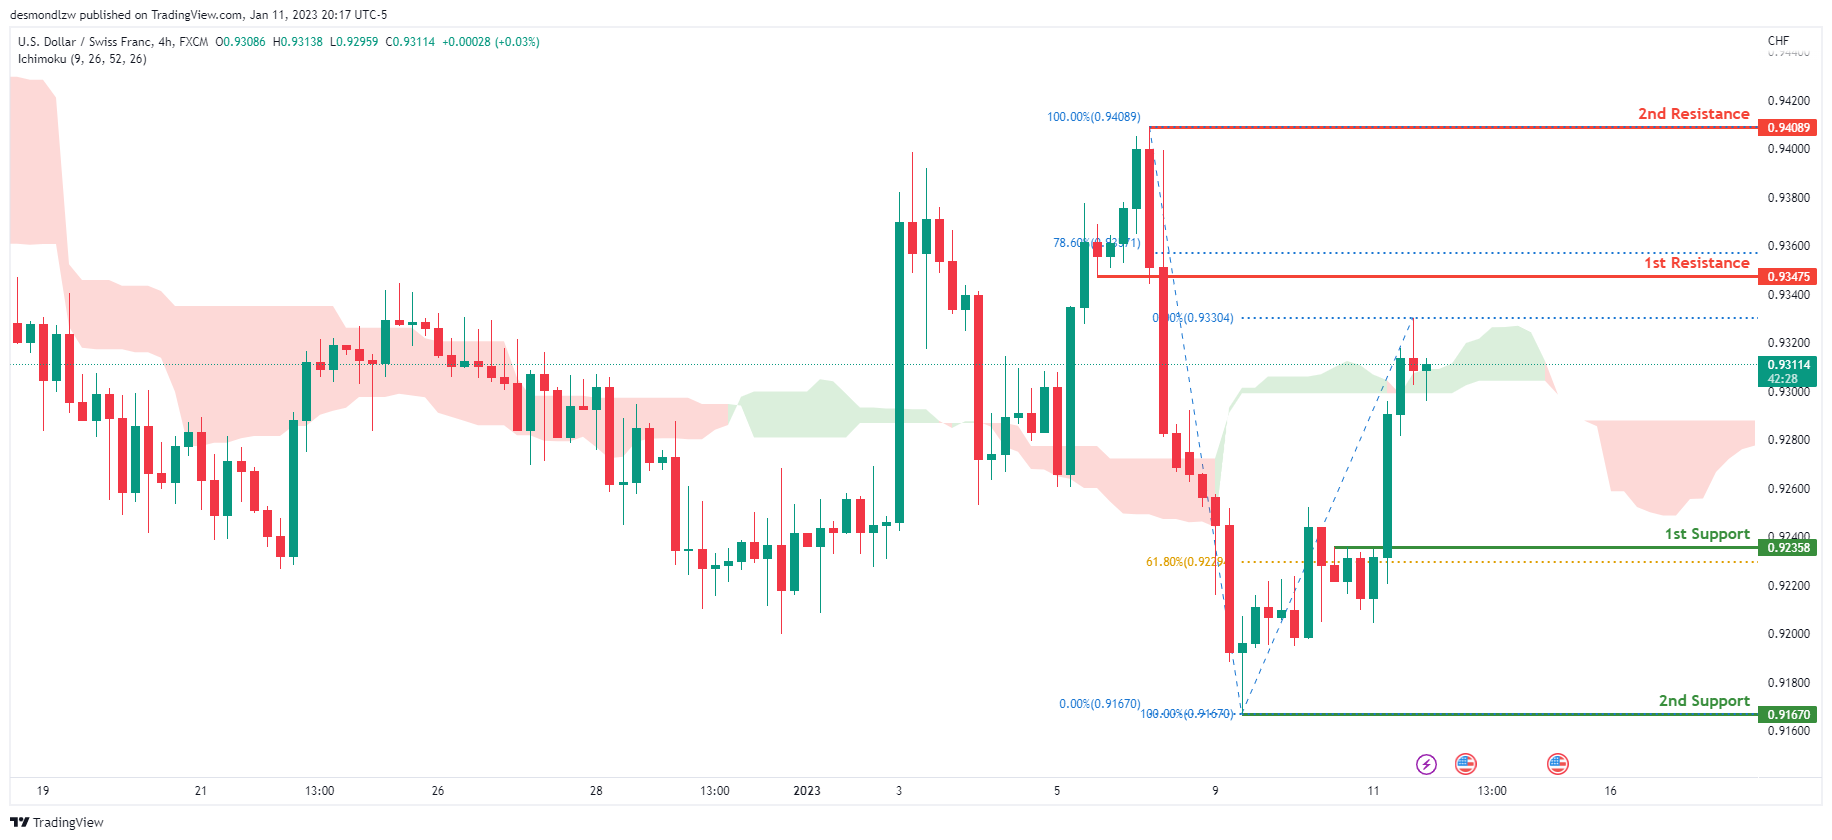
USD/CHF:
Looking at the H4 chart, my overall bias for USDCHF is bullish due to the current price being above the Ichimoku cloud, indicating a bullish market. If the current bullish trend continues, expect the price to head towards the 1st resistance at 0.93475, where the 78.6% Fibonacci line is. In an alternative scenario, price could possibly head back down to retest the 1st support at 0.92358, where the 61.8% Fibonacci line is.
Areas of consideration
- H4 1st support at 0.92358
- H4 1st resistance at 0.93475
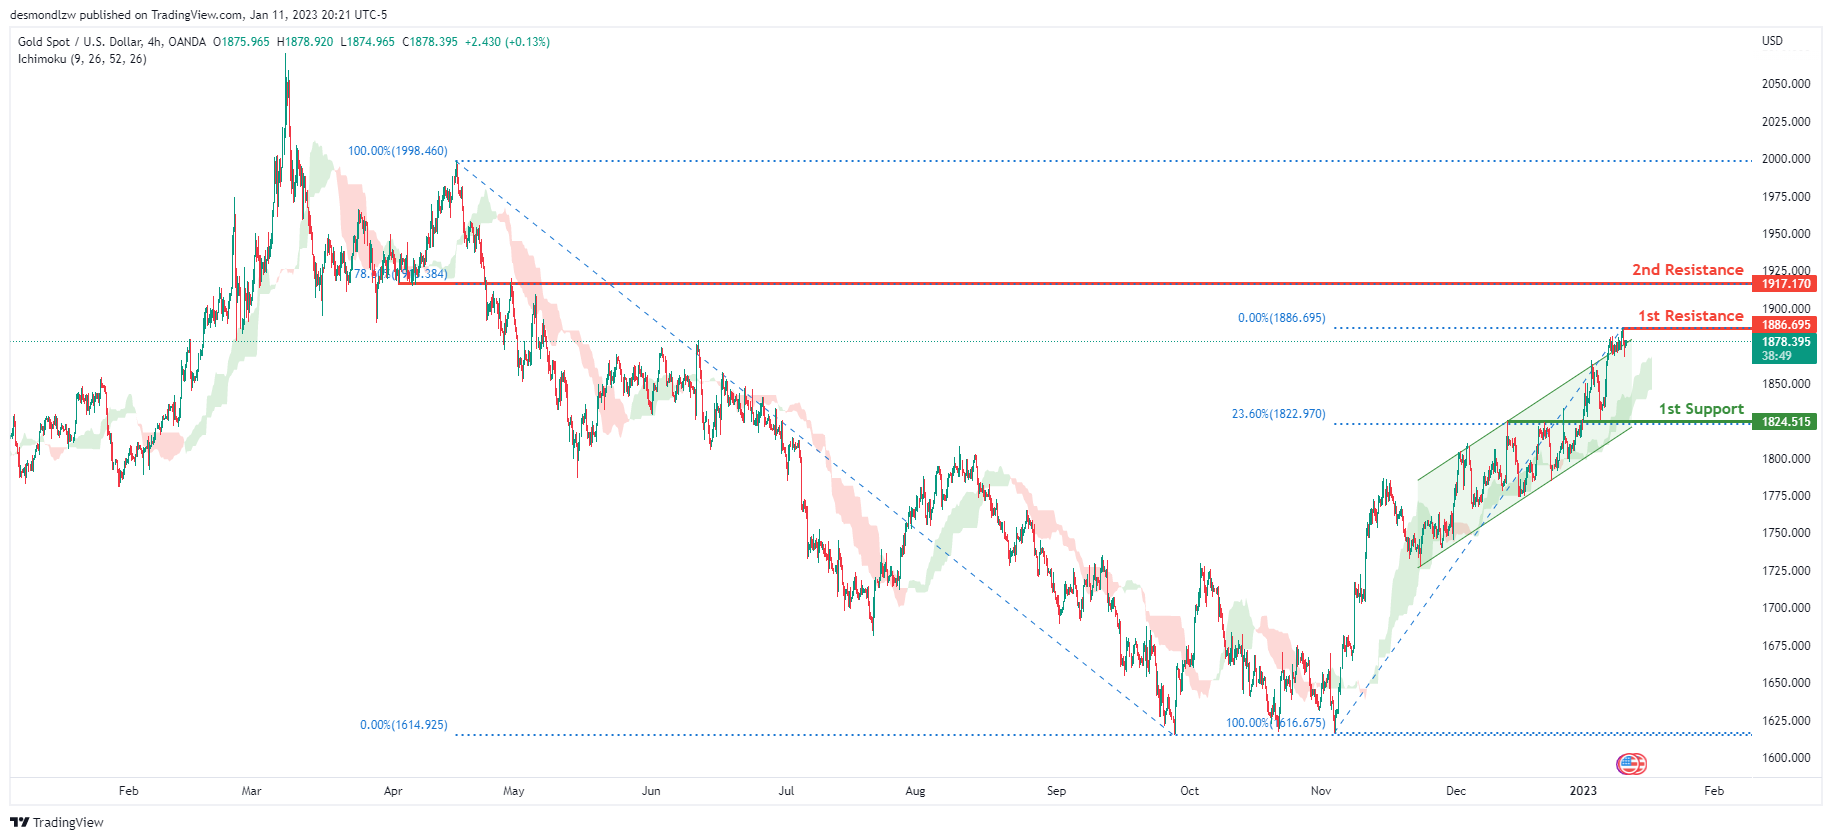
XAU/USD (GOLD):
Looking at the H4 chart, my overall bias for XAUUSD is bullish due to the current price crossing above the Ichimoku cloud, indicating a bullish market. To add support to this bias, price has also broken above the bullish ascending channel. If this bullish momentum continues, expect the price to possibly break the 1st resistance at 1886.695 where the recent high is, before heading towards the 2nd resistance at 1917.170, where the 78.6% Fibonacci line is. In an alternative scenario, price could possibly head back down towards the 1st support at 1824.515, where the 23.6% Fibonacci line is.
Areas of consideration:
- H4 time frame, 1st resistance at 1886.695
- H4 time frame, 2nd resistance at 1917.170
- H4 time frame, 1st support at 1824.515
- H4 time frame, 2nd support at 1833.445
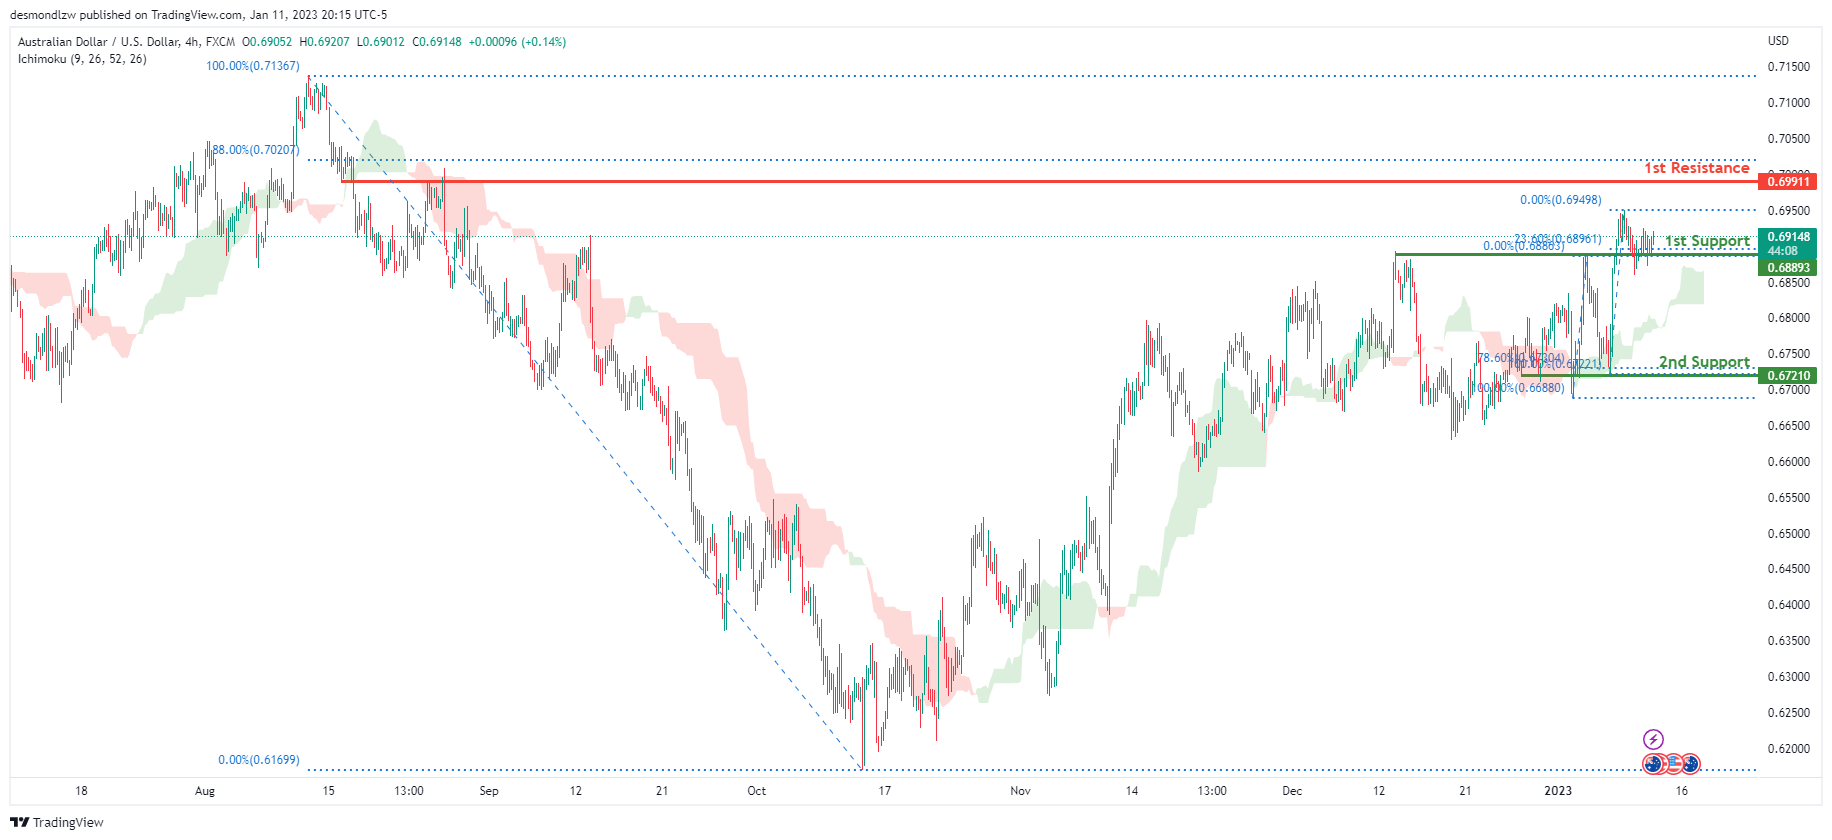
AUD/USD:
Looking at the H4 chart, my overall bias for AUDUSD is bullish due to the current price being above the Ichimoku cloud, indicating a bullish market. If this bullish momentum continues, expect the price to continue heading towards the 1st resistance at 0.69911, where the 88% Fibonacci line is. In an alternative scenario, price could possibly head back down towards the 1st support at 0.68893, where the 23.6% Fibonacci line is.
Areas of consideration
- H4, 1st resistance at 0.69911
- H4, 1st support at 0.68893
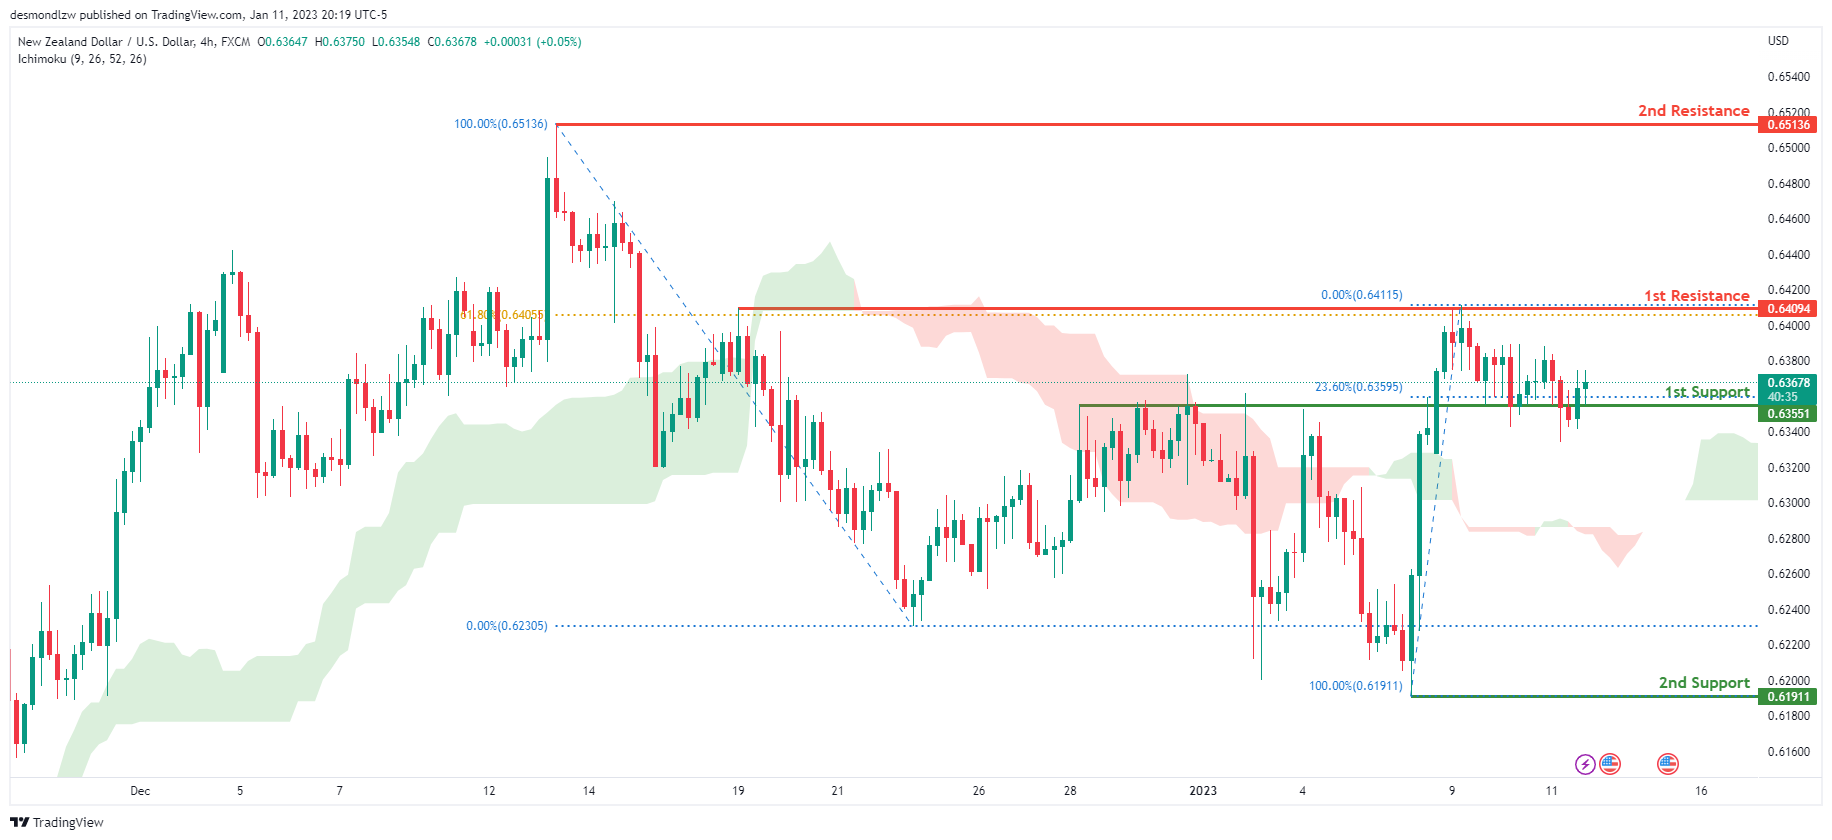
NZD/USD:
Looking at the H4 chart, my overall bias for NZDUSD is bullish due to the current price being above the Ichimoku cloud, indicating a bullish market. If this bullish momentum continues, expect price to possibly continue heading towards the 1st resistance at 0.64094, where the 61.8% Fibonacci line is. In an alternate scenario, price could possibly head back down to retest the 1st support at 0.63551, where the 23.6% Fibonacci line is
Areas of consideration:
- H4 time frame, 1st resistance at 0.64094
- H4 time frame, 1st support at 0.63551
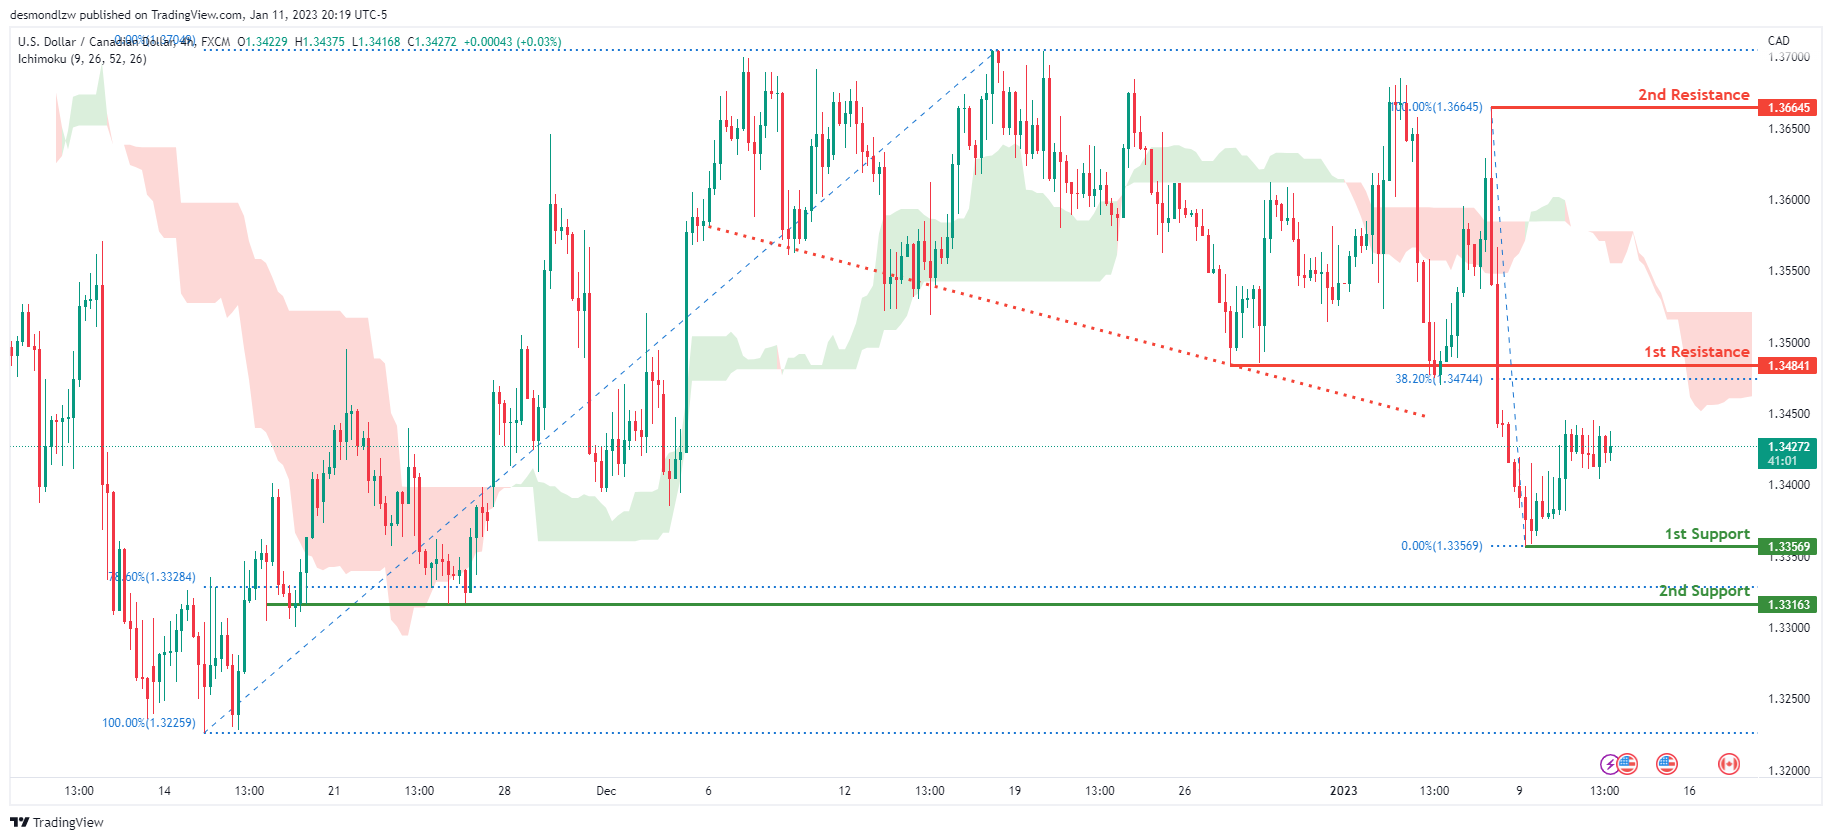
USD/CAD:
On the H4 chart, the overall bias for USDCAD is bearish. To add confluence to this, the price is below the Ichimoku cloud which indicates a bearish market. To add support to this bias, price has also broken under the descending trendline indicating strong bearish momentum. If this bearish momentum continues, expect the price to possibly head towards the 1st support at 1.33569, where the recent low is. In an alternative scenario, price could head back up to retest the 1st resistance at 1.34841, where the 38.2% Fibonacci line is.
Areas of consideration:
- H4 time frame, 1st resistance at 1.34841
- H4 time frame, 1st support at 1.33569
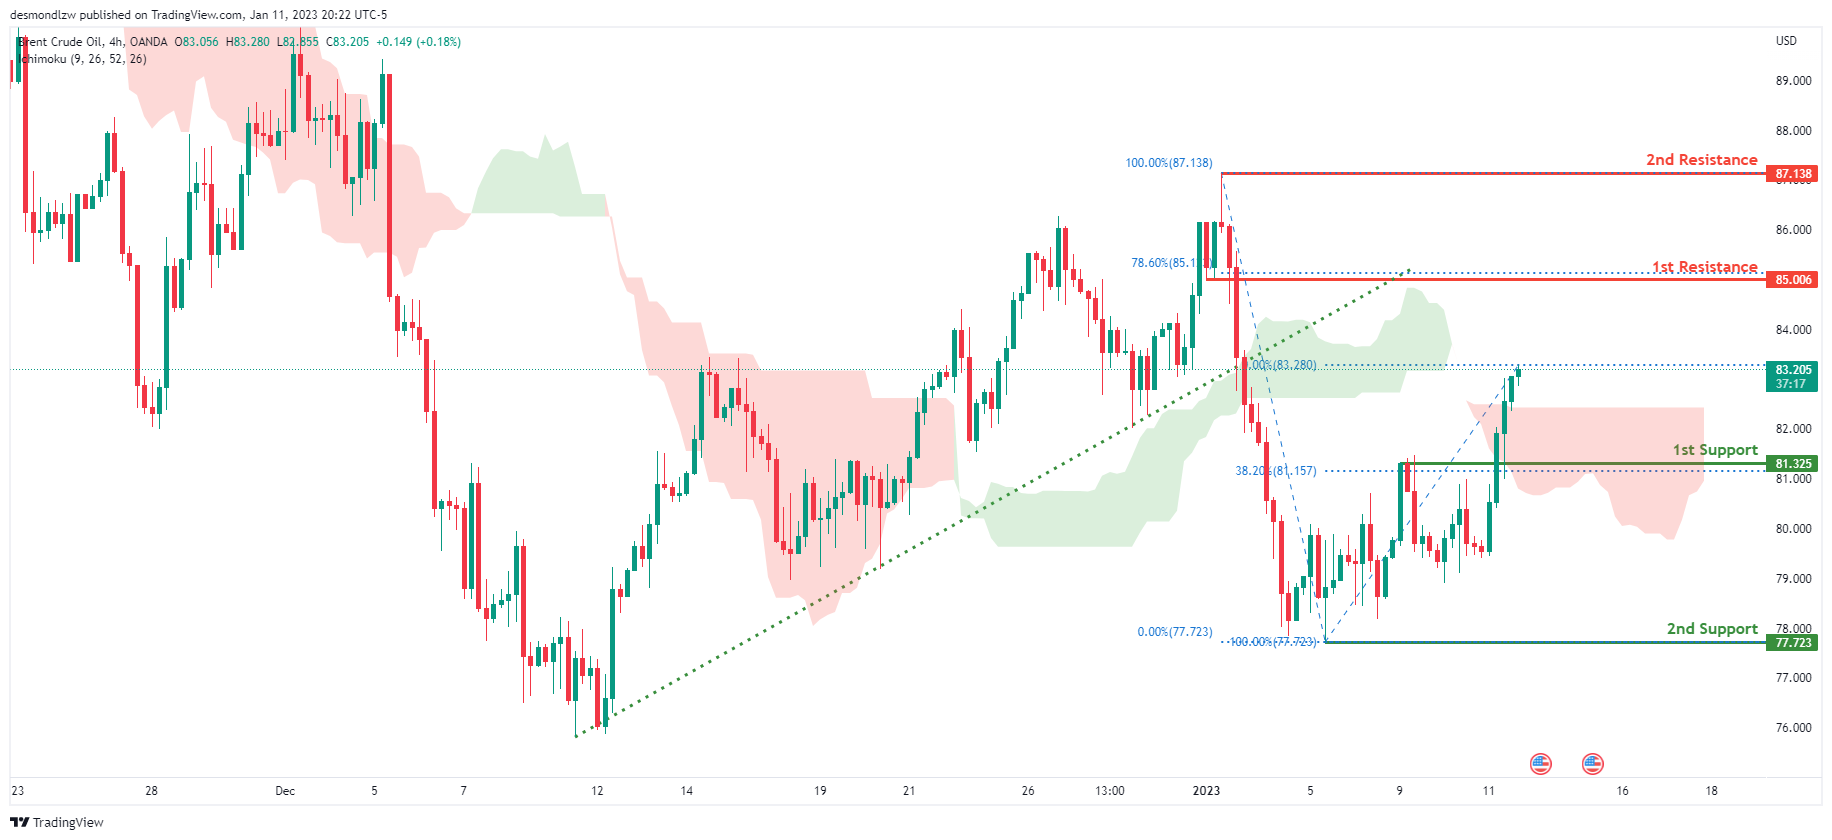
OIL:
Looking at the H4 chart, my overall bias for BCOUSD is bullish due to the current price crossing above the Ichimoku cloud, indicating a bullish market. If this bullish momentum continues, expect the price to possibly continue heading towards the 1st resistance at 85.006, where the 78.6% Fibonacci line is. In an alternate scenario, price could possibly head back down to retest the 1st support at 81.325, slightly below where the 38.2% Fibonacci line is
Areas of consideration:
- H4 time frame, 1st resistance at 85.006
- H4 time frame,1st support at 81.325
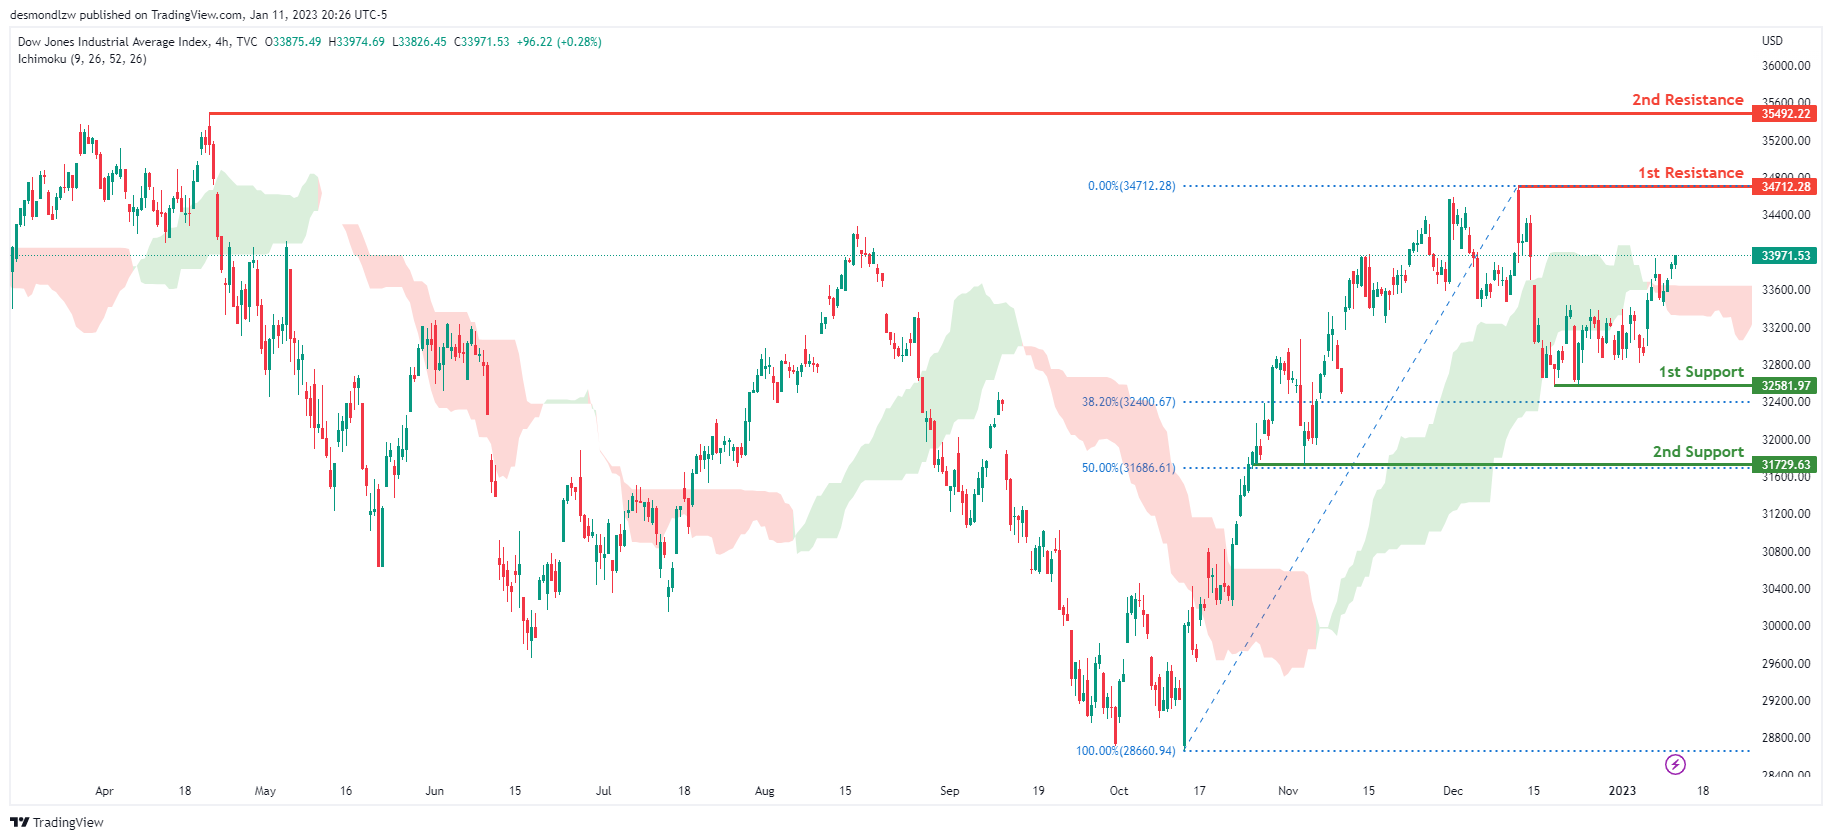
Dow Jones Industrial Average:
On the H4 chart, the overall bias for DJI is bearish. To add confluence to this, the price is crossing below the Ichimoku cloud which indicates a bearish market. If this bearish momentum continues, expect the price to head back down towards the 1st support at 32581.97, slightly above where the 38.2% Fibonacci line is. In an alternative scenario, price could possibly continue heading towards the 1st resistance line at 34712.28, where the recent swing high is.
Areas of consideration:
- H4 time frame, 1st support at 32581.97
- H4 time frame, 1st Resistance at 34712.28
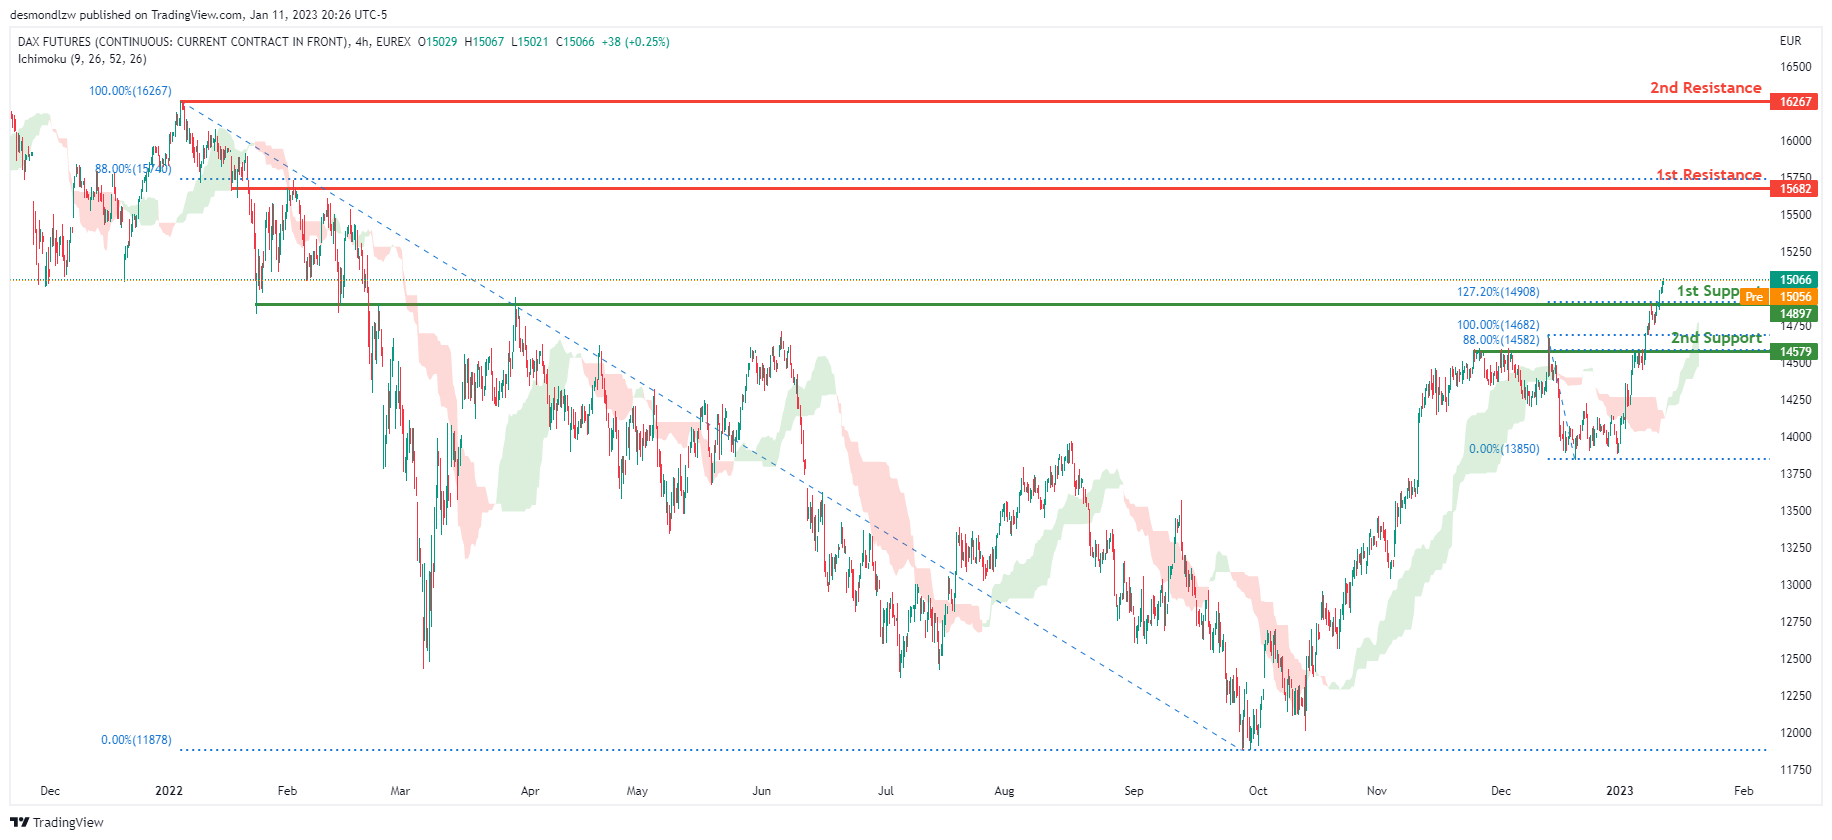
DAX:
Looking at the H4 chart, my overall bias for DAX is bullish due to the current price crossing above the Ichimoku cloud, indicating a bullish market. If this bullish momentum continues, expect the price to possibly head towards the 1st resistance line at 15682, where the 88% Fibonacci line is. In an alternative scenario, price could possibly head down to break the 1st support at 14897, where the 127.2% Fibonacci extension line is, before heading towards the 2nd support at 14579, where the 88% Fibonacci line is.
Areas of consideration:
- H4 time frame, 1st resistance is at 15682
- H4 time frame, 1st support is at 14897
- H4 time frame, 2nd support is at 14579
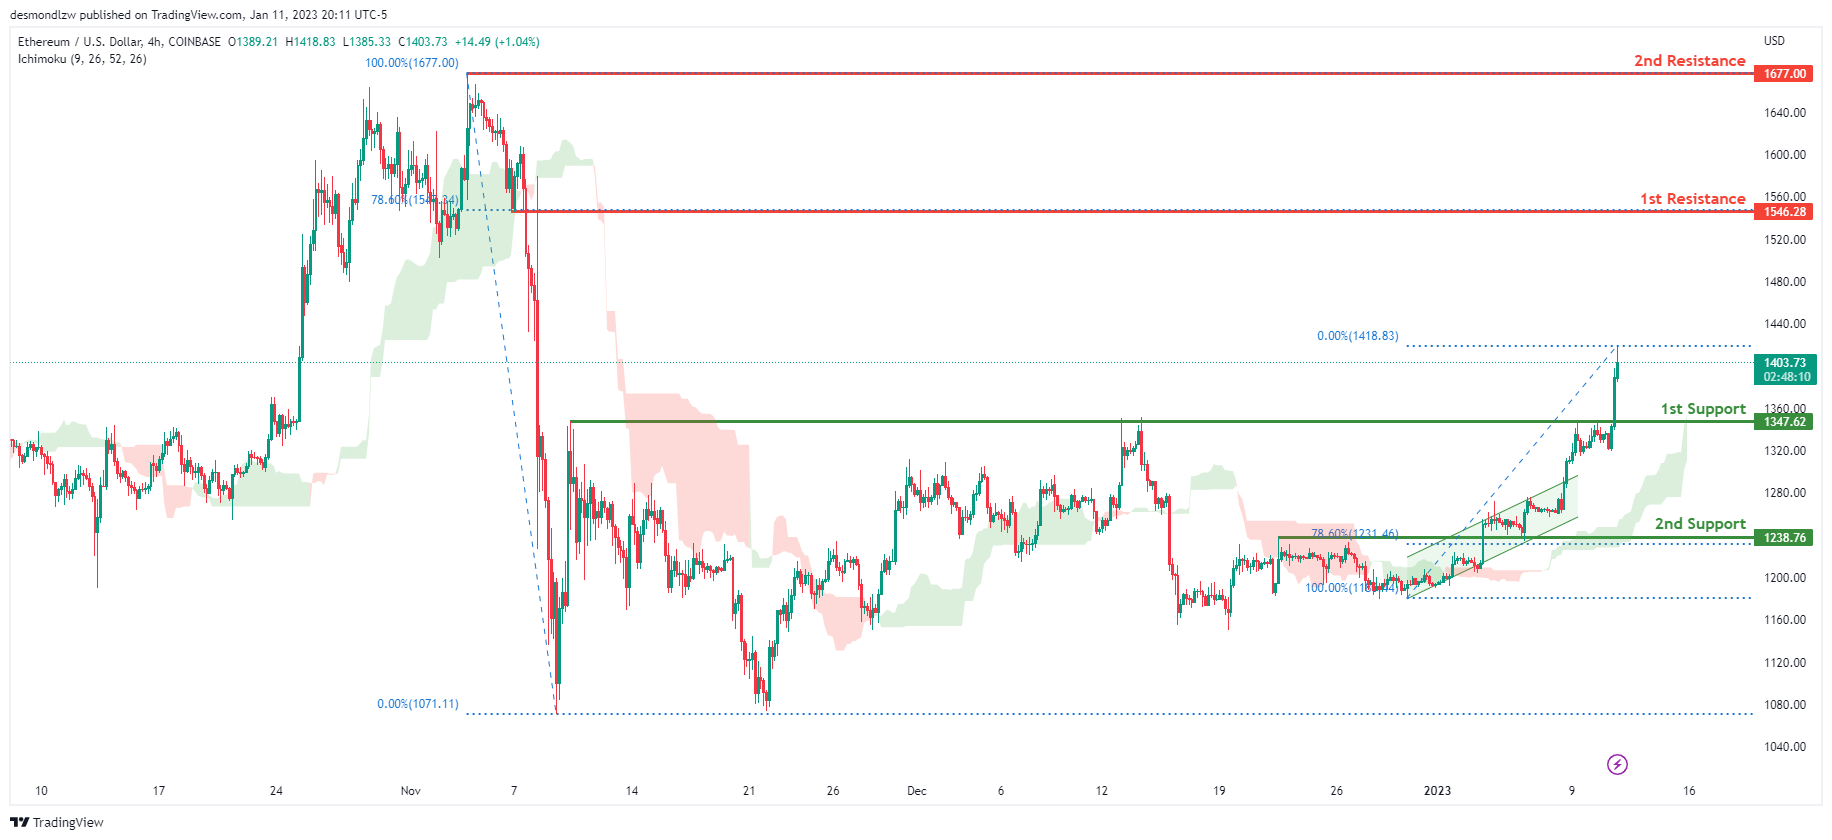
ETHUSD:
Looking at the H4 chart, my overall bias for ETHUSD is bullish due to the current price crossing above the Ichimoku cloud, indicating a bullish market. To add support to this bias, price is also broken upwards from an ascending channel. If this bullish momentum continues, expect the price to head towards the 1st resistance at 1546.28, where the 78.6% Fibonacci line is. In an alternative scenario, price could head back down to retest the 1st support at 1347.62, where the previous high is.
Areas of consideration:
- H4 time frame, 1st resistance of 1546.28
- H4 time frame, 1st support at 1347.62
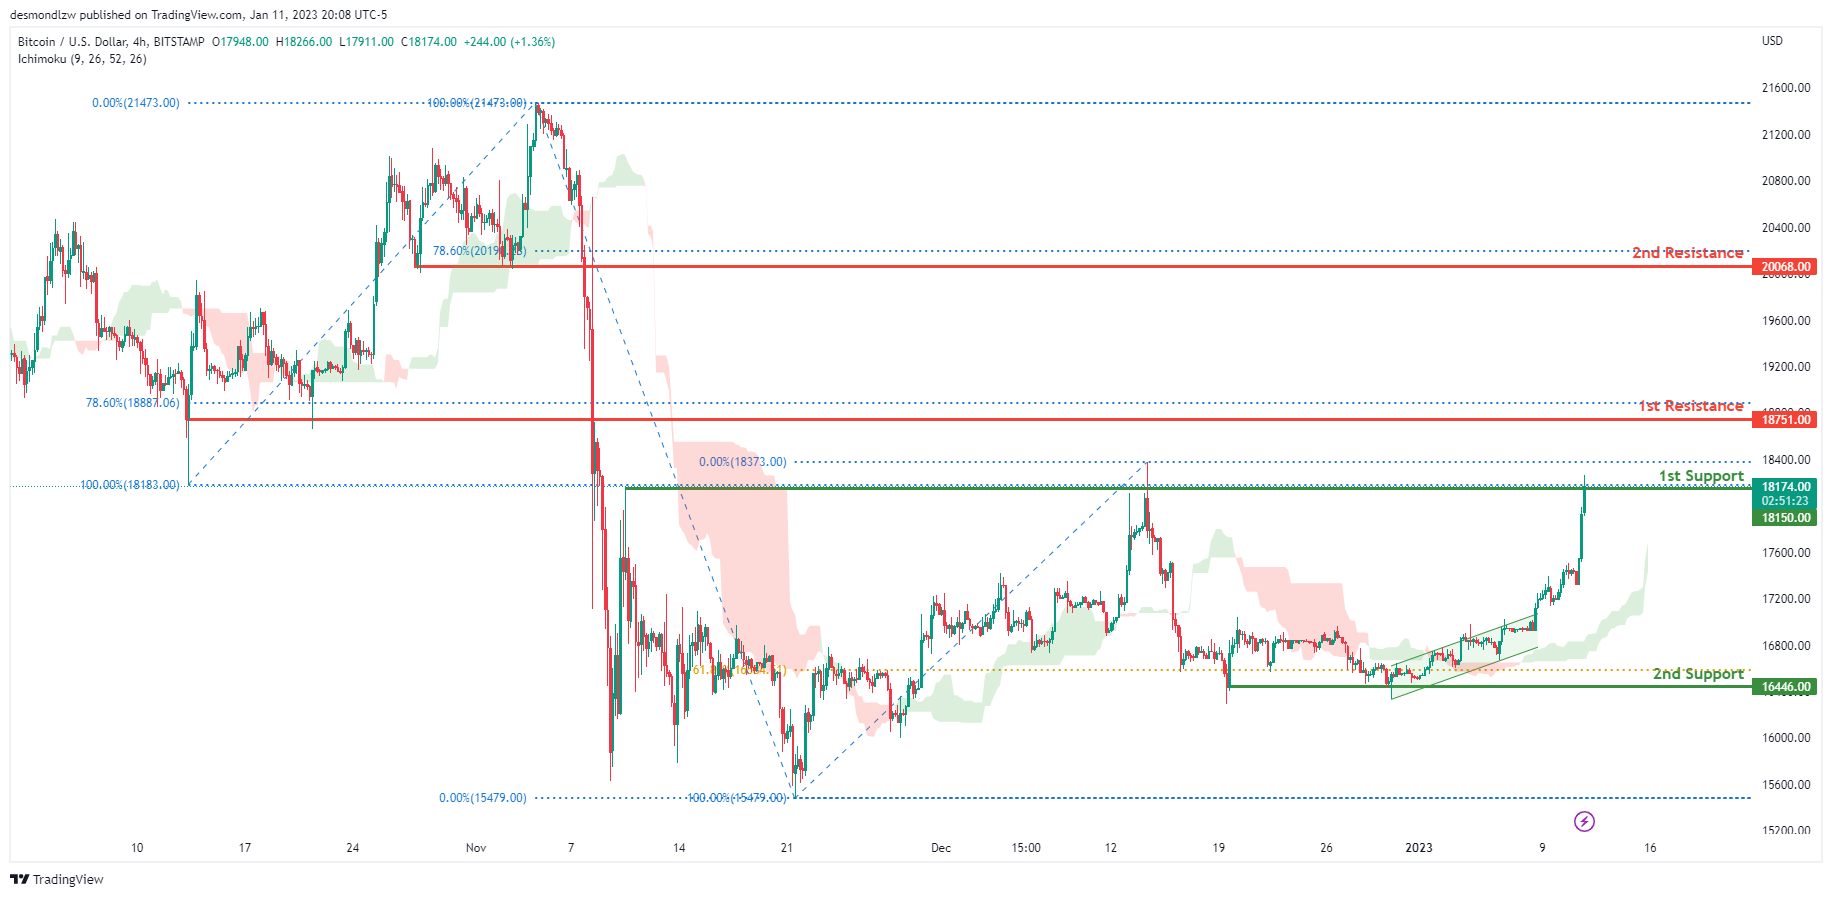
BTCUSD:
Looking at the H4 chart, my overall bias for BTCUSD is bullish due to the current price being above the Ichimoku cloud, indicating a bullish market. To add support to this bias, price has also broken above a bullish ascending channel. If this bullish momentum continues, expect the price to possibly continue heading towards the 1st resistance at 18751.00, where the 78.6% Fibonacci line is. In an alternative scenario, price could possibly head back down breaking the 1st support at 18150.00, where the recent high is, before heading towards the 2nd support at 16446.00, where the 61.8% Fibonacci line is.
Areas of consideration:
- H4 time frame, 1st resistance 18751.00
- H4 time frame, 1st support at 18150.00
- H4 time frame, 2nd support at 16446.00
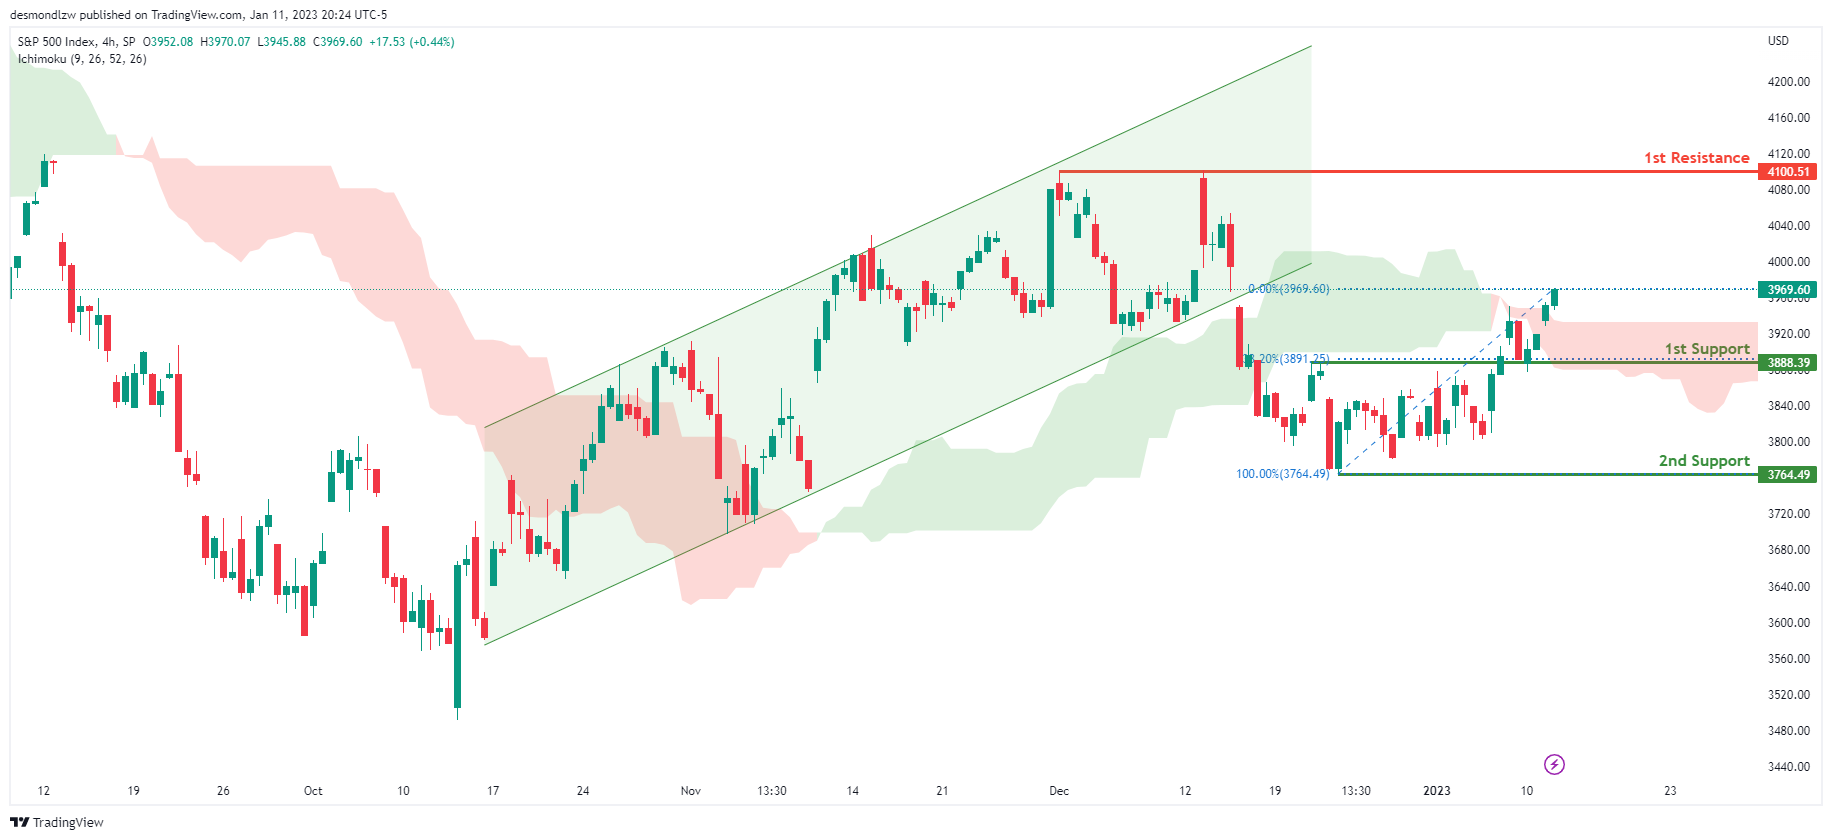
S&P 500:
Looking at the H4 chart, my overall bias for S&P500 is bullish due to the current price being above the Ichimoku cloud, indicating a bullish market. If this bullish momentum continues, expect the price to continue heading towards the 1st resistance at 4100.51, where the previous high is. In an alternative scenario, price could possibly head back down to retest the 1st support at 3888.39, where the 38.2% Fibonacci line is.
Areas of consideration:
- H4 time frame, 1st support at 3888.39
- H4 time frame, 1st resistance at 4100.51


