
USD/JPY:
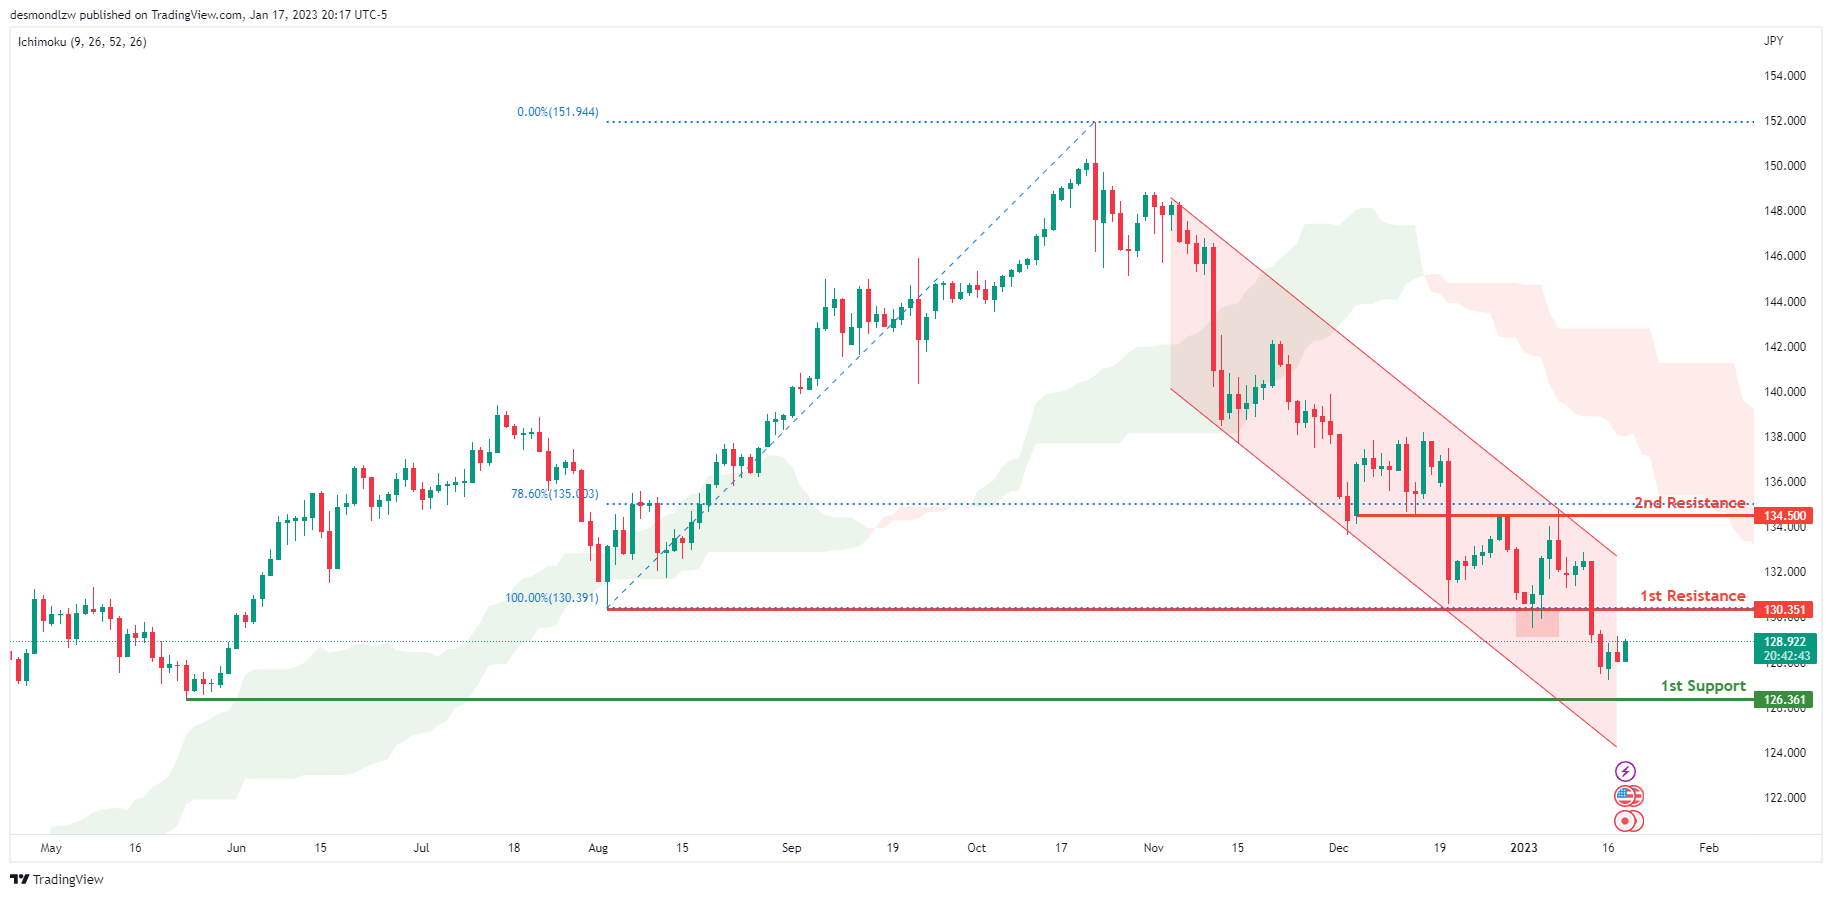
Looking at the Daily chart, my overall bias for USDJPY is bearish due to the current price being below the Ichimoku cloud, indicating a bearish market. To add confluence to this bias, price is also within a descending channel. If this bearish momentum continues, expect the price to possibly continue heading towards the 1st support level at 126.361, where the previous swing low is. In an alternate scenario, price could possibly head back up to retest the 1st resistance at 130.351, where the previous swing low is.
Areas of consideration:
- H4 time frame, 1st resistance at 130.351
- H4 time frame, 1st support at 126.361
DXY:
Looking at the Daily chart, my overall bias for DXY is bearish due to the current price being below the Ichimoku cloud, indicating a bearish market. If this bearish momentum continues, expect the price to possibly continue heading towards the 1st support at 101.300, where the previous low is. . In an alternative scenario, price could head back up to retest the 1st resistance at 103.463, where the 23.6% Fibonacci line is.
Areas of consideration:
- H4 time frame, 1st resistance at 103.463
- H4 time frame, 1st support at 101.300

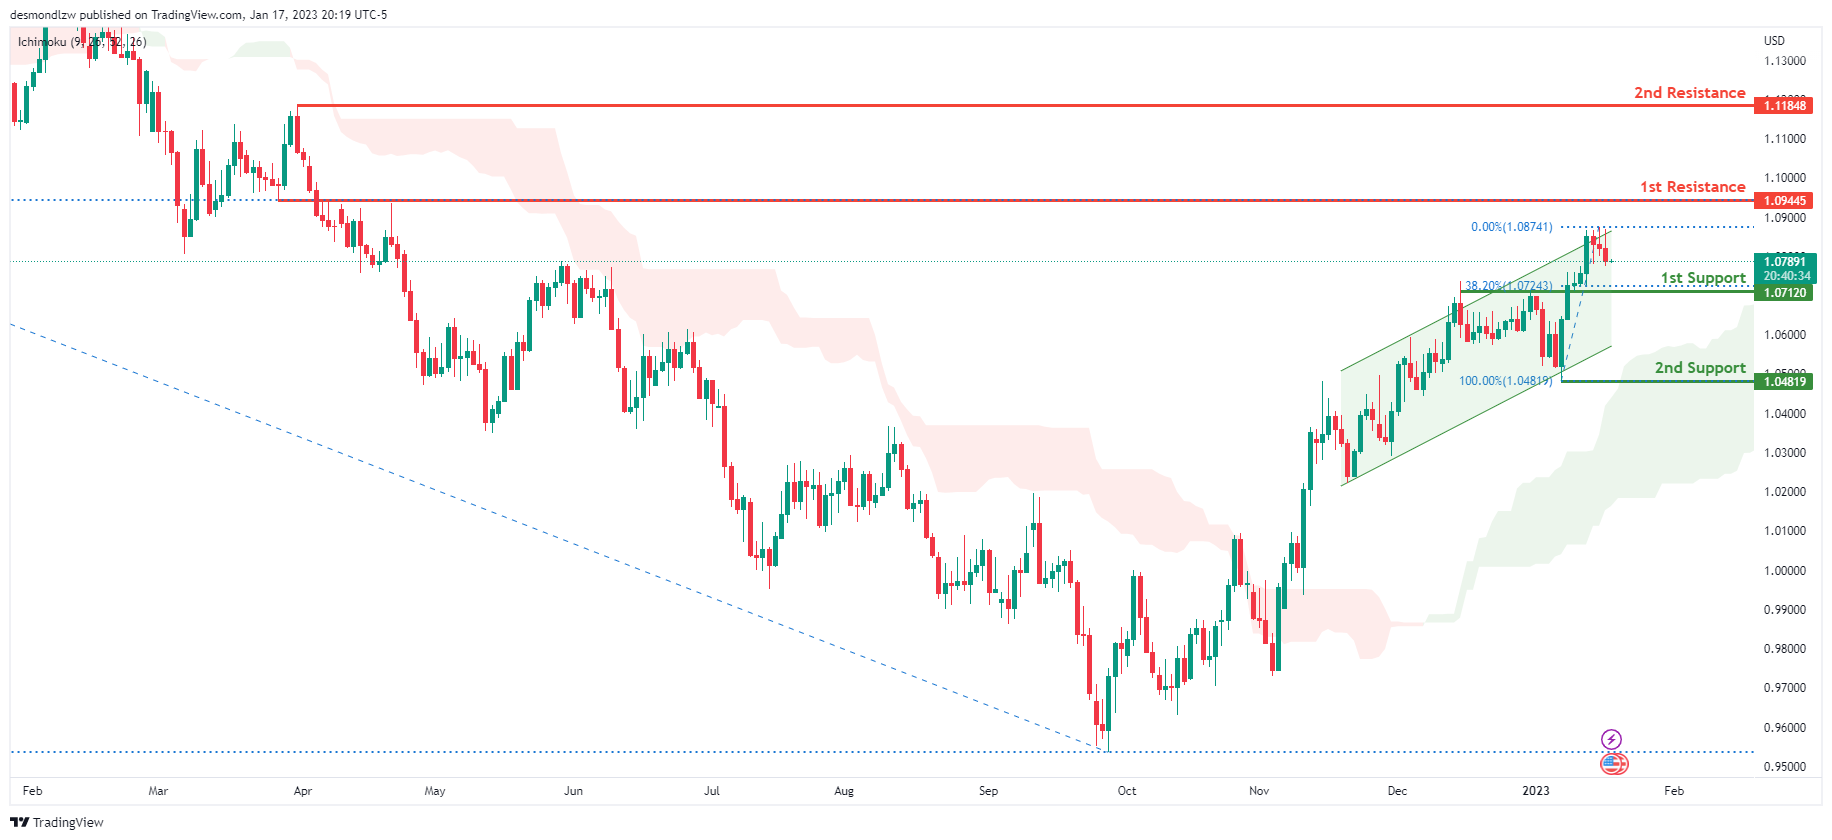
EUR/USD:
Looking at the Daily chart, my overall bias for EURUSD is bullish due to the current price being above the Ichimoku cloud, indicating a bullish market structure. To add confluence to this bias, price is also within an ascending channel. If this bullish momentum continues, expect the price to possibly continue heading towards the 1st resistance at 1.09445, where the 50% Fibonacci line is. In an alternate scenario, price could possibly head back down to retest the 1st support level at 1.07120, where the 38.2% Fibonacci line is.
Areas of consideration :
- H4 1st resistance at 1.09445
- H4 1st support at 1.07120
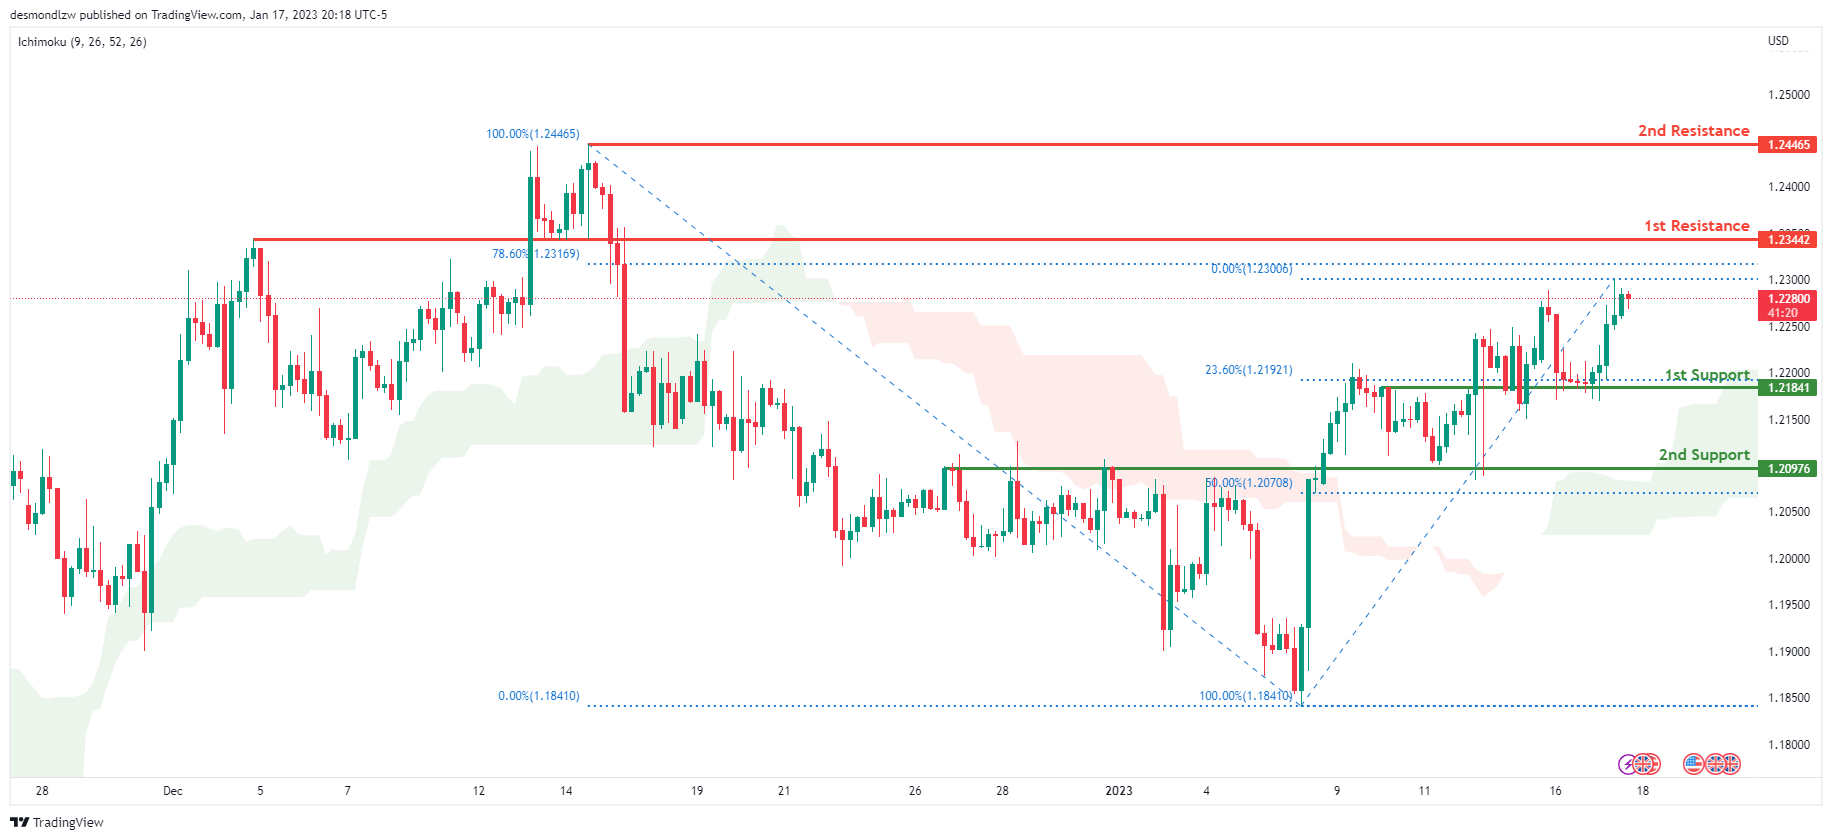
GBP/USD:
Looking at the H4 chart, my overall bias for GBPUSD is bullish due to the current price being above the Ichimoku cloud, indicating a bullish market. If this bullish momentum continues, expect price to possibly continue heading towards the 1st resistance line at 1.23442, where the 78.6% Fibonacci line is. In an alternate scenario, price could possibly head back down and break the 1st support at 1.21841, where the 23.6% Fibonacci line is, before heading towards the 2nd support at 1.20976, where the 50% Fibonacci line is.
Areas of consideration:
- H4 1st resistance at 1.23442
- H4 1st support at 1.21841
- H4 2nd support at 1.20976
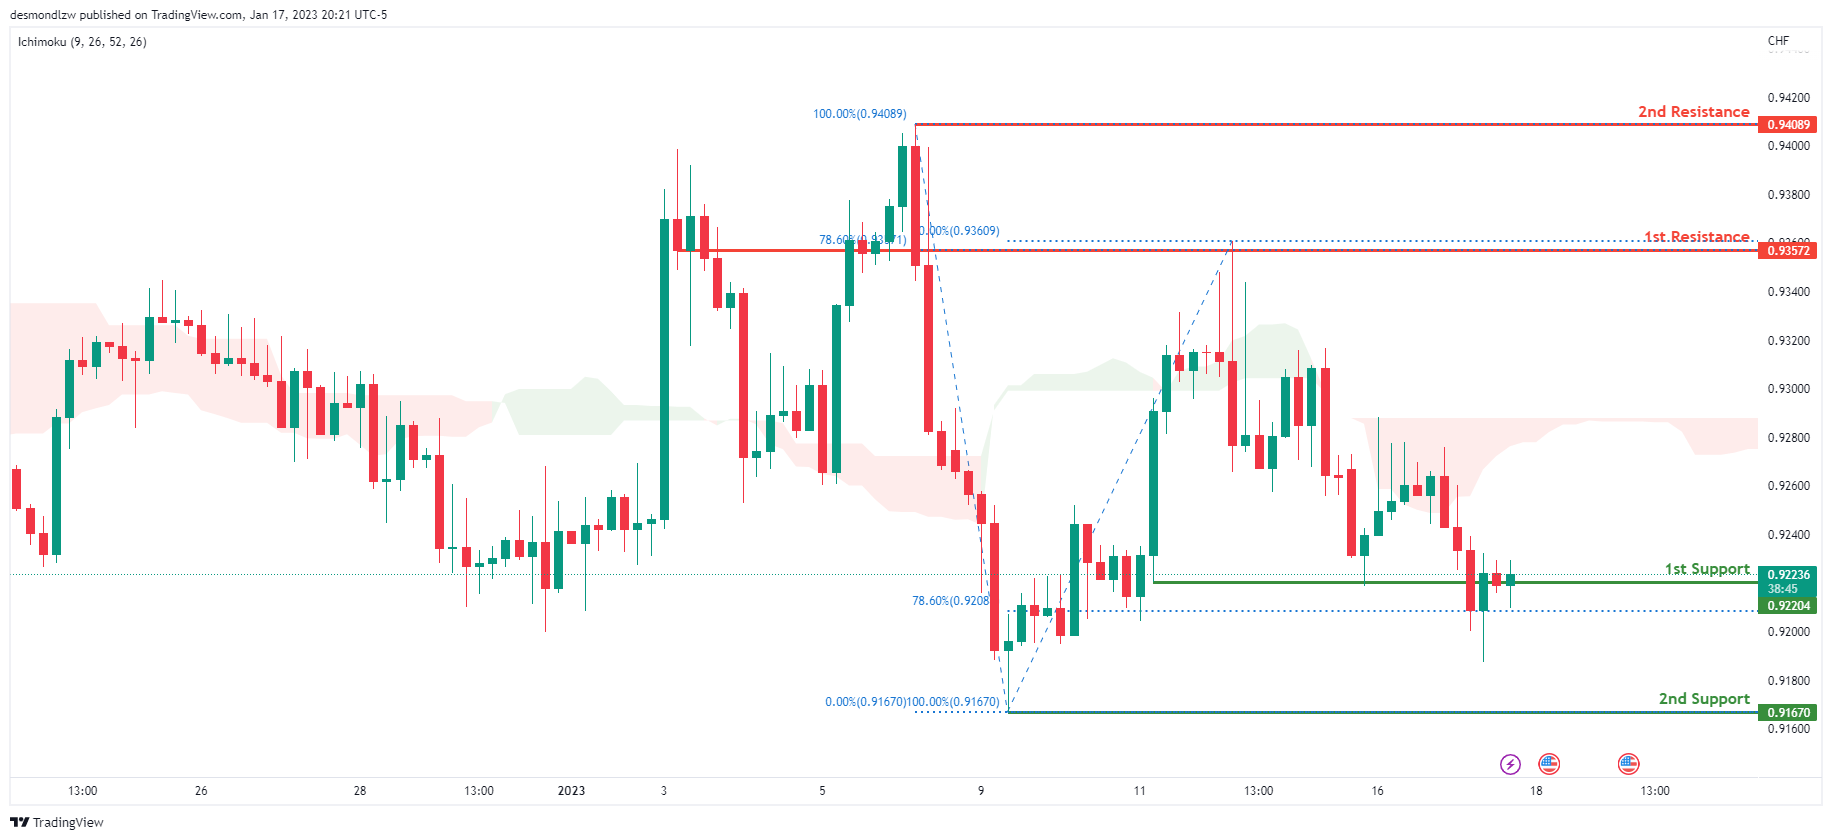
USD/CHF:
Looking at the H4 chart, my overall bias for USDCHF is bearish due to the current price crossing below the Ichimoku cloud, indicating a bearish market. If the current bearish trend continues, expect the price to possibly head back down to retest the 1st support at 0.92204, slightly above where the 78.6% Fibonacci line is. In an alternative scenario, price could possibly head towards the 1st resistance at 0.93572, where the 78.6% Fibonacci line is.
Areas of consideration
- H4 1st support at 0.92204
- H4 1st resistance at 0.93572
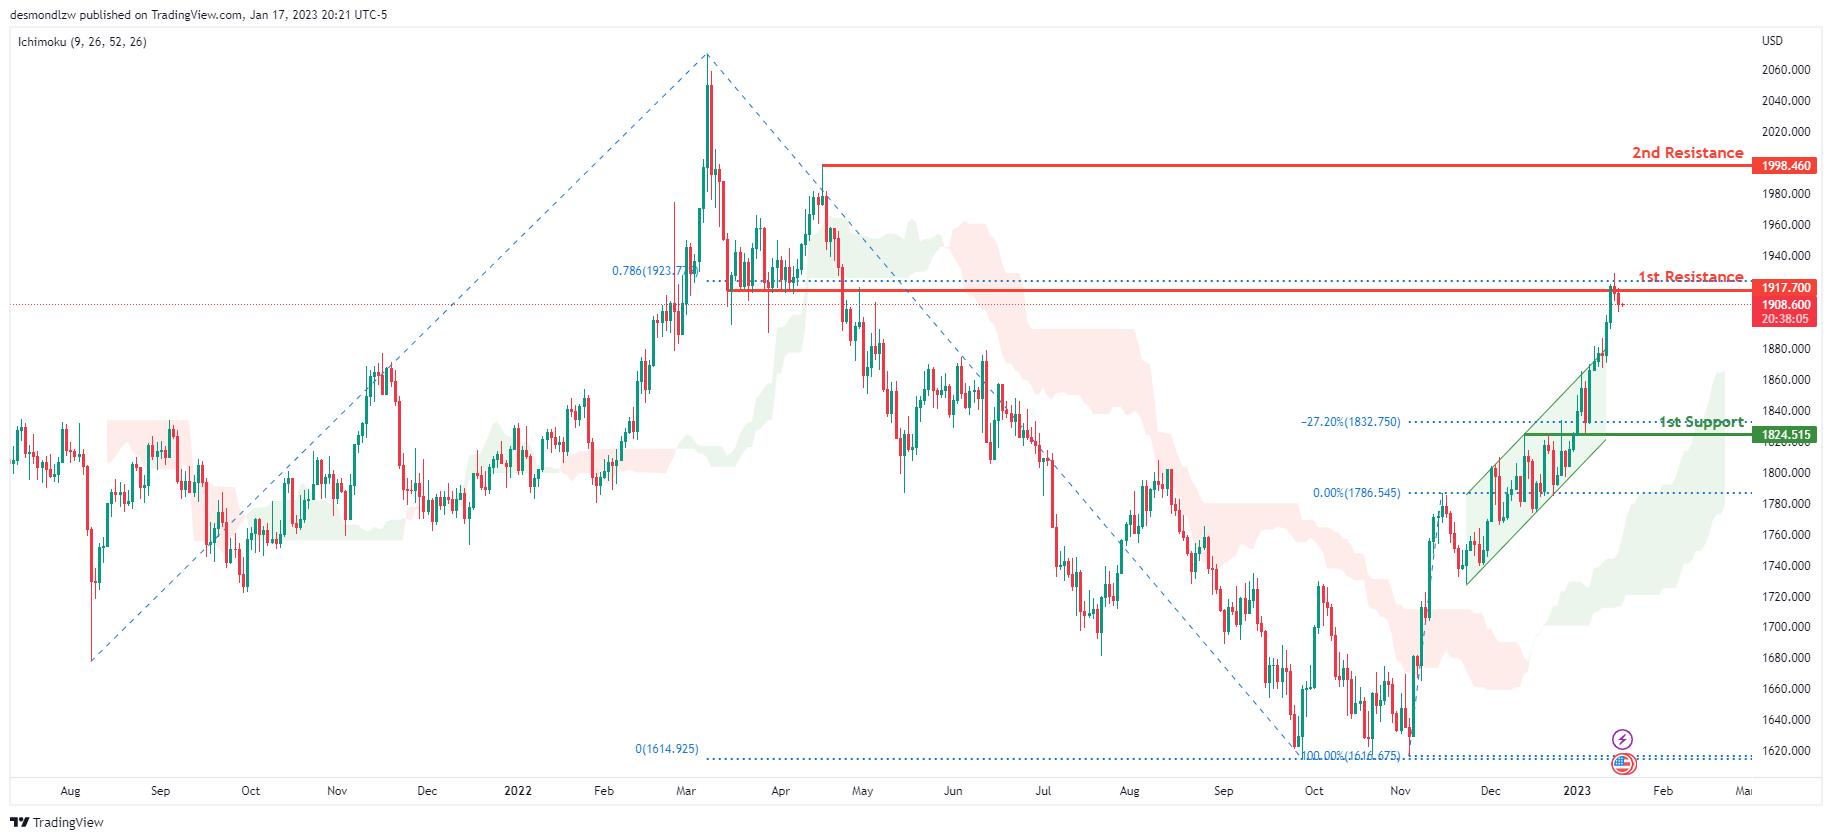
XAU/USD (GOLD):
Looking at the Daily chart, my overall bias for XAUUSD is bullish due to the current price crossing above the Ichimoku cloud, indicating a bullish market. To add support to this bias, price has also broken above the bullish ascending channel. If this bullish momentum continues, expect the price to possibly break the 1st resistance at 1917.700 where the 78.6% Fibonacci projection line is, before heading towards the 2nd resistance at 1998.460, where the previous swing high is. In an alternative scenario, price could possibly head back down to retest the 1st support at 1824.515 where the -27.2% Fibonacci expansion line is.
Areas of consideration:
- H4 time frame, 1st resistance at 1917.700
- H4 time frame, 2nd resistance at 1998.460
- H4 time frame, 1st support at 1824.515
- H4 time frame, 2nd support at 1824.515
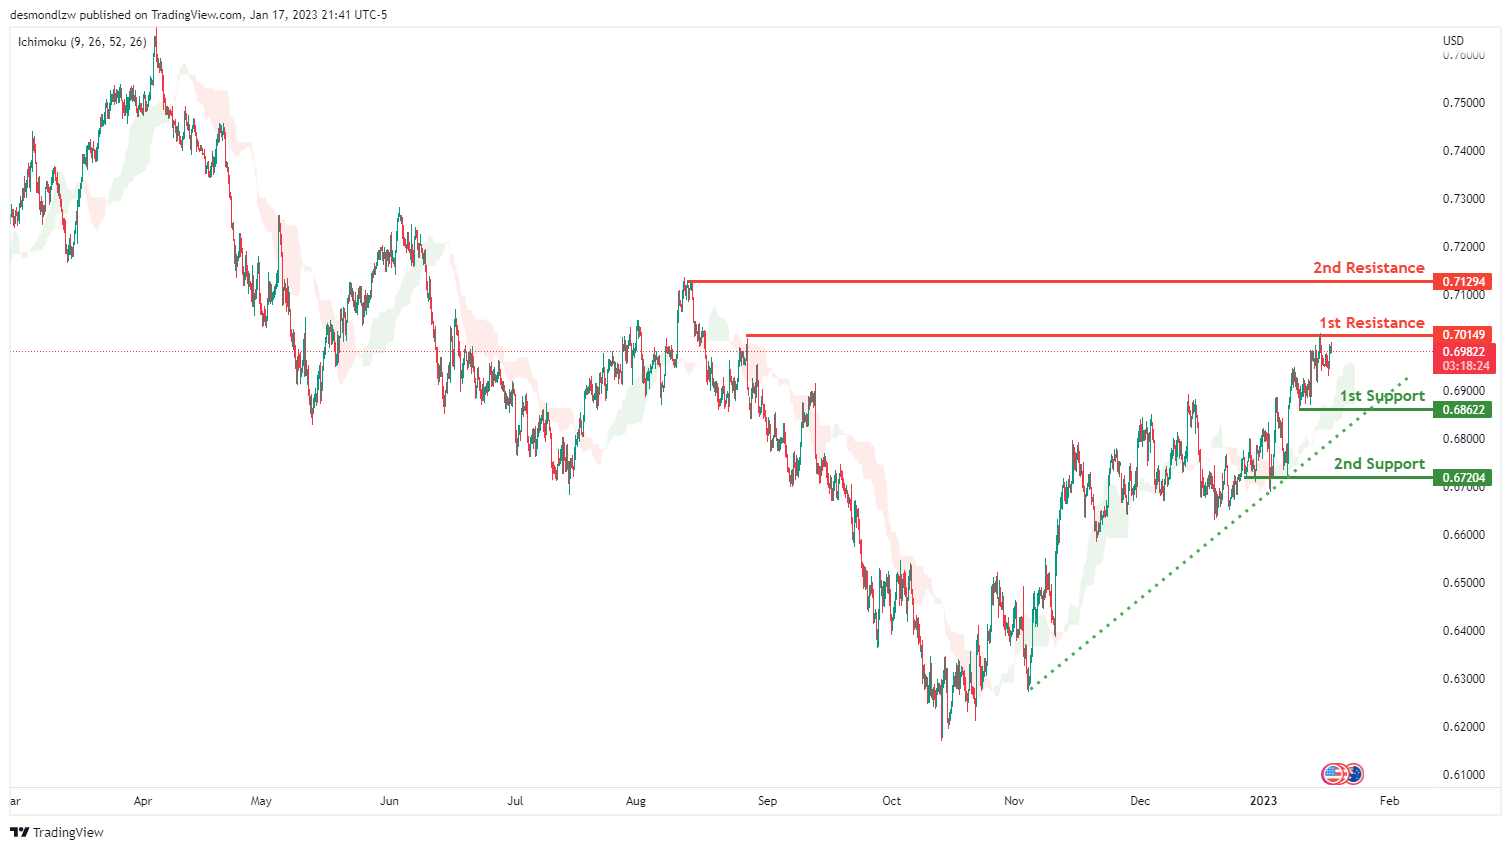
AUD/USD:
Looking at the H4 chart, we can see that the 1st support is at 0.71294 which is an overlap resistance .There is an ascending trend line that starts from 3rd JAN 2023 which suggests that there is bullish momentum. Price is also above our Ichimoku cloud suggesting further bullish momentum. 1st resistance is at 0.70149 which is an overlap resistance. 2nd resistance is slightly higher at 0.71294
Areas of consideration
- H4, 1st resistance at 0.70149
- H4, 2nd resistance at 0.71294
- H4, 1st support at 0.71294
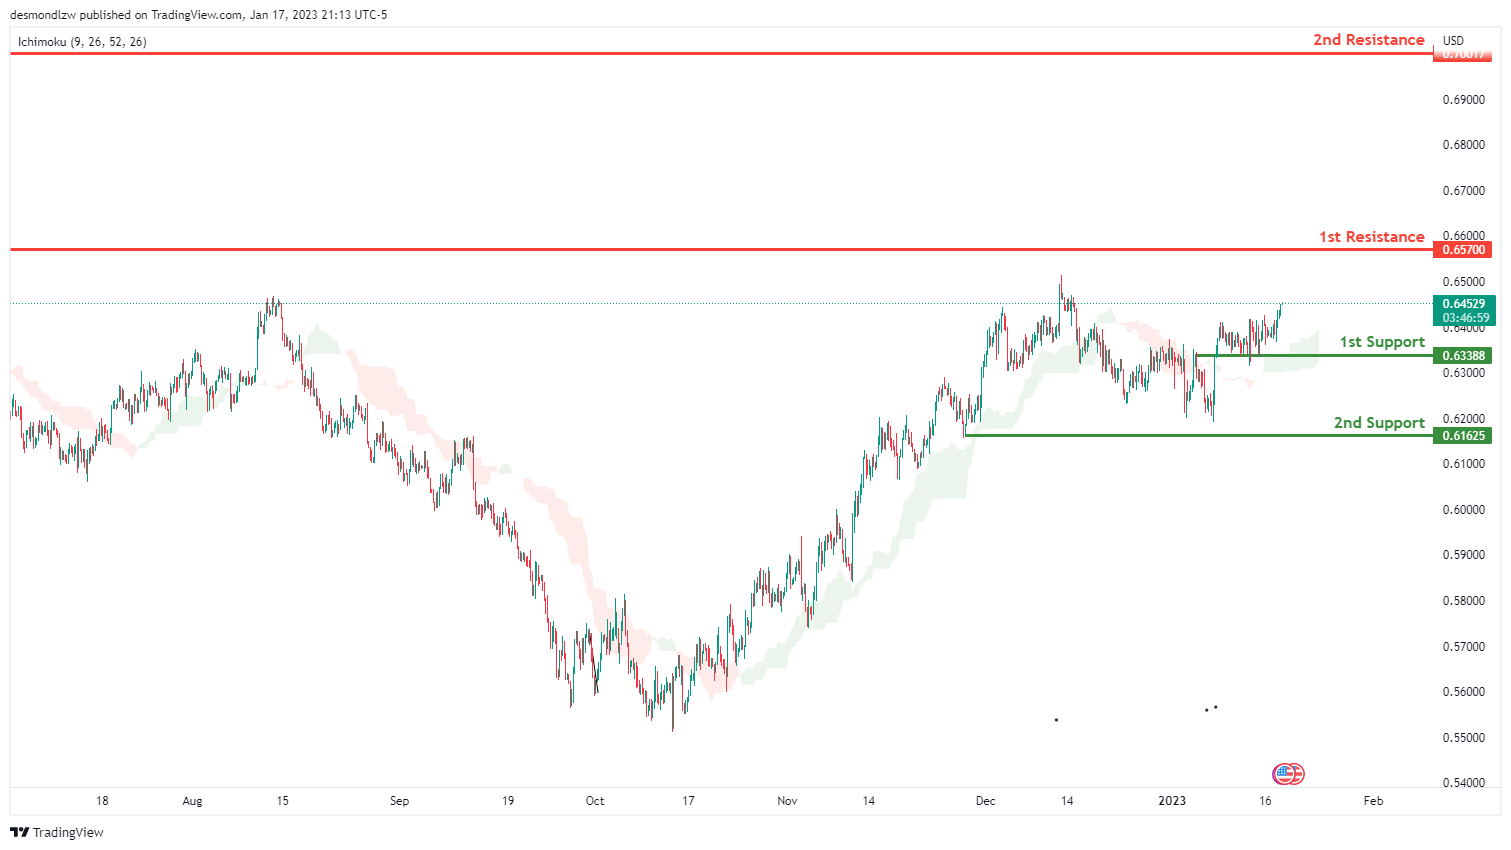
NZD/USD:
Looking at the H4 chart, we can see that the 1st support is at 0.63388 which is an overlap support. If price breaks this level, we could see it drop to 2nd support down at 0.61625.
For the resistance, our 1st resistance is at 0.65700 which is an recent swing high resistance . If price breaks this level, it could go up to the 2nd resistance at 0.70017 which is the highest price since jun 2022.
Areas of consideration:
- H4 time frame, 1st resistance at 0.65700
- H4 time frame, 2nd resistance at 0.70017
- H4 time frame, 1st support at 0.63388
- H4 time frame, 2nd support at 0.61625
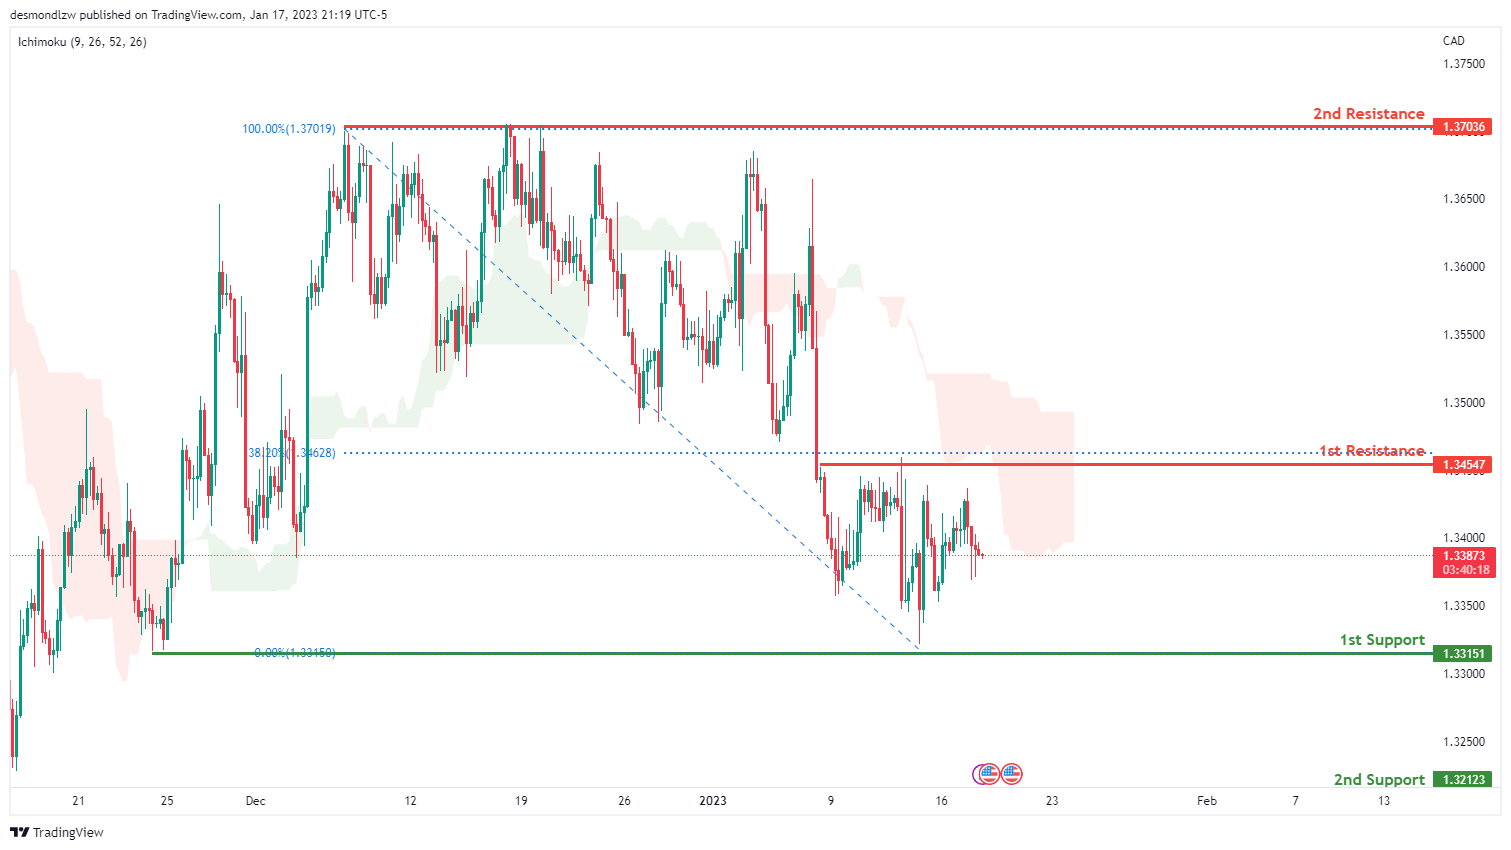
USD/CAD:
On the H4 chart, the 1st support is at 1.33151 which is the recent swing low support . And the 2nd support 1.32123 which is an overlap support. .
In terms of resistance, the 1st resistance we can see is at 1.34547 which is an overlap resistance that happens to coincide with the 38.2% fibonacci retracement. If price breaks this level, it could go up to the 2nd resistance at 1.37036 which is a recent swing high resistance
Areas of consideration:
- H4 time frame, 1st resistance at 1.34547
- H4 time frame. 2nd resistance at 1.37036
- H4 time frame, 1st support at 1.33151
- H4 time frame, 2nd support at 1.32123
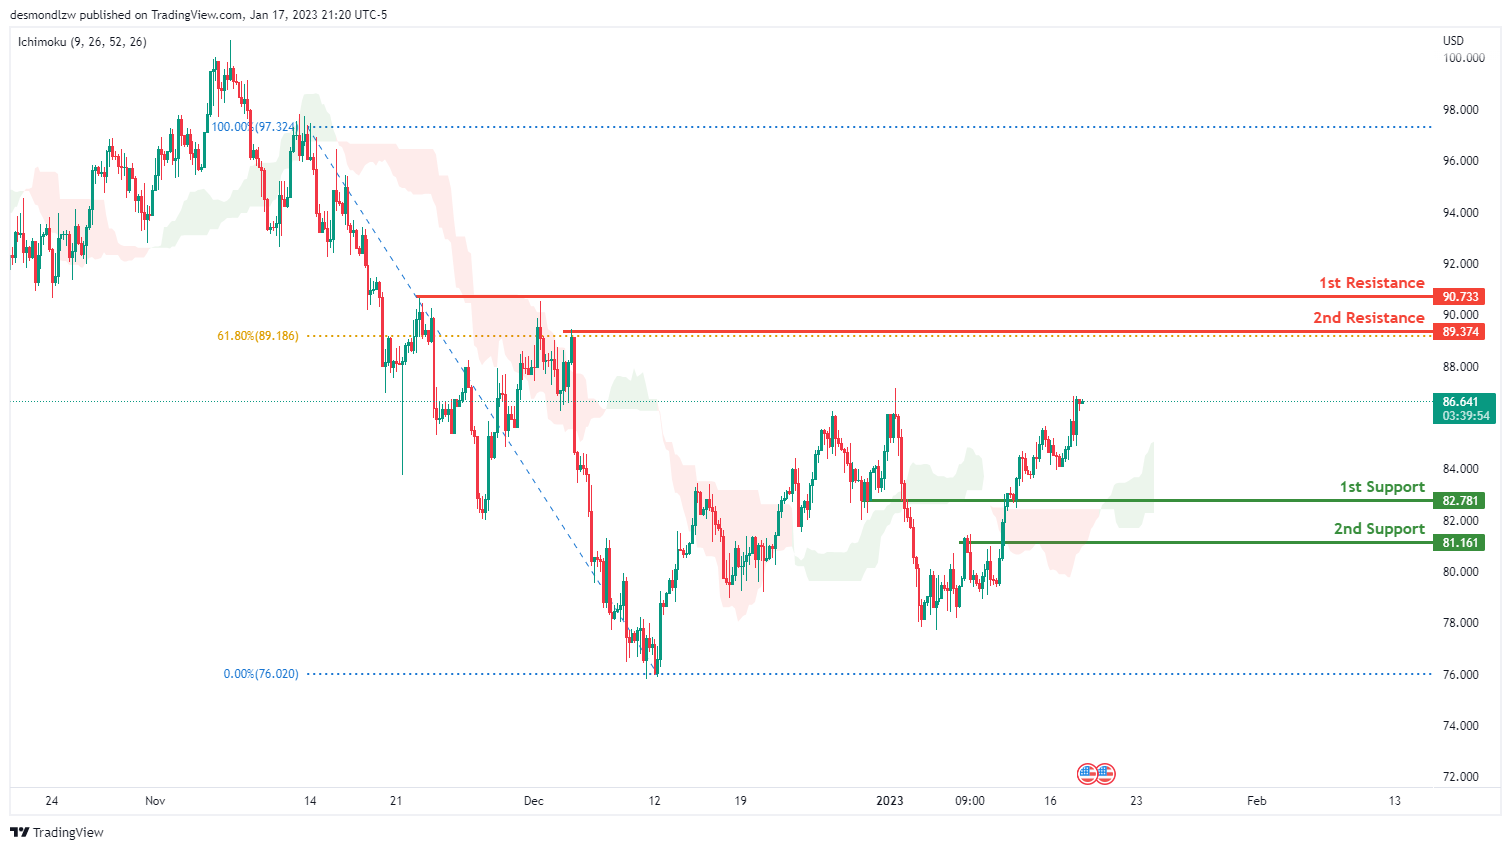
OIL:
Looking at the H4 chart, we can see that the 1st resistance is at 86.289 If the price breaks this level, we could see the price head up to our 2nd resistance level at 88.676 which is in line with the 50% fibonacci retracement.
In terms of support, we can see our 1st support at 82.409 which is overlap support. Breaking this level would trigger a further drop to our 2nd support at 79.435
Areas of consideration:
- H4 time frame, 2nd resistance at 88.676
- H4 time frame, 1st resistance at 86.289
- H4 time frame,1st support at 82.409
- Hr time frame, 2nd support at 79.435
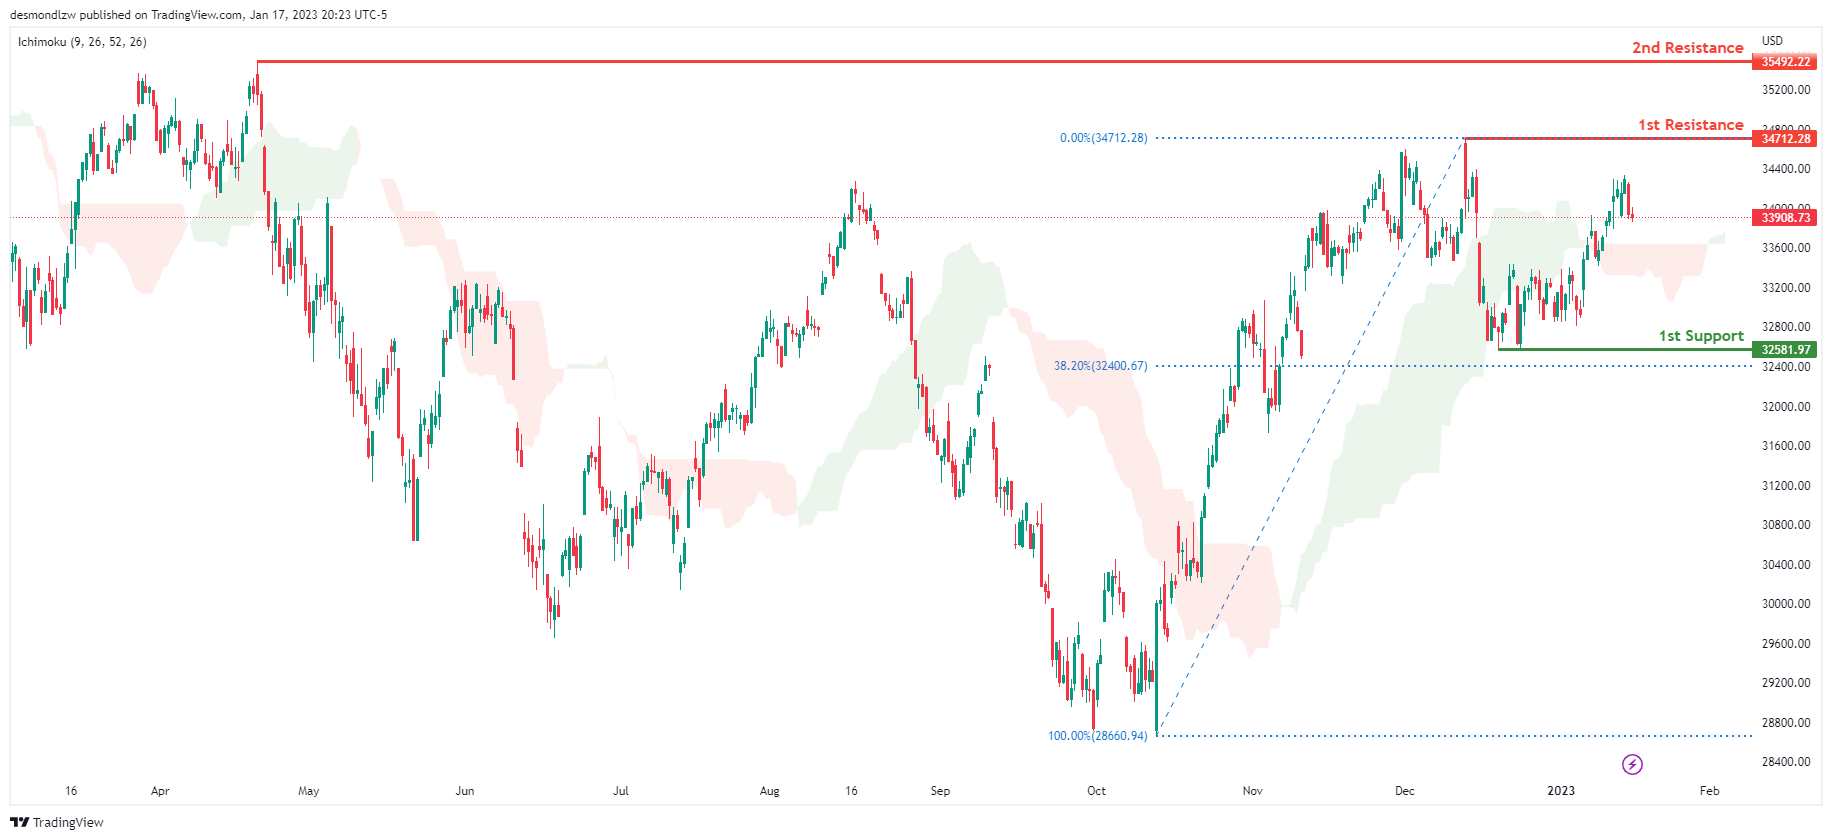
Dow Jones Industrial Average:
On the H4 chart, the overall bias for DJI is bullish. To add confluence to this, the price is crossing above the Ichimoku cloud which indicates a bullish market. If this bullish momentum continues, expect the price to possibly continue heading towards the 1st resistance line at 34712.28, where the recent swing high is. In an alternative scenario, price could possibly head back down towards the 1st support at 32581.97, slightly above where the 38.2% Fibonacci line is.
Areas of consideration:
- H4 time frame, 1st support at 32581.97
- H4 time frame, 1st Resistance at 34712.28
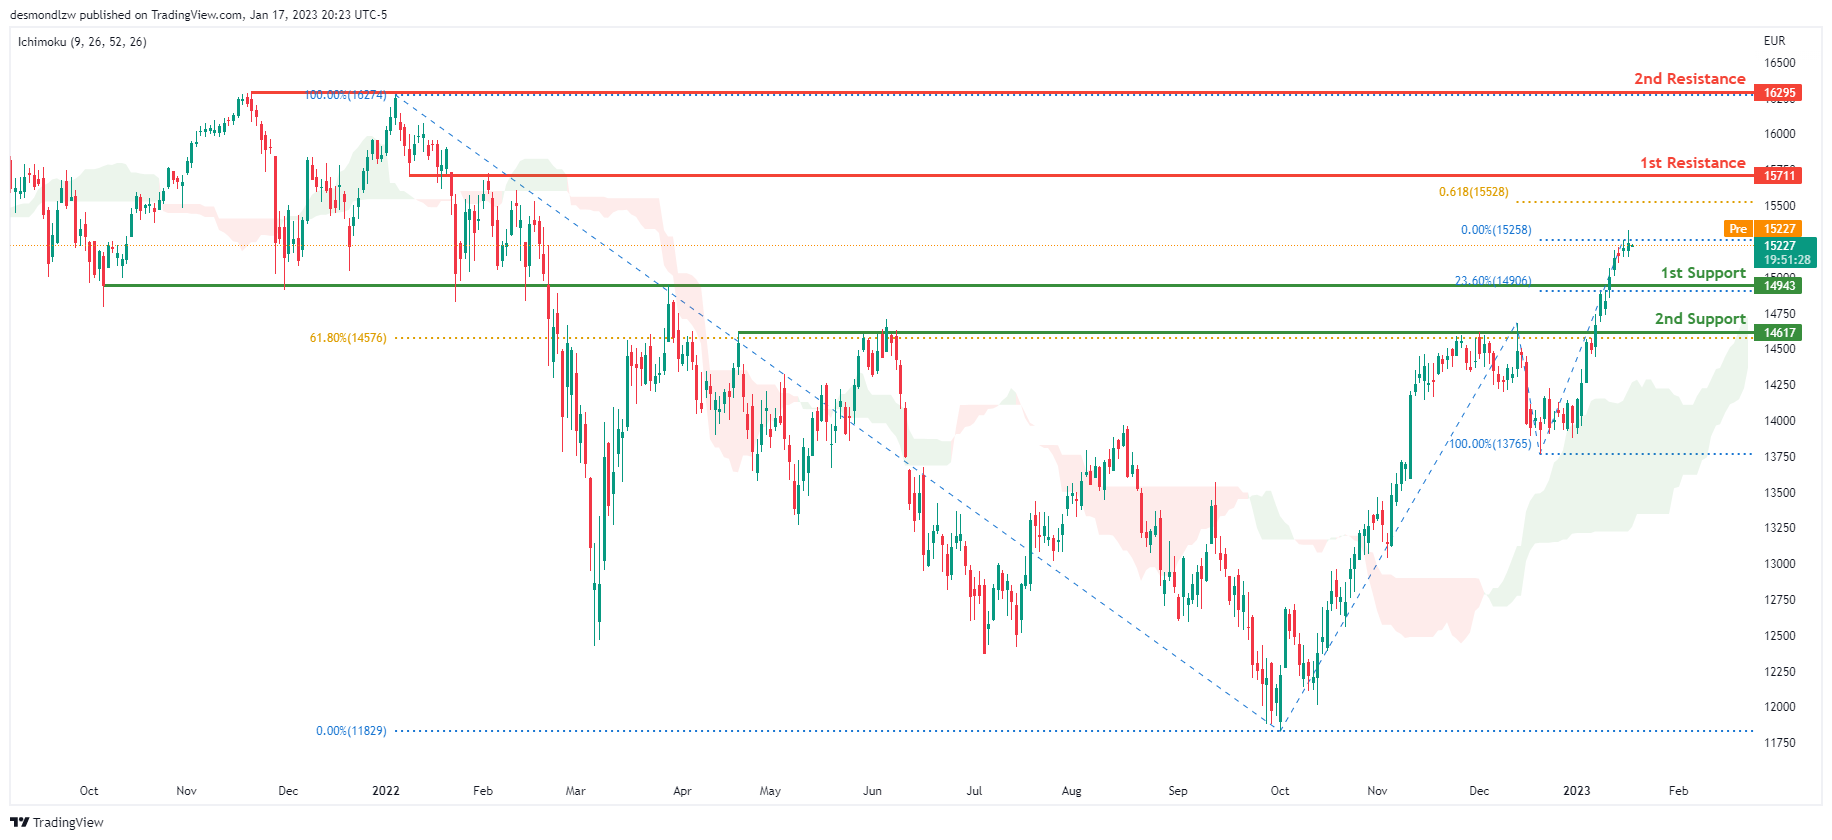
DAX:
Looking at the Daily chart, my overall bias for DAX is bullish due to the current price crossing above the Ichimoku cloud, indicating a bullish market. If this bullish momentum continues, expect the price to possibly head towards the 1st resistance line at 15711, where the 61.8% Fibonacci projection line is. In an alternative scenario, price could possibly head down to retest the 1st support at 14943, where the 23.6% Fibonacci line is.
Areas of consideration:
- H4 time frame, 1st resistance is at 15711
- H4 time frame, 1st support is at 14943
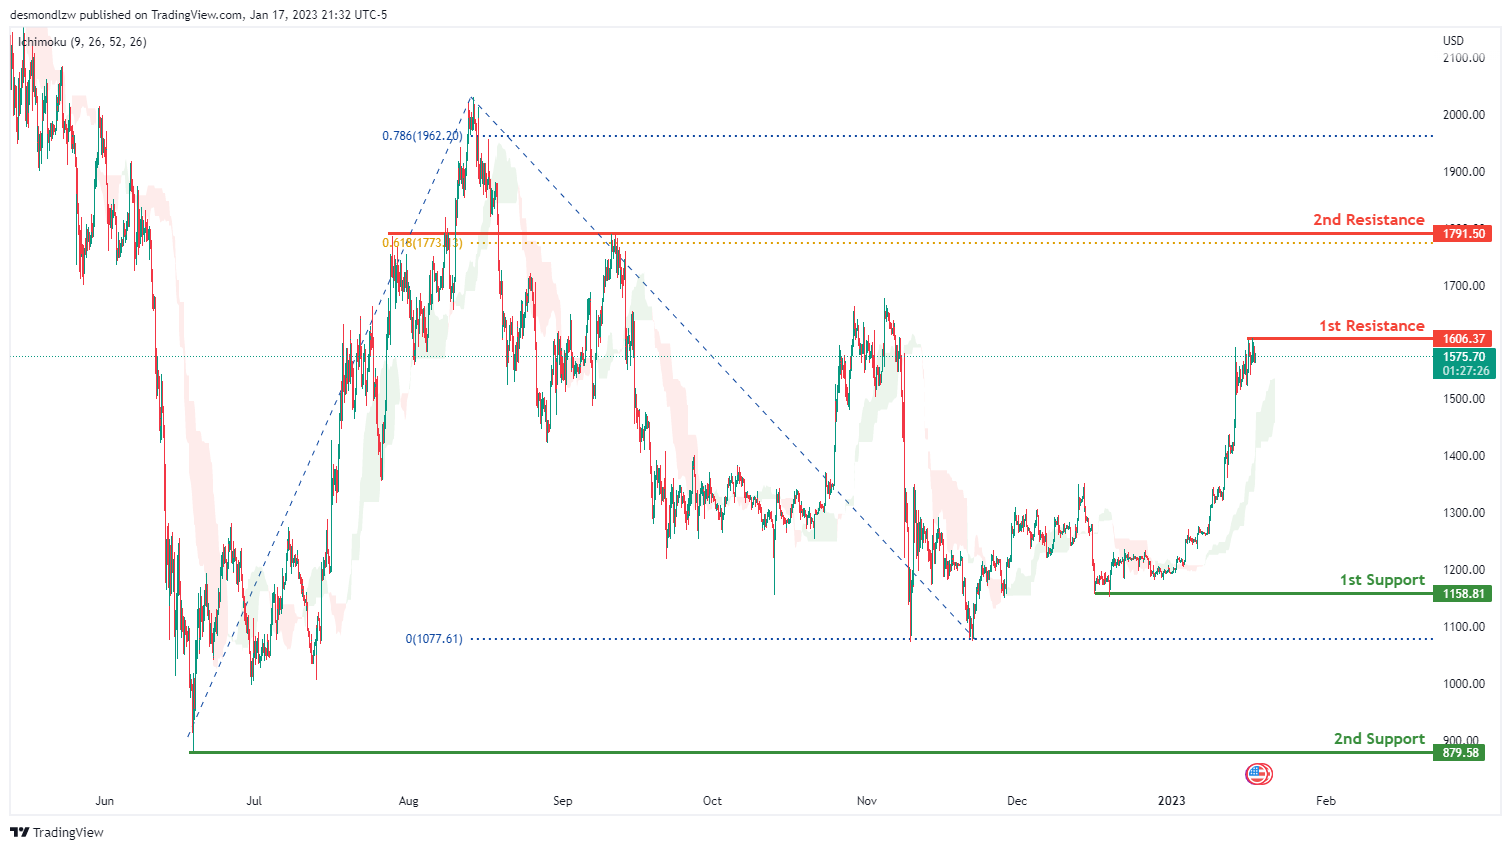
ETHUSD:
Looking at the H4 chart, my overall bias for ETHUSD is bullish due to the current price crossing above the Ichimoku cloud, indicating a bullish market. If this bullish momentum continues, expect the price to break the 1st resistance at 1606.37 and head u to the 2nd resistance at 1791.50 where the 61.8% Fibonacci projection and the previous swing high is. In an alternative scenario, the price could head back down to retest the 1st support at 1158.81. If the price break through the 1st support line, the price may further down to the 2nd support line 879.58 .
Areas of consideration:
- H4 time frame, 1st resistance of 1791.50
- H4 time frame, 1st resistance of 1606.37
- H4 time frame, 1st support at 1511.21
- H4 time frame, 2nd support at 879.58
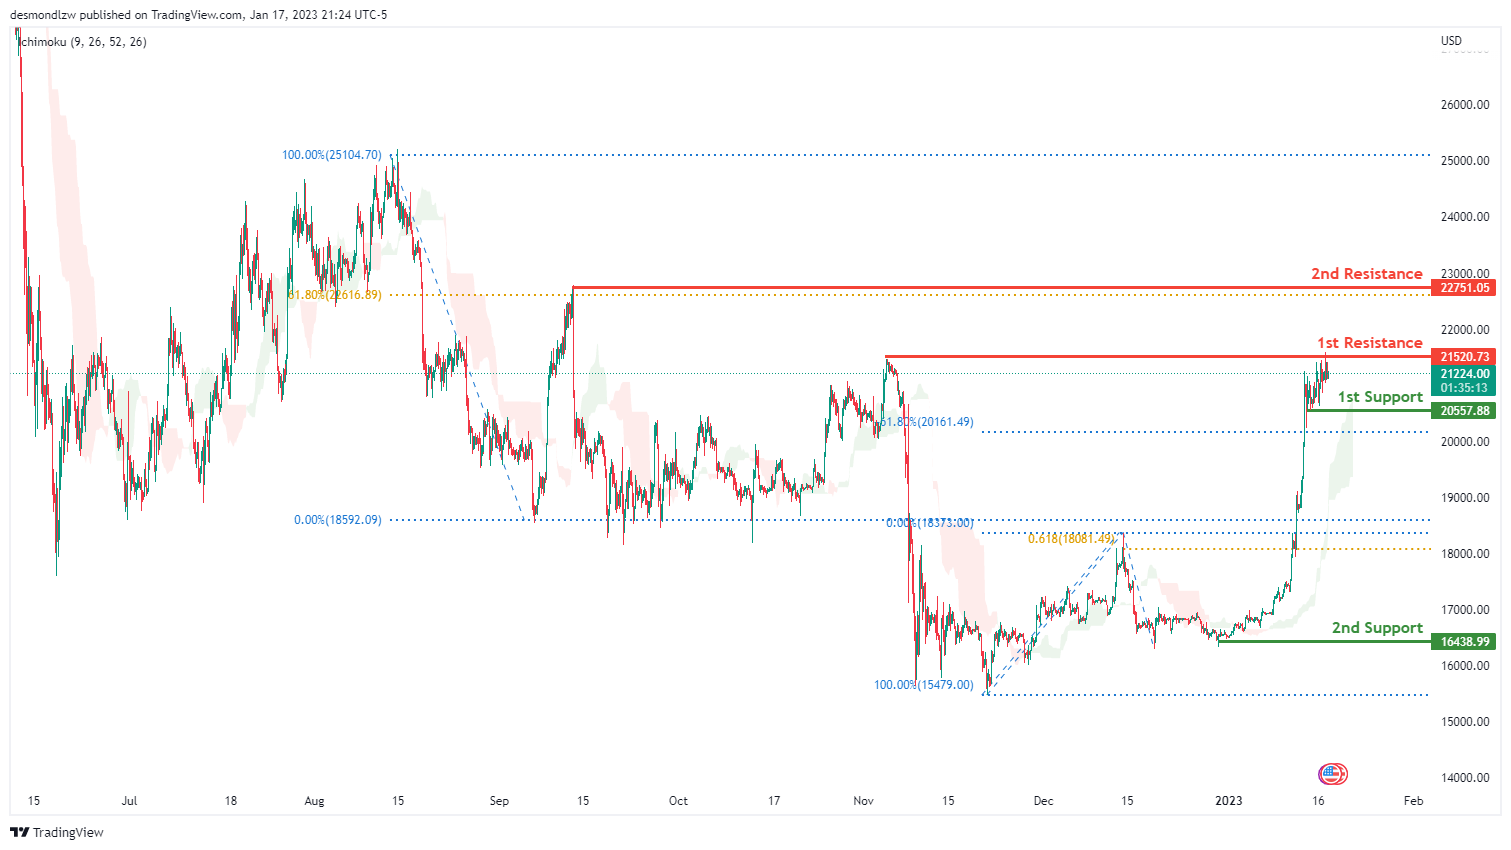
BTCUSD:
Looking at the H4 chart, my overall bias for BTCUSD is bullish due to the current price being above the Ichimoku cloud, indicating a bullish market. If this bullish momentum continues, expect the price to possibly break the 1st resistance at 21520.73, which is the key level that the price attempts to break, before heading towards the 2nd resistance at 22751.05, where the 61.8% Fibonacci line is. In an alternative scenario, the price could possibly head back down to retest the 1st support at 20557.88.
Areas of consideration:
- H4 time frame, 1st resistance 21520.73
- H4 time frame, 2nd resistance 22751.05
- H4 time frame, 1st support at 20557.88.
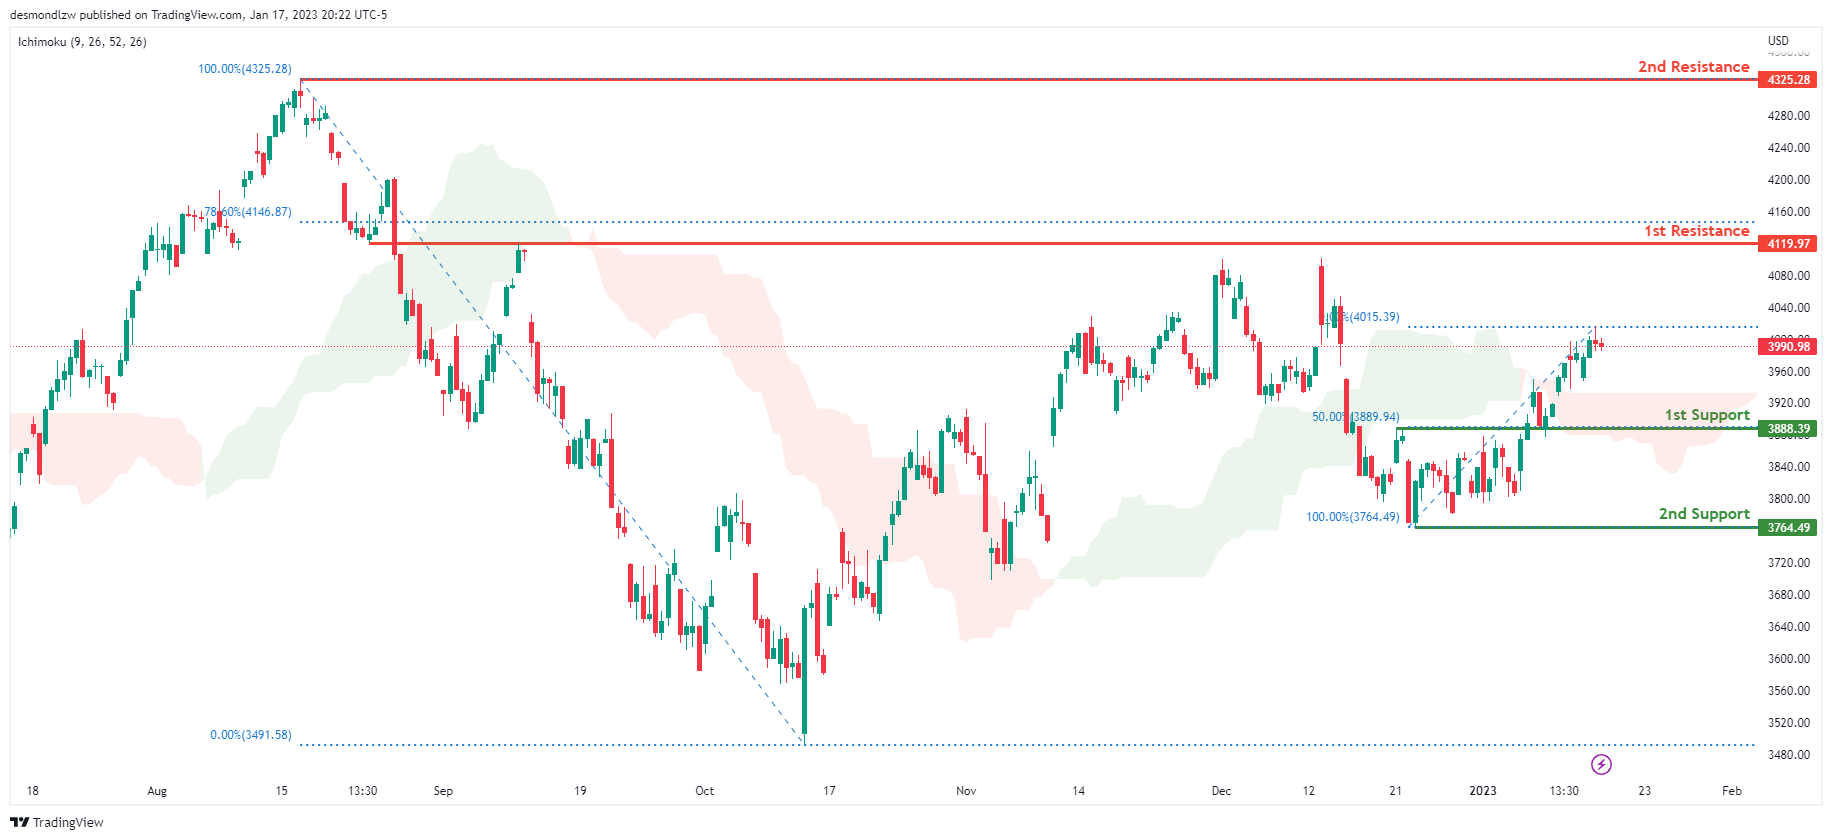
S&P 500:
Looking at the H4 chart, my overall bias for S&P500 is bullish due to the current price being above the Ichimoku cloud, indicating a bullish market. If this bullish momentum continues, expect the price to continue heading towards the 1st resistance at 4119.97, where the 78.6% Fibonacci line is. In an alternative scenario, price could possibly head back down to retest the 1st support at 3888.39, where the 50% Fibonacci line is.
Areas of consideration:
- H4 time frame, 1st support at 3888.39
- H4 time frame, 1st resistance at 4119.97


