
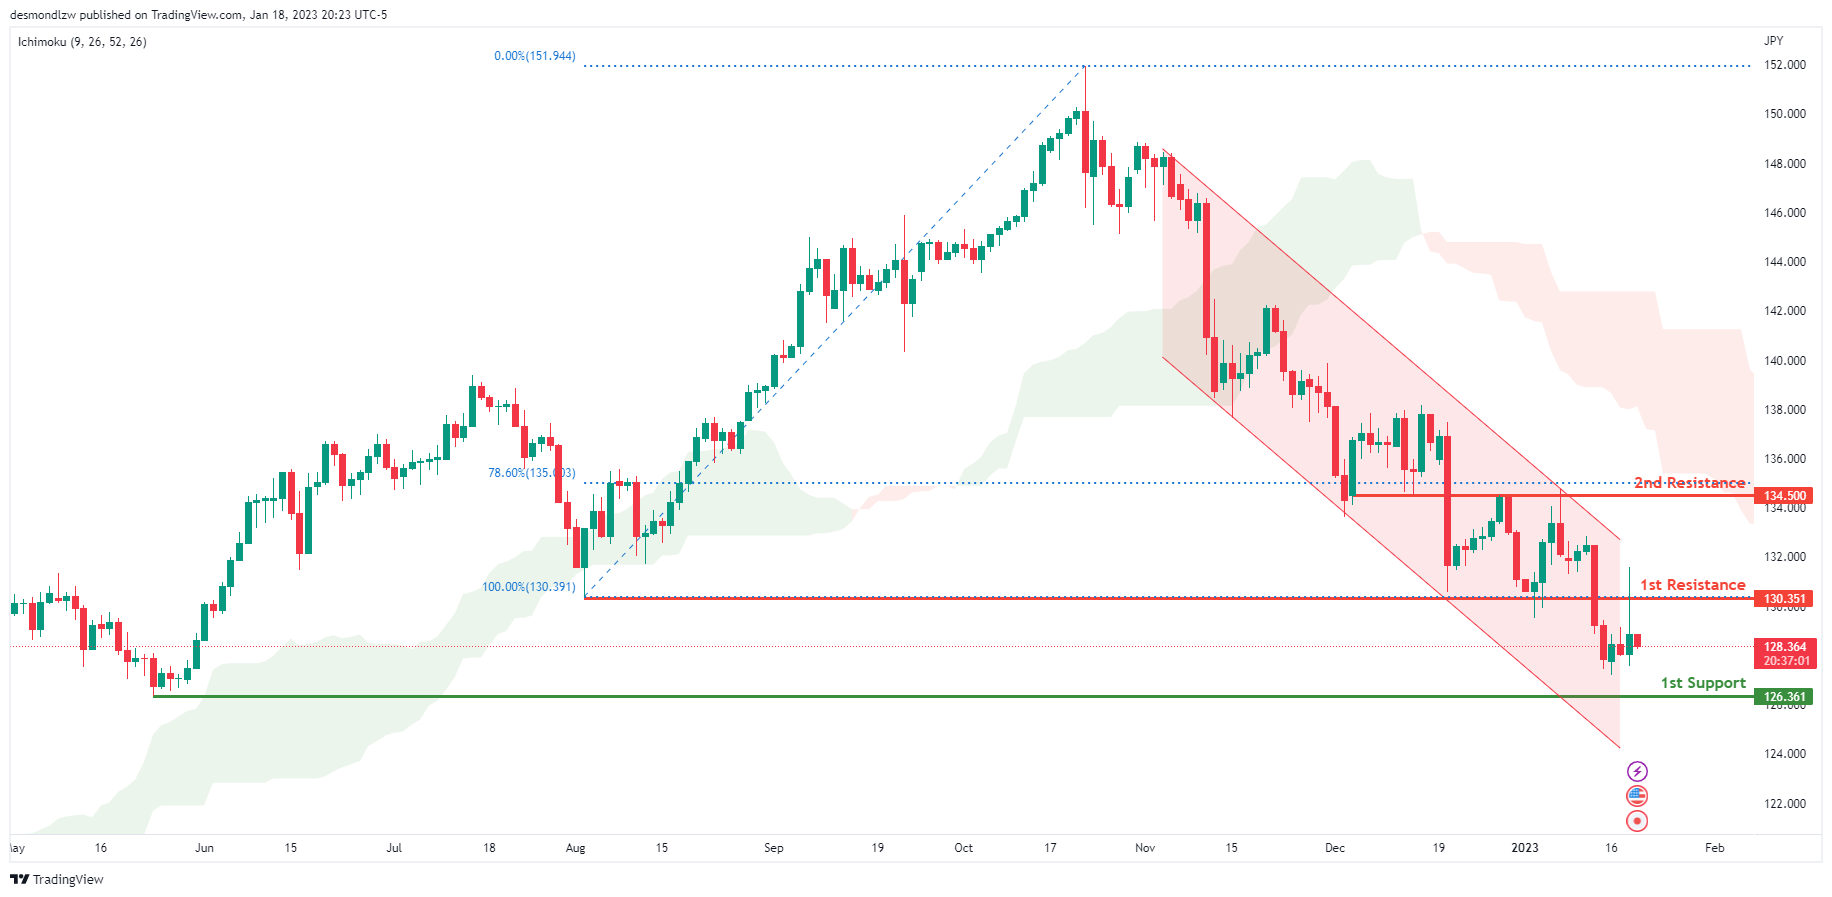
USD/JPY:
Looking at the Daily chart, my overall bias for USDJPY is bearish due to the current price being below the Ichimoku cloud, indicating a bearish market. To add confluence to this bias, price is also within a descending channel. If this bearish momentum continues, expect the price to possibly continue heading towards the 1st support level at 126.361, where the previous swing low is. In an alternate scenario, price could possibly head back up to retest the 1st resistance at 130.351, where the previous swing low is.
Areas of consideration:
- H4 time frame, 1st resistance at 130.351
- H4 time frame, 1st support at 126.361
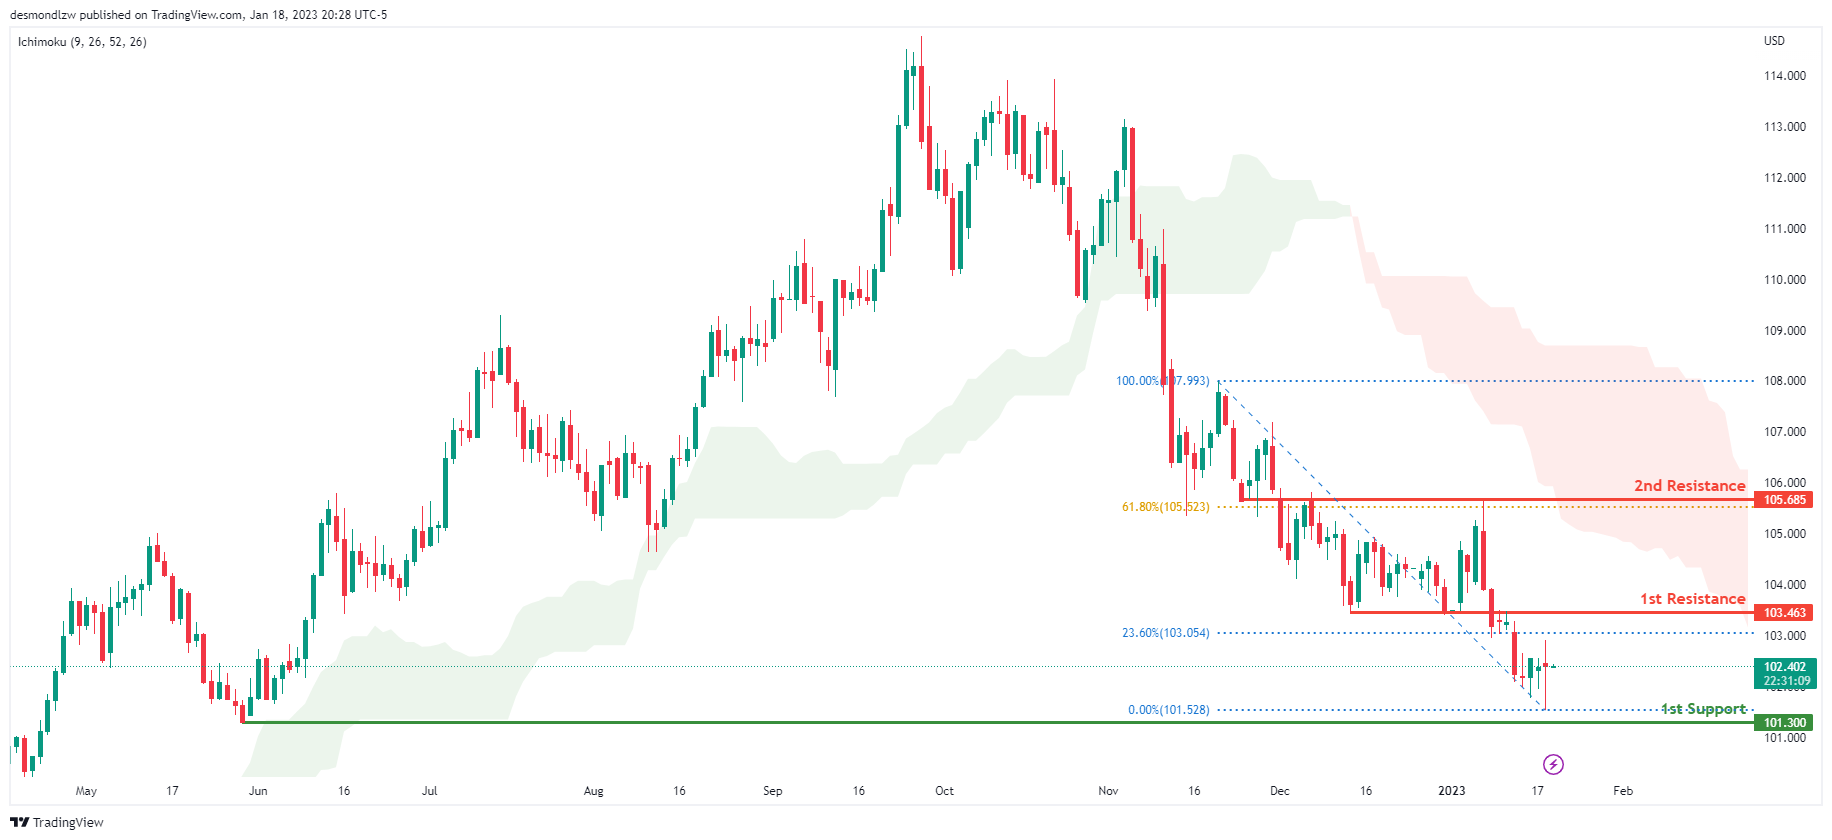
DXY:
Looking at the Daily chart, my overall bias for DXY is bearish due to the current price being below the Ichimoku cloud, indicating a bearish market. If this bearish momentum continues, expect the price to possibly continue heading towards the 1st support at 101.300, where the previous low is. . In an alternative scenario, price could head back up to retest the 1st resistance at 103.463, where the 23.6% Fibonacci line is.
Areas of consideration:
- H4 time frame, 1st resistance at 103.463
- H4 time frame, 1st support at 101.300
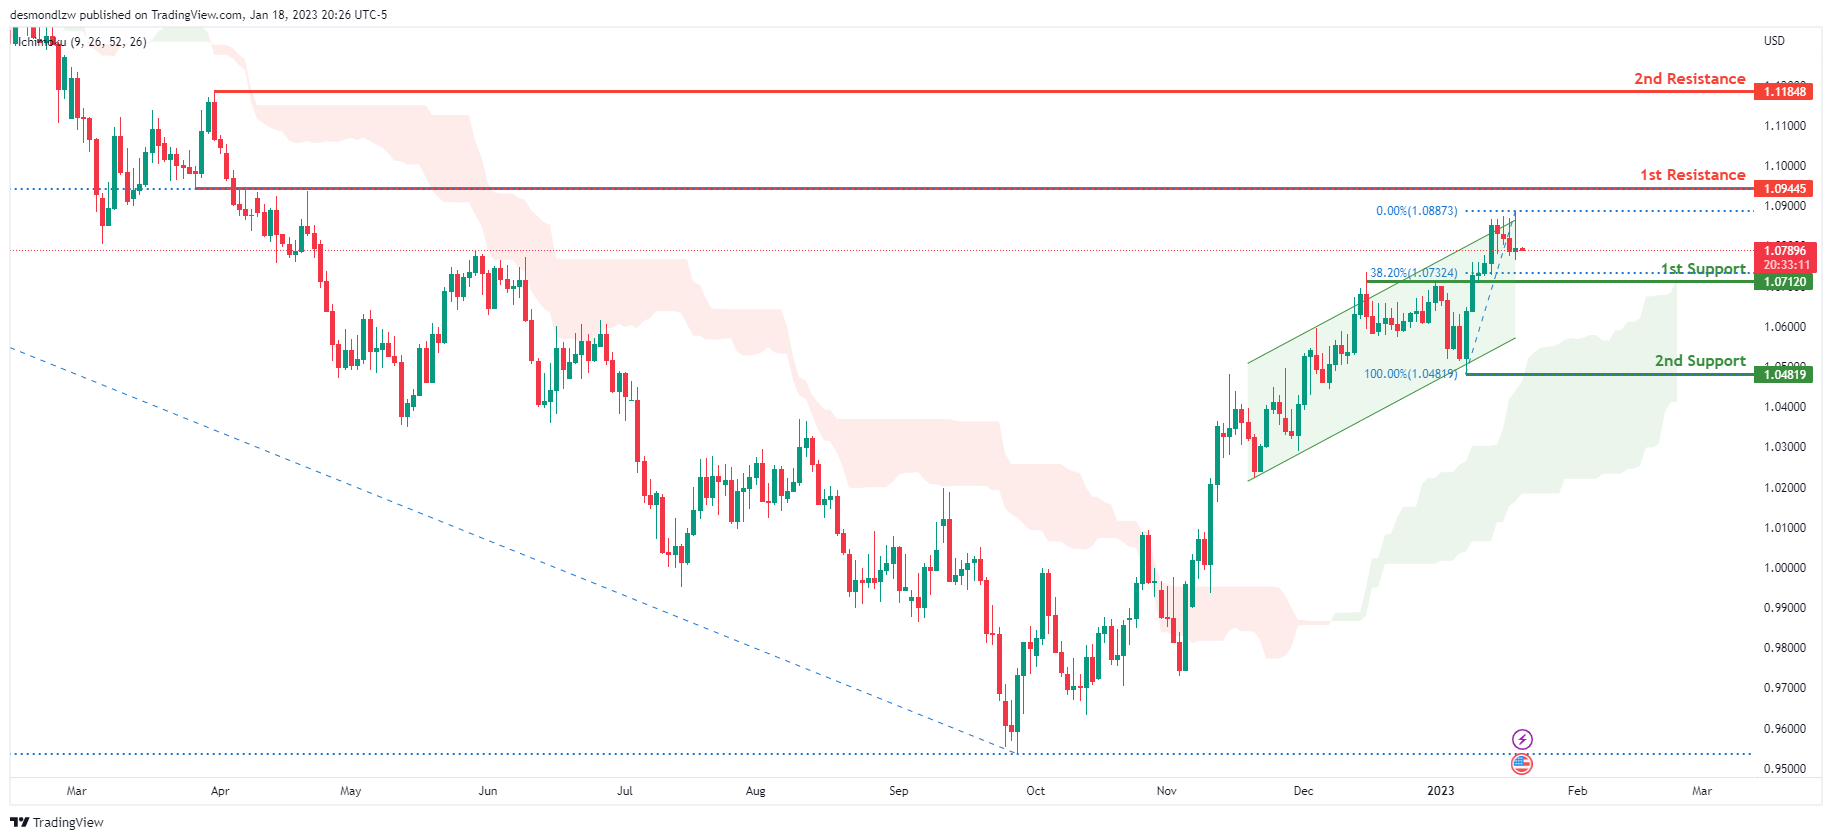
EUR/USD:
Looking at the Daily chart, my overall bias for EURUSD is bullish due to the current price being above the Ichimoku cloud, indicating a bullish market structure. To add confluence to this bias, price is also within an ascending channel. If this bullish momentum continues, expect the price to possibly continue heading towards the 1st resistance at 1.09445, where the 50% Fibonacci line is. In an alternate scenario, price could possibly head back down to retest the 1st support level at 1.07120, where the 38.2% Fibonacci line is.
Areas of consideration :
- H4 1st resistance at 1.09445
- H4 1st support at 1.07120
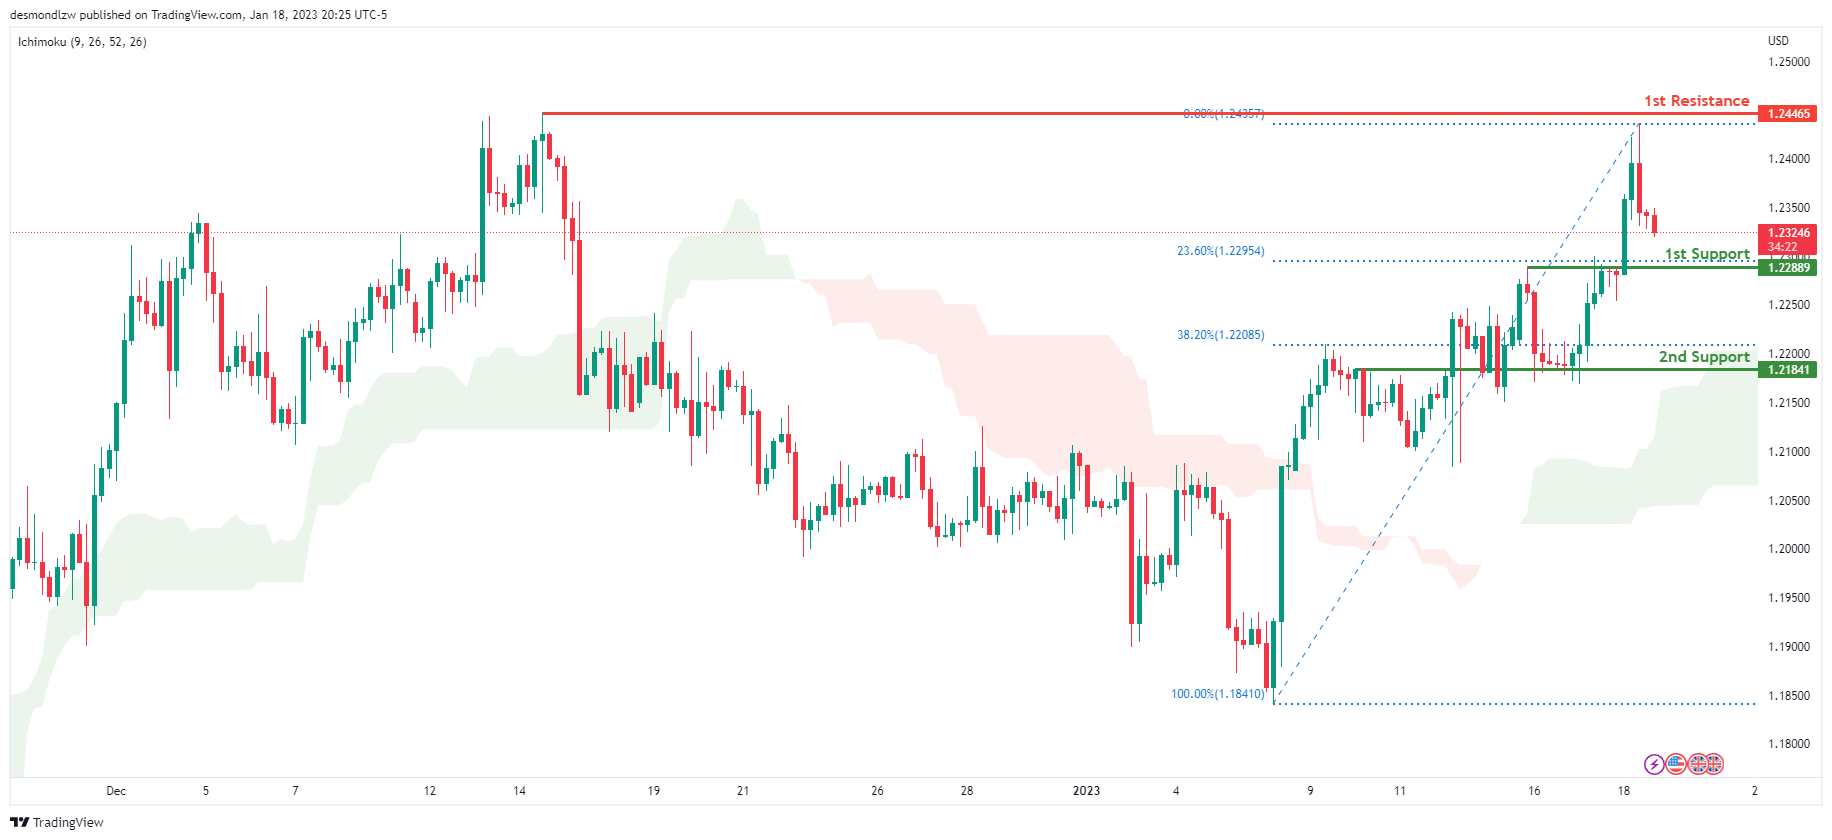
GBP/USD:
Looking at the H4 chart, my overall bias for GBPUSD is bullish due to the current price being above the Ichimoku cloud, indicating a bullish market. If this bullish momentum continues, expect price to possibly continue heading towards the 1st resistance line at 1.24465, where the previous swing high is. In an alternate scenario, price could possibly head back down and retest the 1st support at 1.22889, where the 23.6% Fibonacci line is.
Areas of consideration:
- H4 1st resistance at 1.24465
- H4 1st support at 1.22889
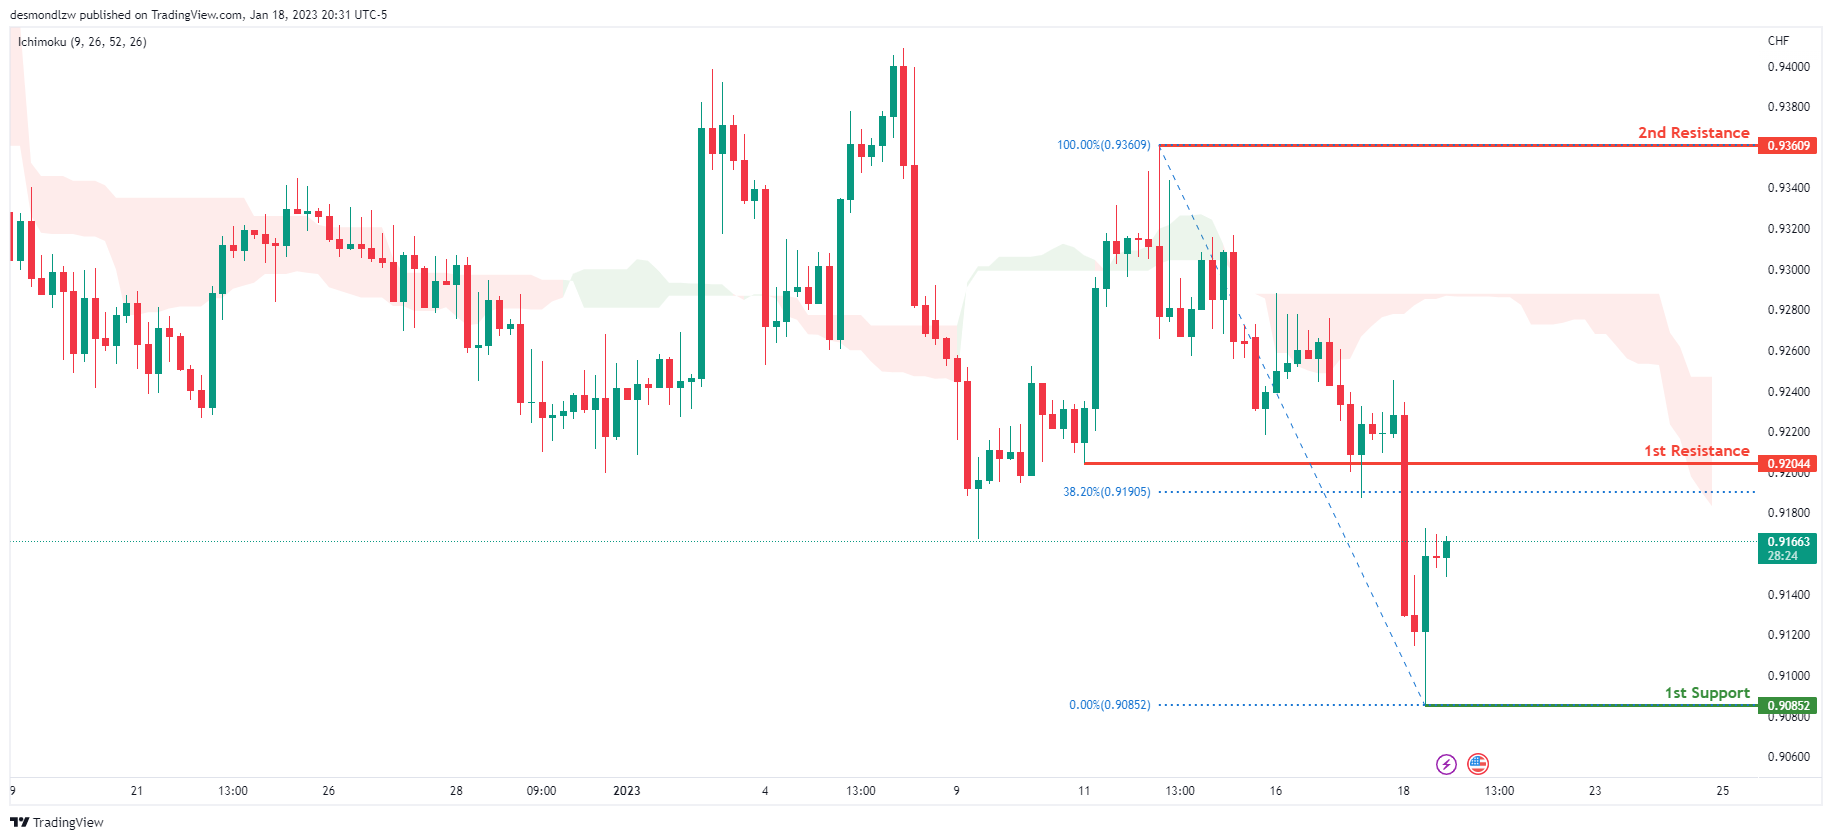
USD/CHF:
Looking at the H4 chart, my overall bias for USDCHF is bearish due to the current price crossing below the Ichimoku cloud, indicating a bearish market. If the current bearish trend continues, expect the price to possibly continue to head towards the 1st support at 0.90852, where the recent low is. In an alternative scenario, price could possibly head back up to retest the 1st resistance at 0.92044, where the 38.2% Fibonacci line is.
Areas of consideration
- H4 1st support at 0.90852
- H4 1st resistance at 0.92044
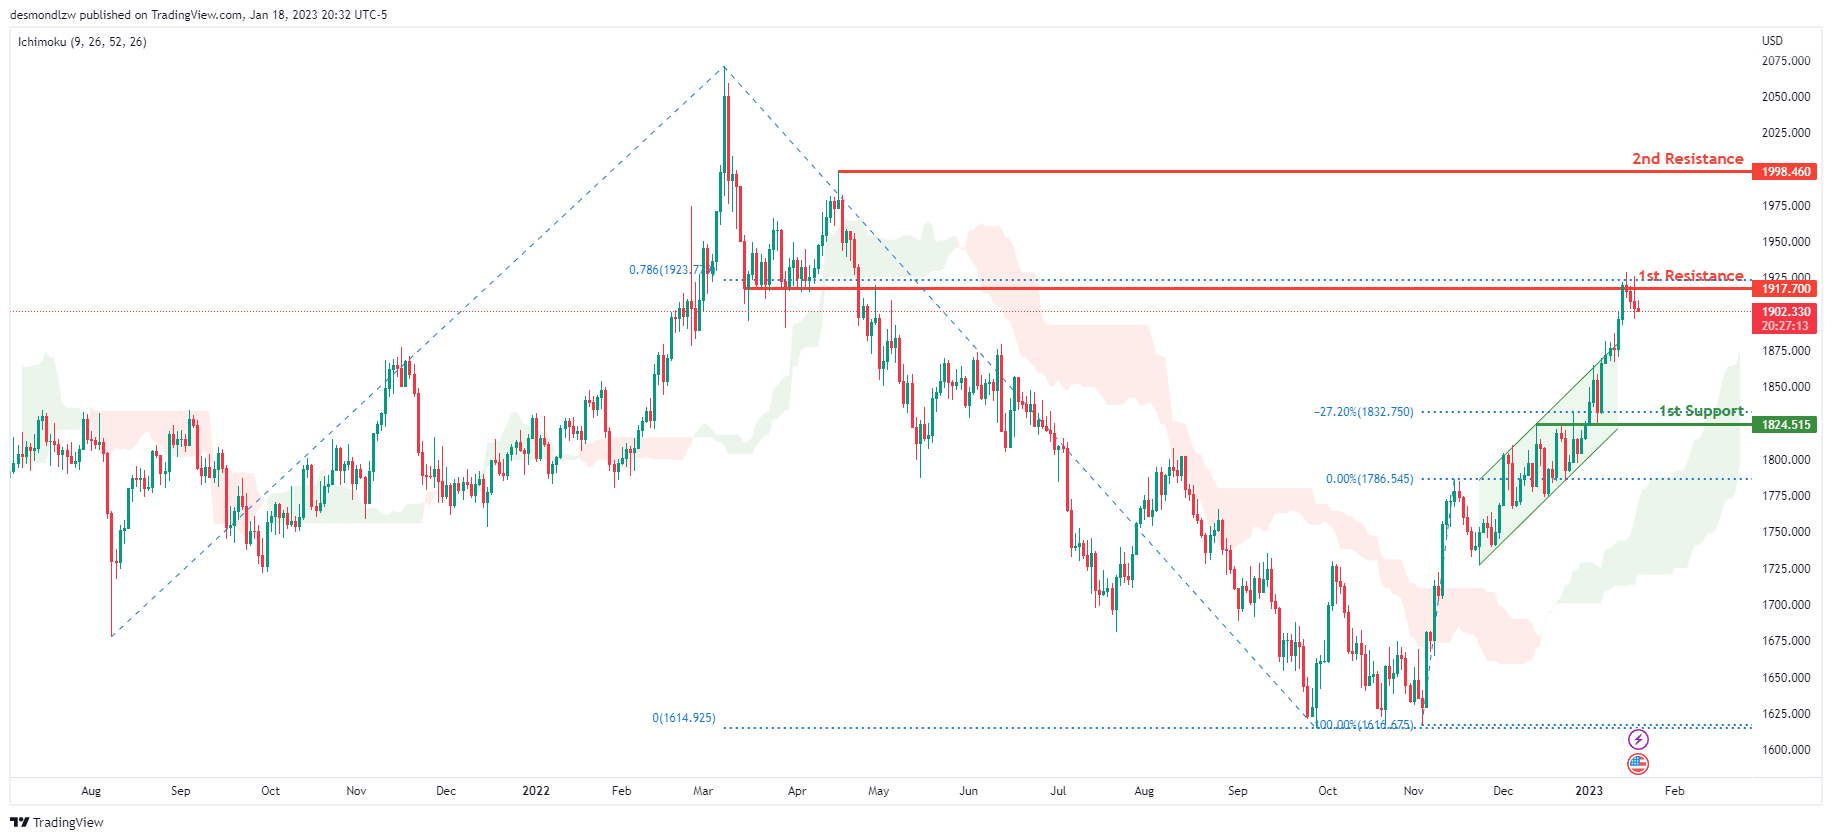
XAU/USD (GOLD):
Looking at the Daily chart, my overall bias for XAUUSD is bullish due to the current price crossing above the Ichimoku cloud, indicating a bullish market. To add support to this bias, price has also broken above the bullish ascending channel. If this bullish momentum continues, expect the price to possibly break the 1st resistance at 1917.700 where the 78.6% Fibonacci projection line is, before heading towards the 2nd resistance at 1998.460, where the previous swing high is. In an alternative scenario, price could possibly head back down to retest the 1st support at 1824.515 where the -27.2% Fibonacci expansion line is.
Areas of consideration:
- H4 time frame, 1st resistance at 1917.700
- H4 time frame, 2nd resistance at 1998.460
- H4 time frame, 1st support at 1824.515
- H4 time frame, 2nd support at 1824.515
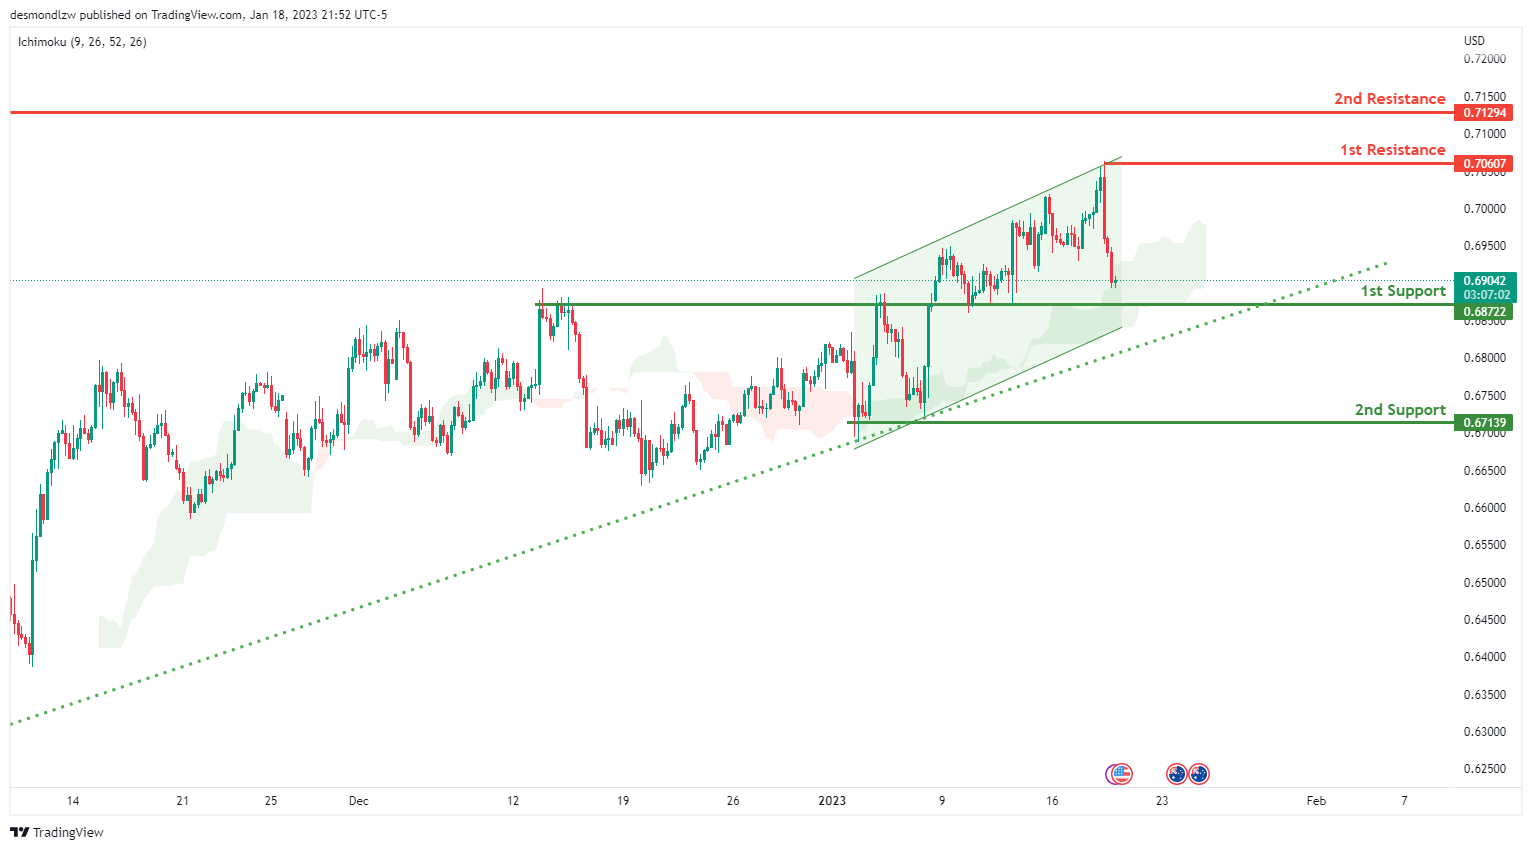
AUD/USD:
Looking at the H4 chart, we can see that the 1st support is at 0.68722 which is an overlap support. There is an ascending trend line that starts from 3rd JAN 2023 which suggests that there is bullish momentum. There is also an ascending channel. 1st resistance is at 0.70607 which is a recent swing high. 2nd resistance is slightly higher at 0.71294
Areas of consideration
- H4, 2nd resistance at 0.71294
- H2. 1st resistance at 0.70607
- H4, 1st support at 0.68722
- H4.2nd support at 0.67139
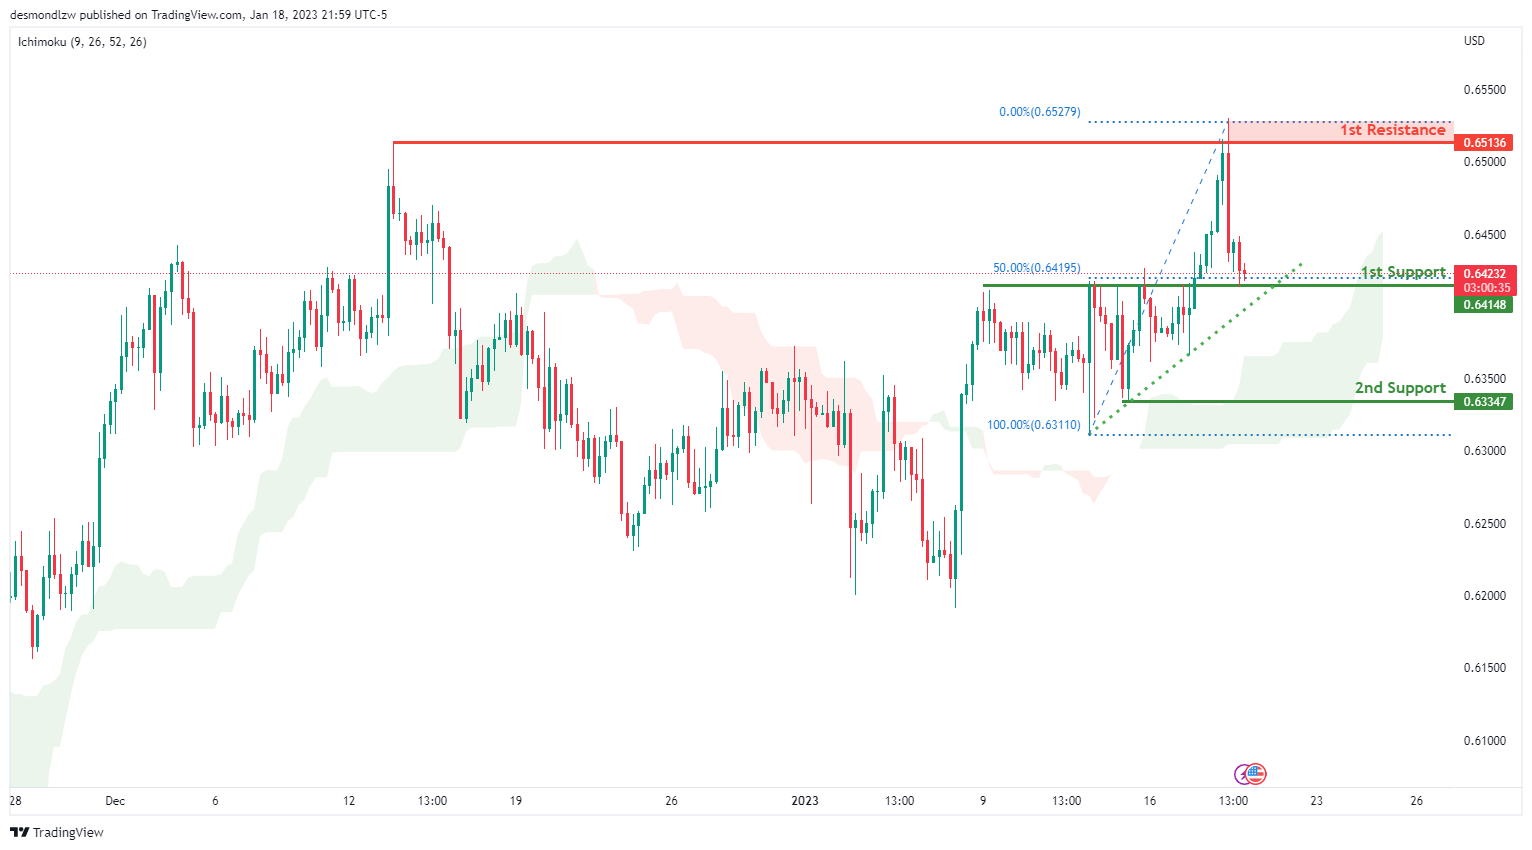
NZD/USD:
Looking at the H4 chart, we can see that the 1st support is at 0.64148 which is an overlap support which is in line with the 50% Fibonacci line. If price breaks this level, we could see it drop to 2nd support is down at 0.63347. As the current price is above the Ichimoku cloud, there is an ascending trend line , which suggests bullish momentum.
For the resistance, our 1st resistance is at 0.65136 which is a recent swing high resistance area.
Areas of consideration:
- H4 time frame, 1st resistance at 0.65136
- H4 time frame, 1st support at 0.64148
- H4 time frame, 2nd support at 0.63347
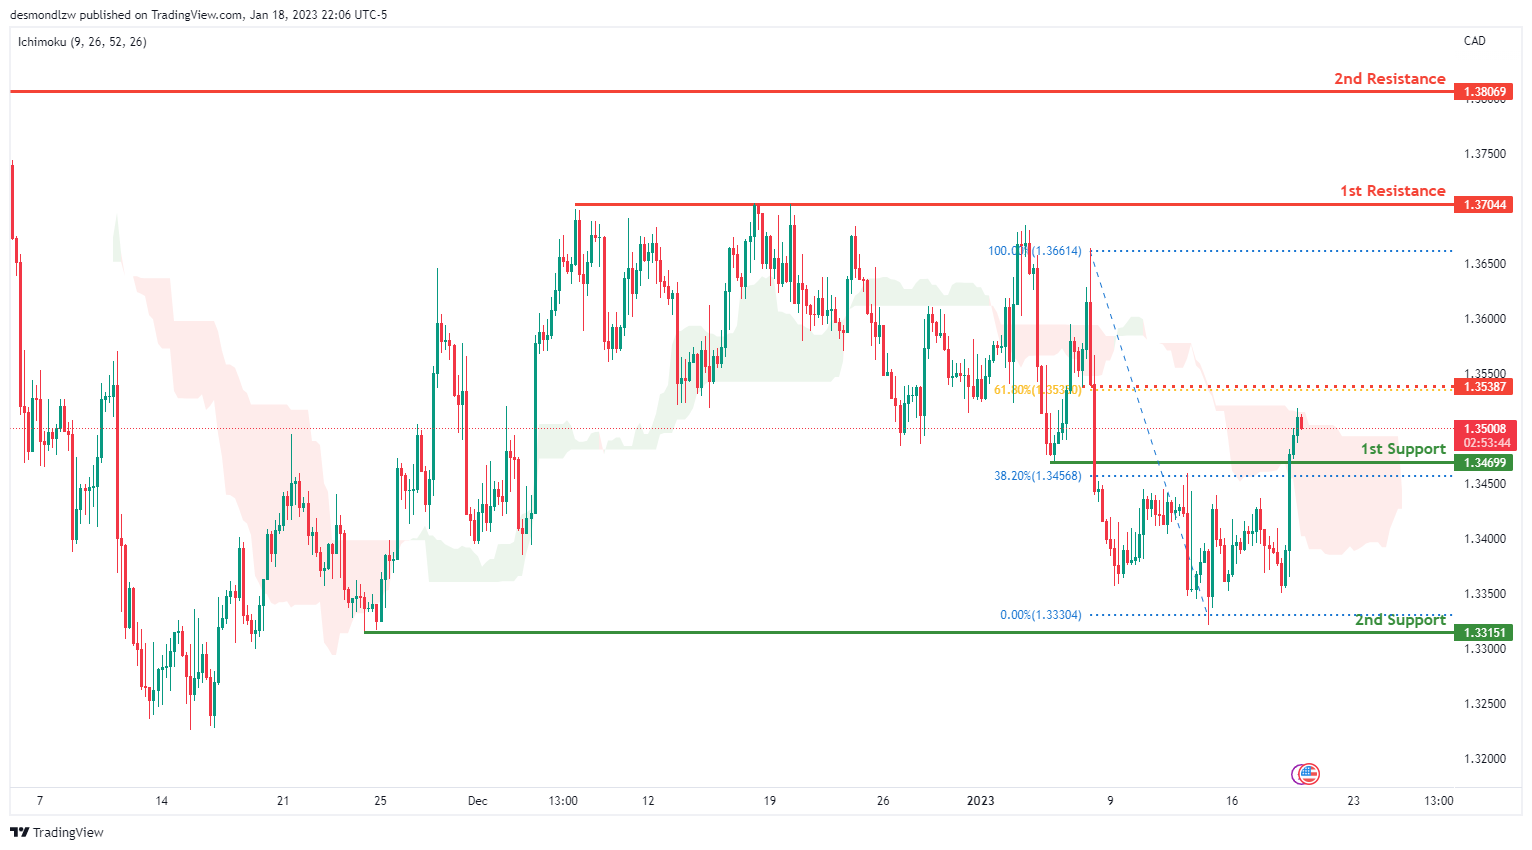
USD/CAD:
On the H4 chart, the 1st support is at 1.34699 which is an overlap support. The 1st support line also at 38.2% Fibonacci retracement. And the 2nd support 1.33151 which is the recent swing low .
In terms of resistance, the 1st resistance we can see is at 1.37044 which is the recent swing high. If the price breaks this level, it could go up to the 2nd resistance at 1.38069. There is an intermediate resistance line at 1,35387 which is in line with 61.8% Fibonacci retracement.
Areas of consideration:
- H4 time frame. 2nd resistance at 1.38069
- H4 time frame. Intermediate resistance at 1.35387
- H4 time frame, 1st resistance at 1.37049
- H4 time frame, 1st support at 1.34699
- H4 time frame, 2nd support at 1.33151
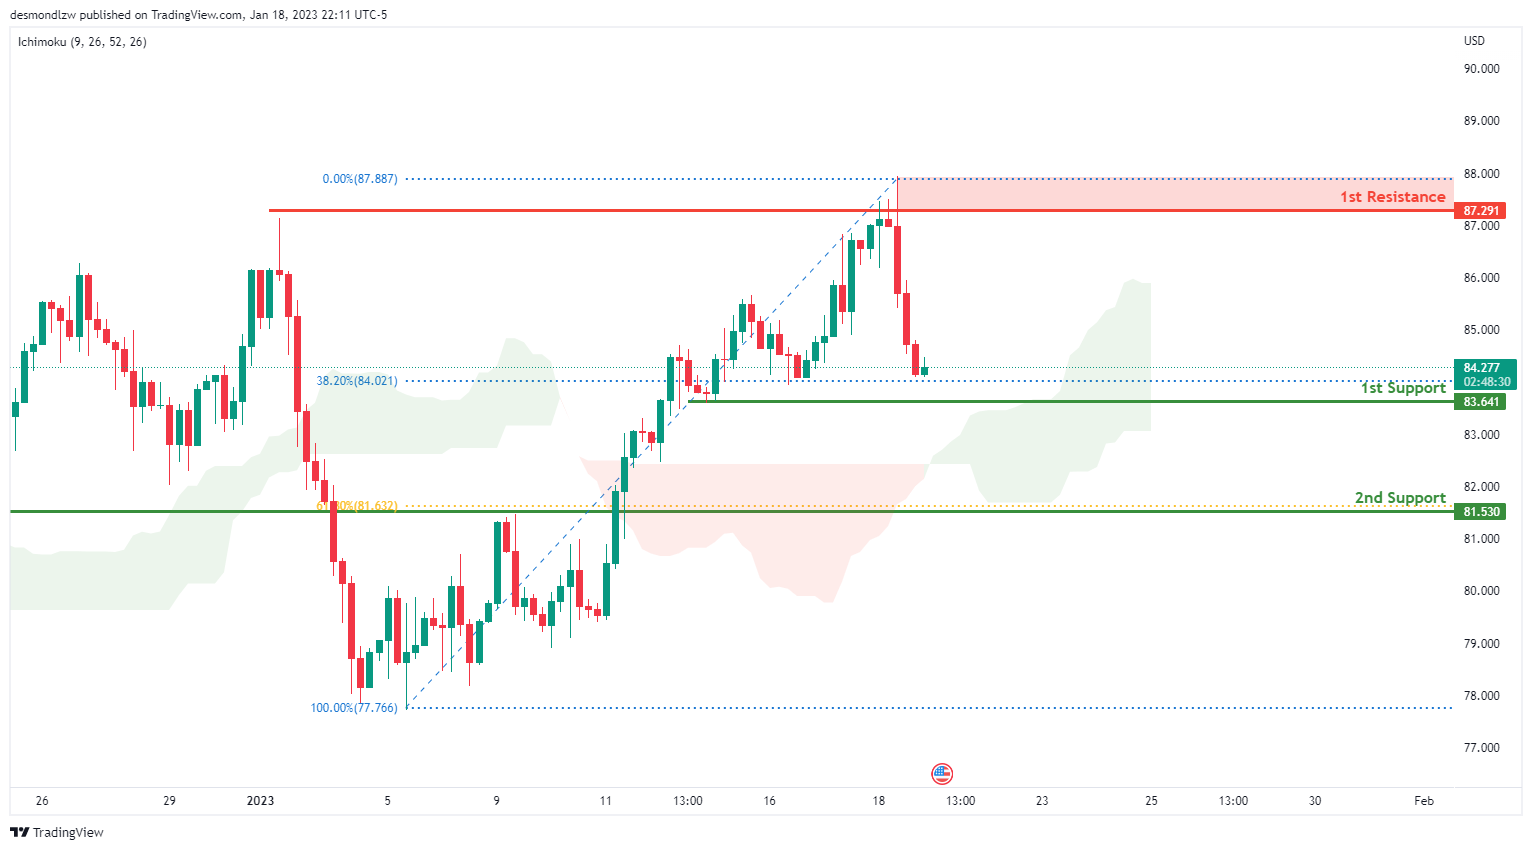
OIL:
Looking at the H4 chart, we can see that the 1st resistance is at 87.291 which is an overlap area.
In terms of support, we can see our 1st support at 83.641 which is overlap support. It is also in line with 38.2% retracement. Breaking this level would trigger a further drop to our 2nd support at 81.530 where is line with 61.8% Fibonacci line.
Areas of consideration:
- H4 time frame, 1st resistance at 87.291
- H4 time frame,1st support at 83.641
- Hr time frame, 2nd support at 81.530
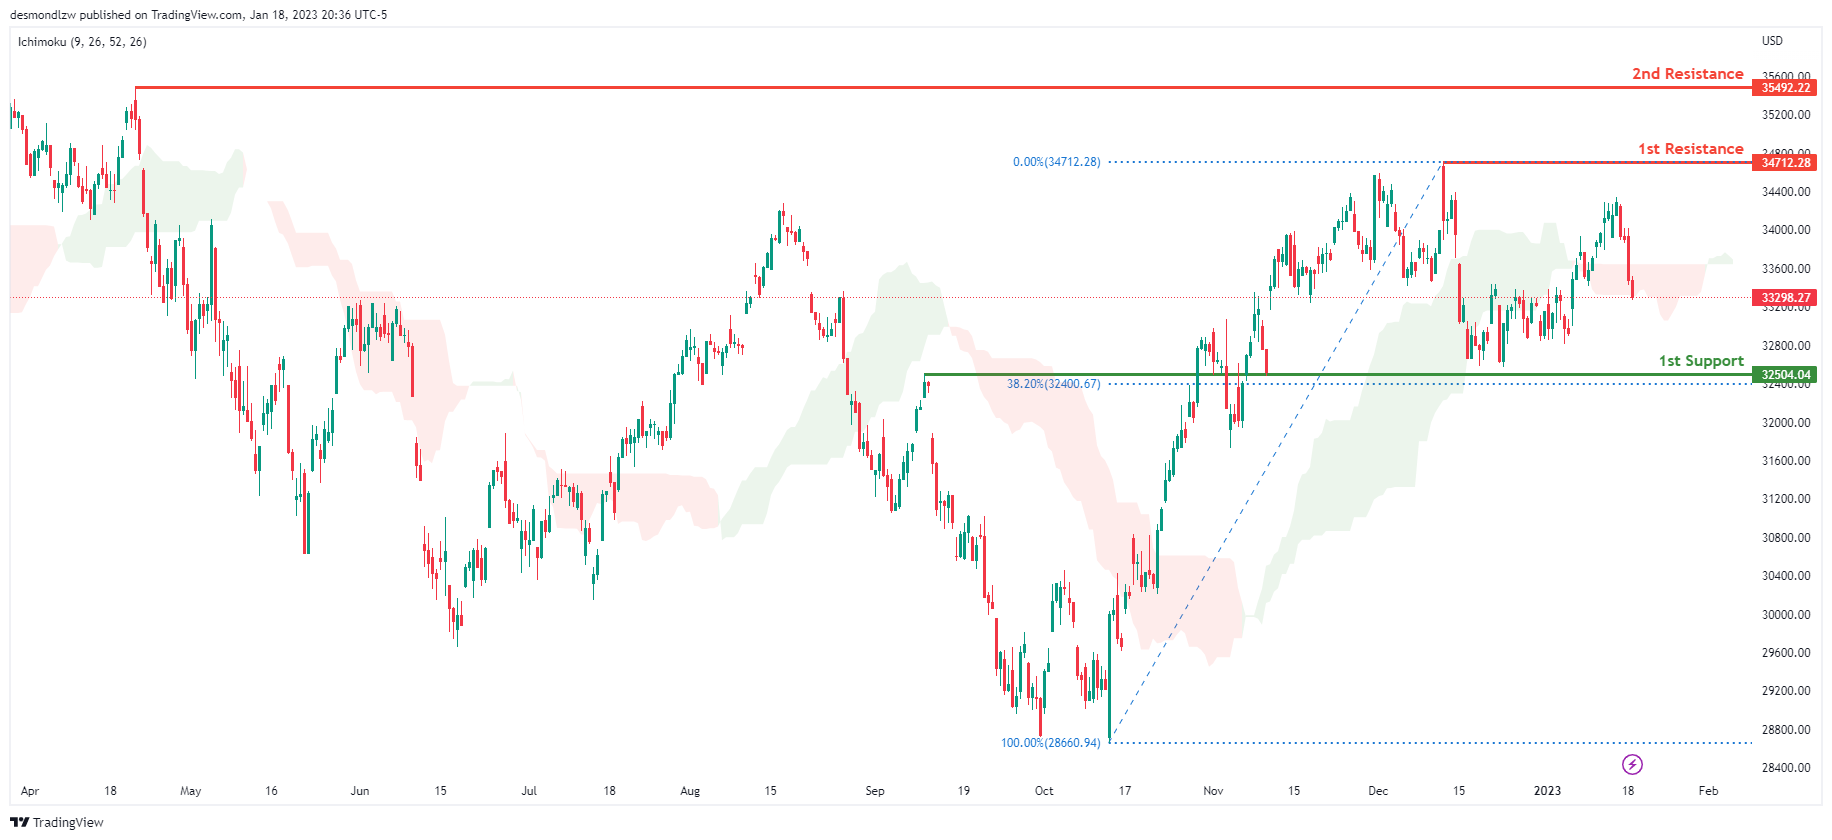
Dow Jones Industrial Average:
On the H4 chart, the overall bias for DJI is bullish. To add confluence to this, the price is crossing above the Ichimoku cloud which indicates a bullish market. If this bullish momentum continues, expect the price to possibly continue heading towards the 1st resistance line at 34712.28, where the recent swing high is. In an alternative scenario, price could possibly head back down towards the 1st support at 32581.97, slightly above where the 38.2% Fibonacci line is.
Areas of consideration:
- H4 time frame, 1st support at 32581.97
- H4 time frame, 1st Resistance at 34712.28
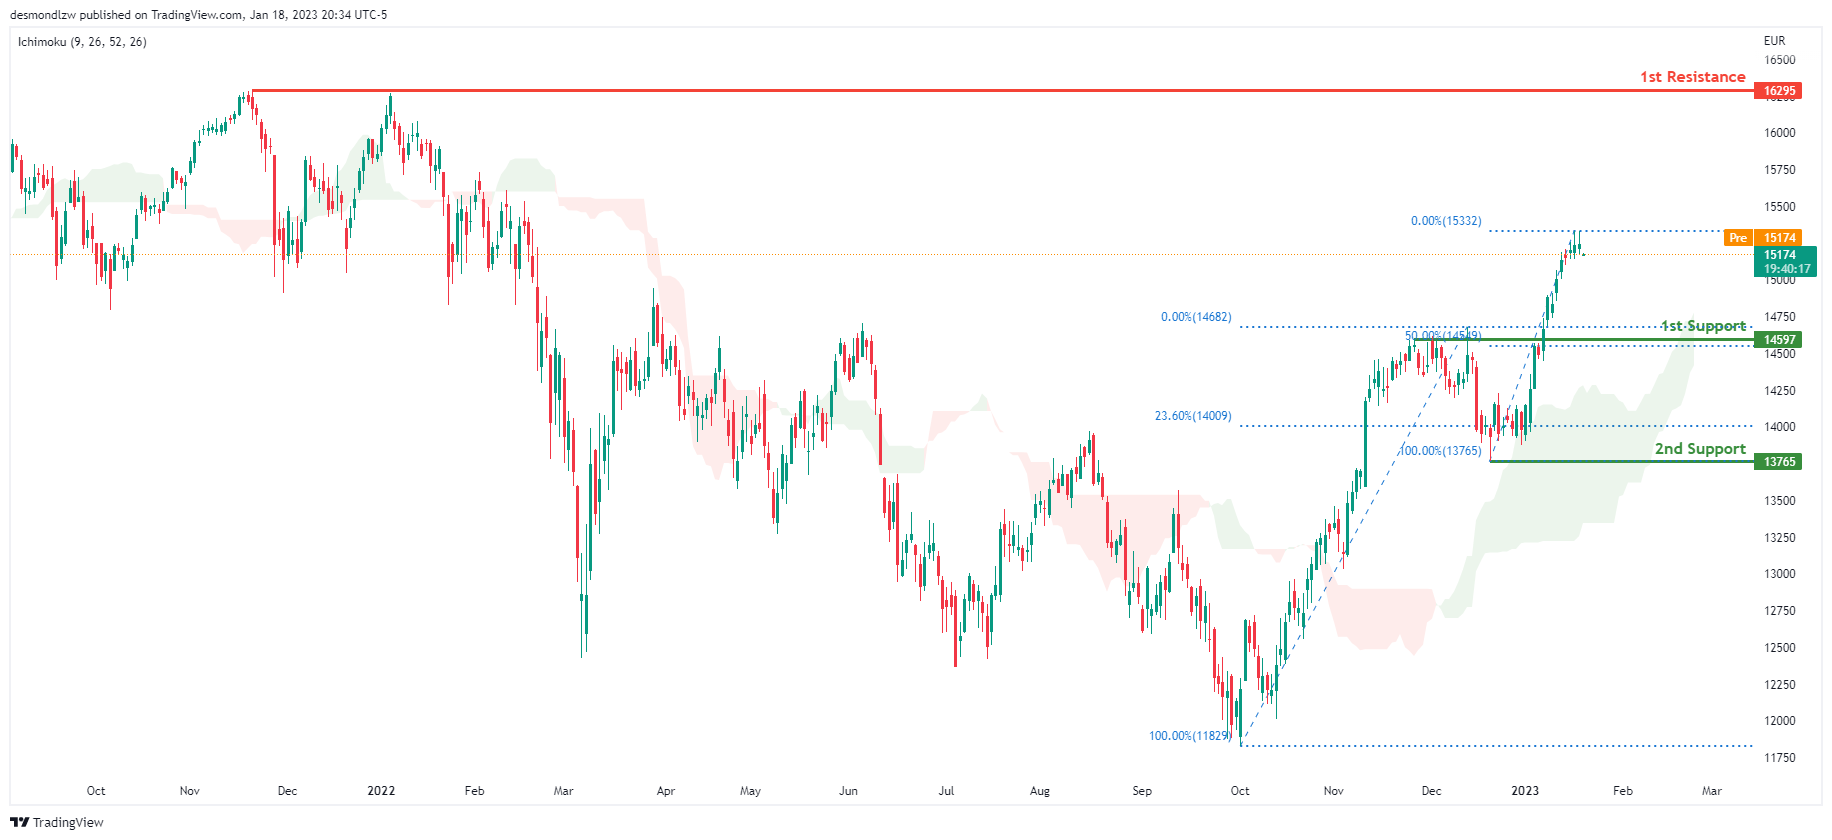
DAX:
Looking at the Daily chart, my overall bias for DAX is bullish due to the current price crossing above the Ichimoku cloud, indicating a bullish market. If this bullish momentum continues, expect the price to possibly head towards the 1st resistance line at 16295, where the previous swing high is. In an alternative scenario, price could possibly head down to retest the 1st support at 14597, where the 50% Fibonacci line is.
Areas of consideration:
- H4 time frame, 1st resistance is at 16295
- H4 time frame, 1st support is at 14597
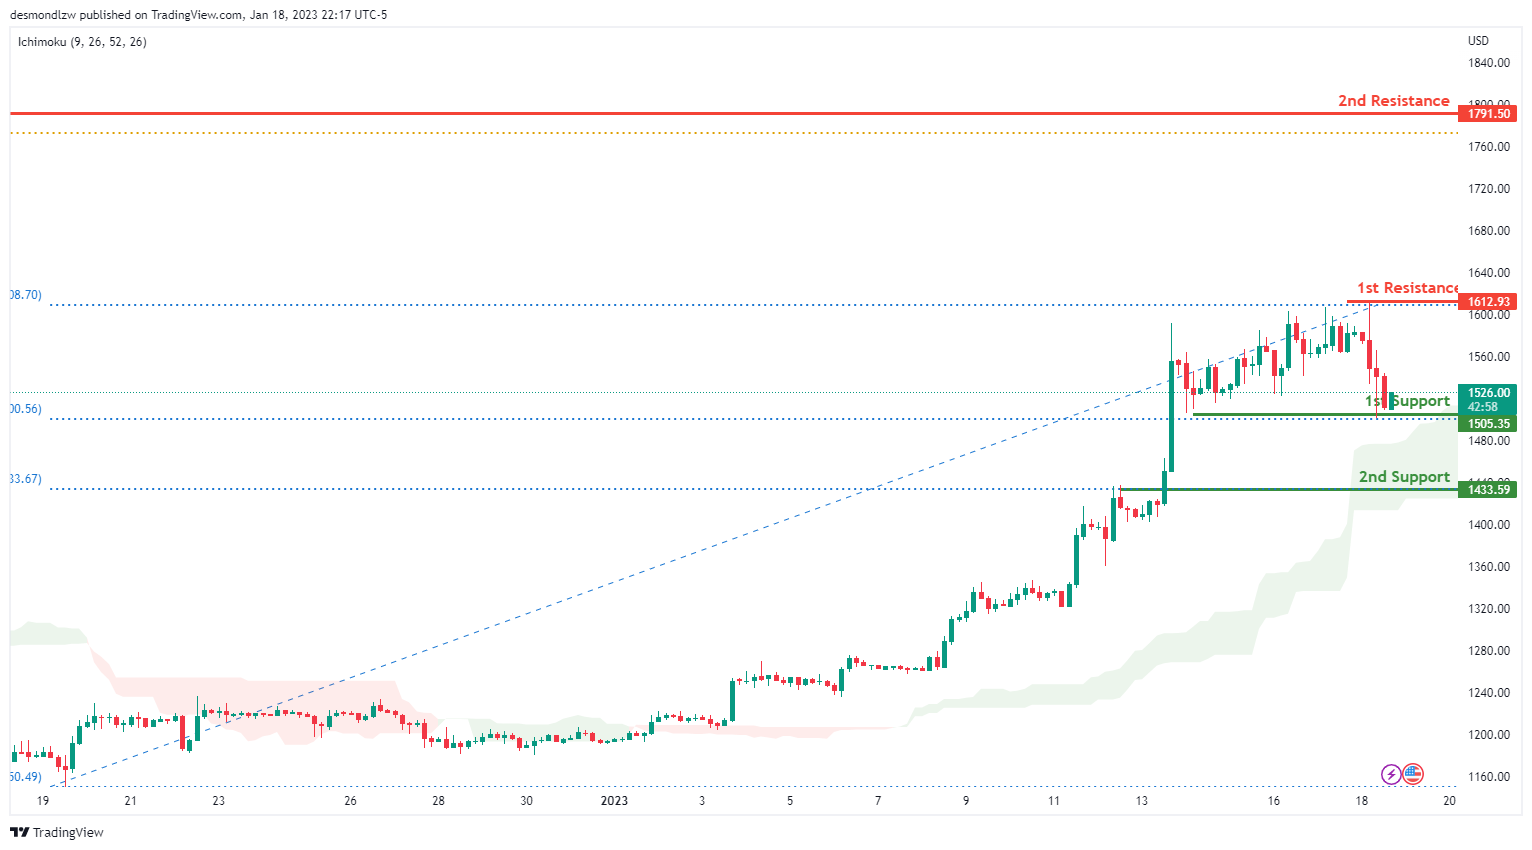
ETHUSD:
Looking at the H4 chart, my overall bias for ETHUSD is bullish due to the current price crossing above the Ichimoku cloud, indicating a bullish market. If this bullish momentum continues, expect the price move to the 1st support at 1150.49 which is recent overlap swing low. It is also in line with the 23.6% Fibonacci line And it may head to the 1st resistance at 1612.93 where the previous swing high is. In an alternative scenario, if the price break through the 1st support line, the price may further down to the 2nd support line 1433.59 where is 38.2% Fibonacci line is.
Areas of consideration:
- H4 time frame, 1st resistance of 1791.50
- H4 time frame, 1st resistance of 1612.93
- H4 time frame, 1st support at 1150.49
- H4 time frame, 2nd support at 1433.59
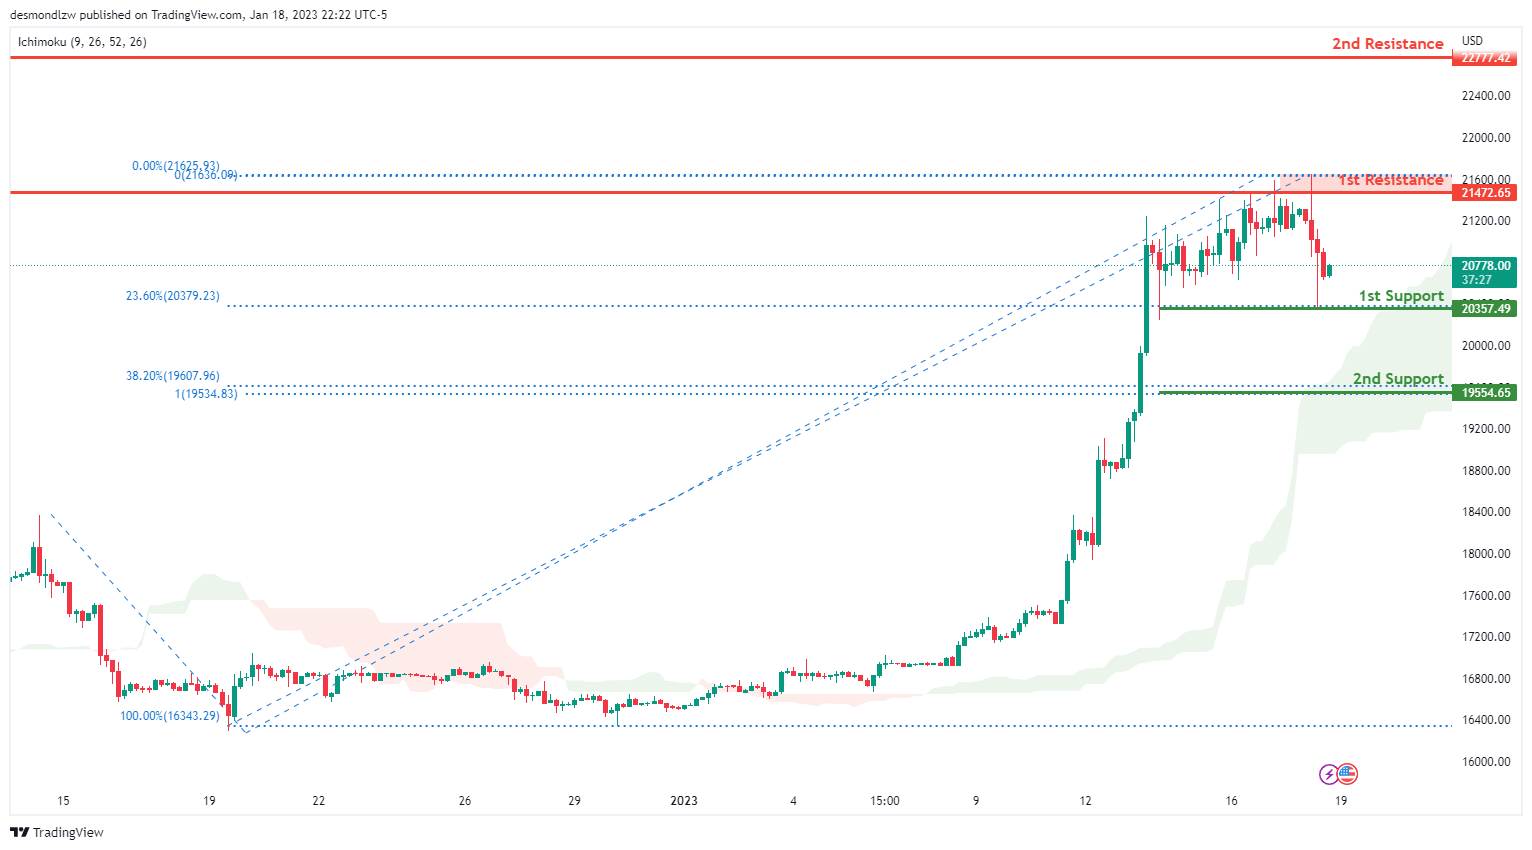
BTCUSD:
Looking at the H4 chart, my overall bias for BTCUSD is bullish due to the current price being above the Ichimoku cloud, indicating a bullish market. If this bullish momentum continues, expect the price to possibly break the 1st resistance at 21472.65 which is the recent swing high area, before heading towards the 2nd resistance at 22777.42. In an alternative scenario, the price could possibly head back down to retest the 1st support at 20357.49 where the 38.2% Fibonacci line is. The 2nd support line is at 19554.65 where 100% Fibonacci projection and 38.2% Fibonacci rertracement are.
Areas of consideration:
- H4 time frame, 2nd resistance 22777.42
- H4 time frame, 1st resistance 21670.55
- H4 time frame, 1st support at 21522.06.
- H4 time frame, 2nd support at 19554.65
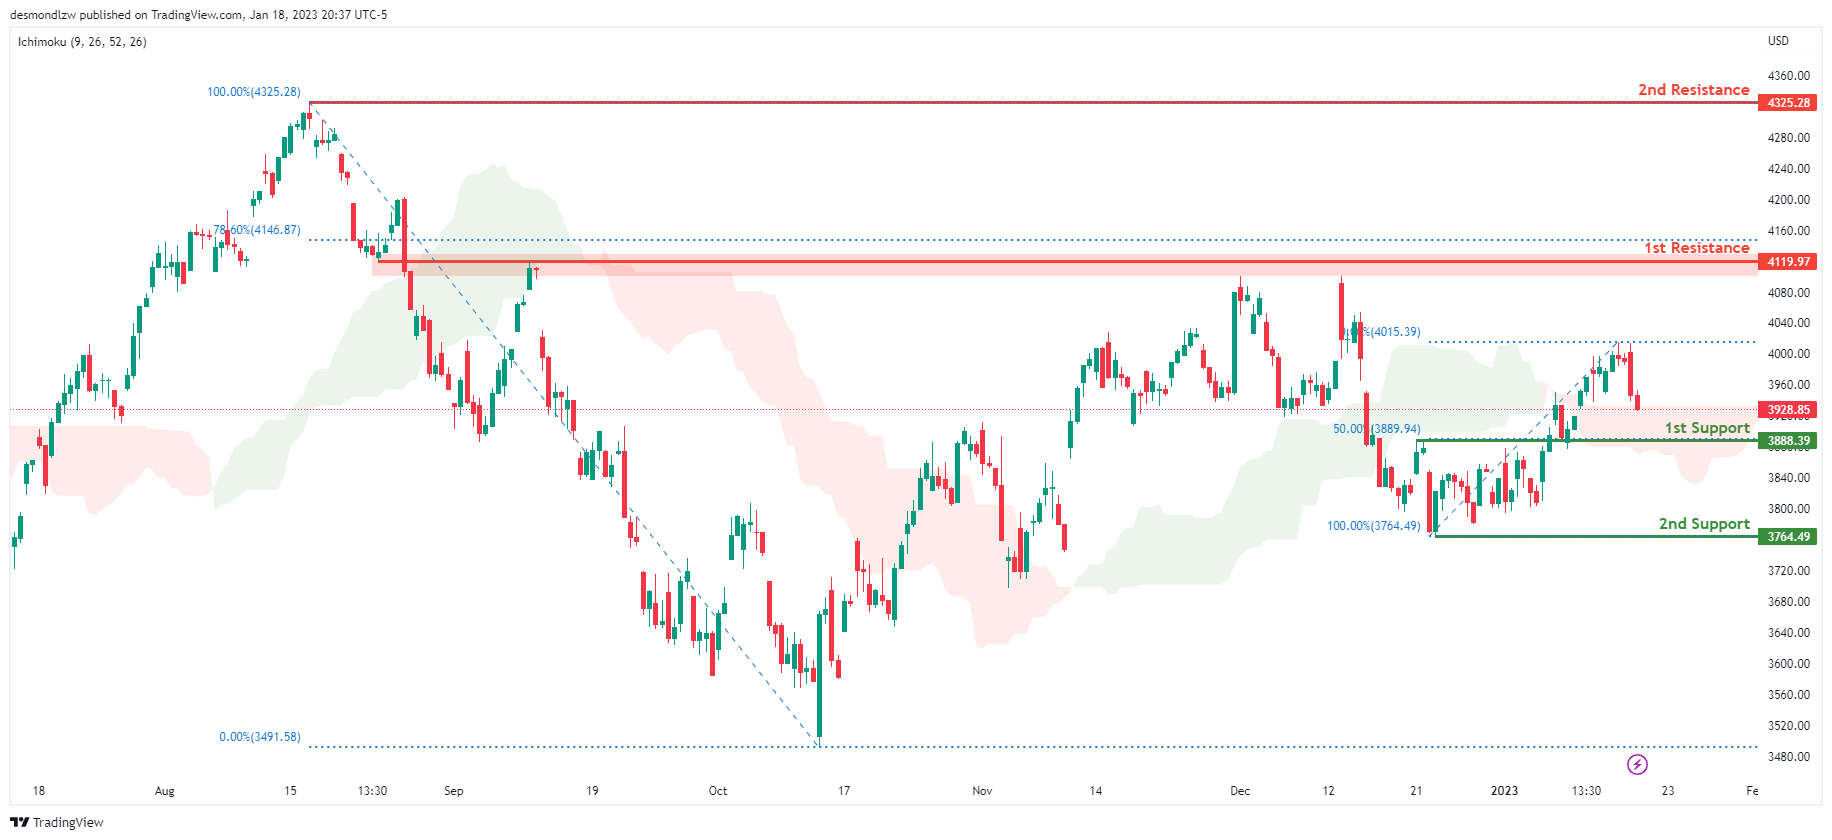
S&P 500:
Looking at the H4 chart, my overall bias for S&P500 is bullish due to the current price being above the Ichimoku cloud, indicating a bullish market. If this bullish momentum continues, expect the price to continue heading towards the 1st resistance at 4119.97, where the 78.6% Fibonacci line is. In an alternative scenario, price could possibly head back down to retest the 1st support at 3888.39, where the 50% Fibonacci line is.
Areas of consideration:
- H4 time frame, 1st support at 3888.39
- H4 time frame, 1st resistance at 4119.97


