
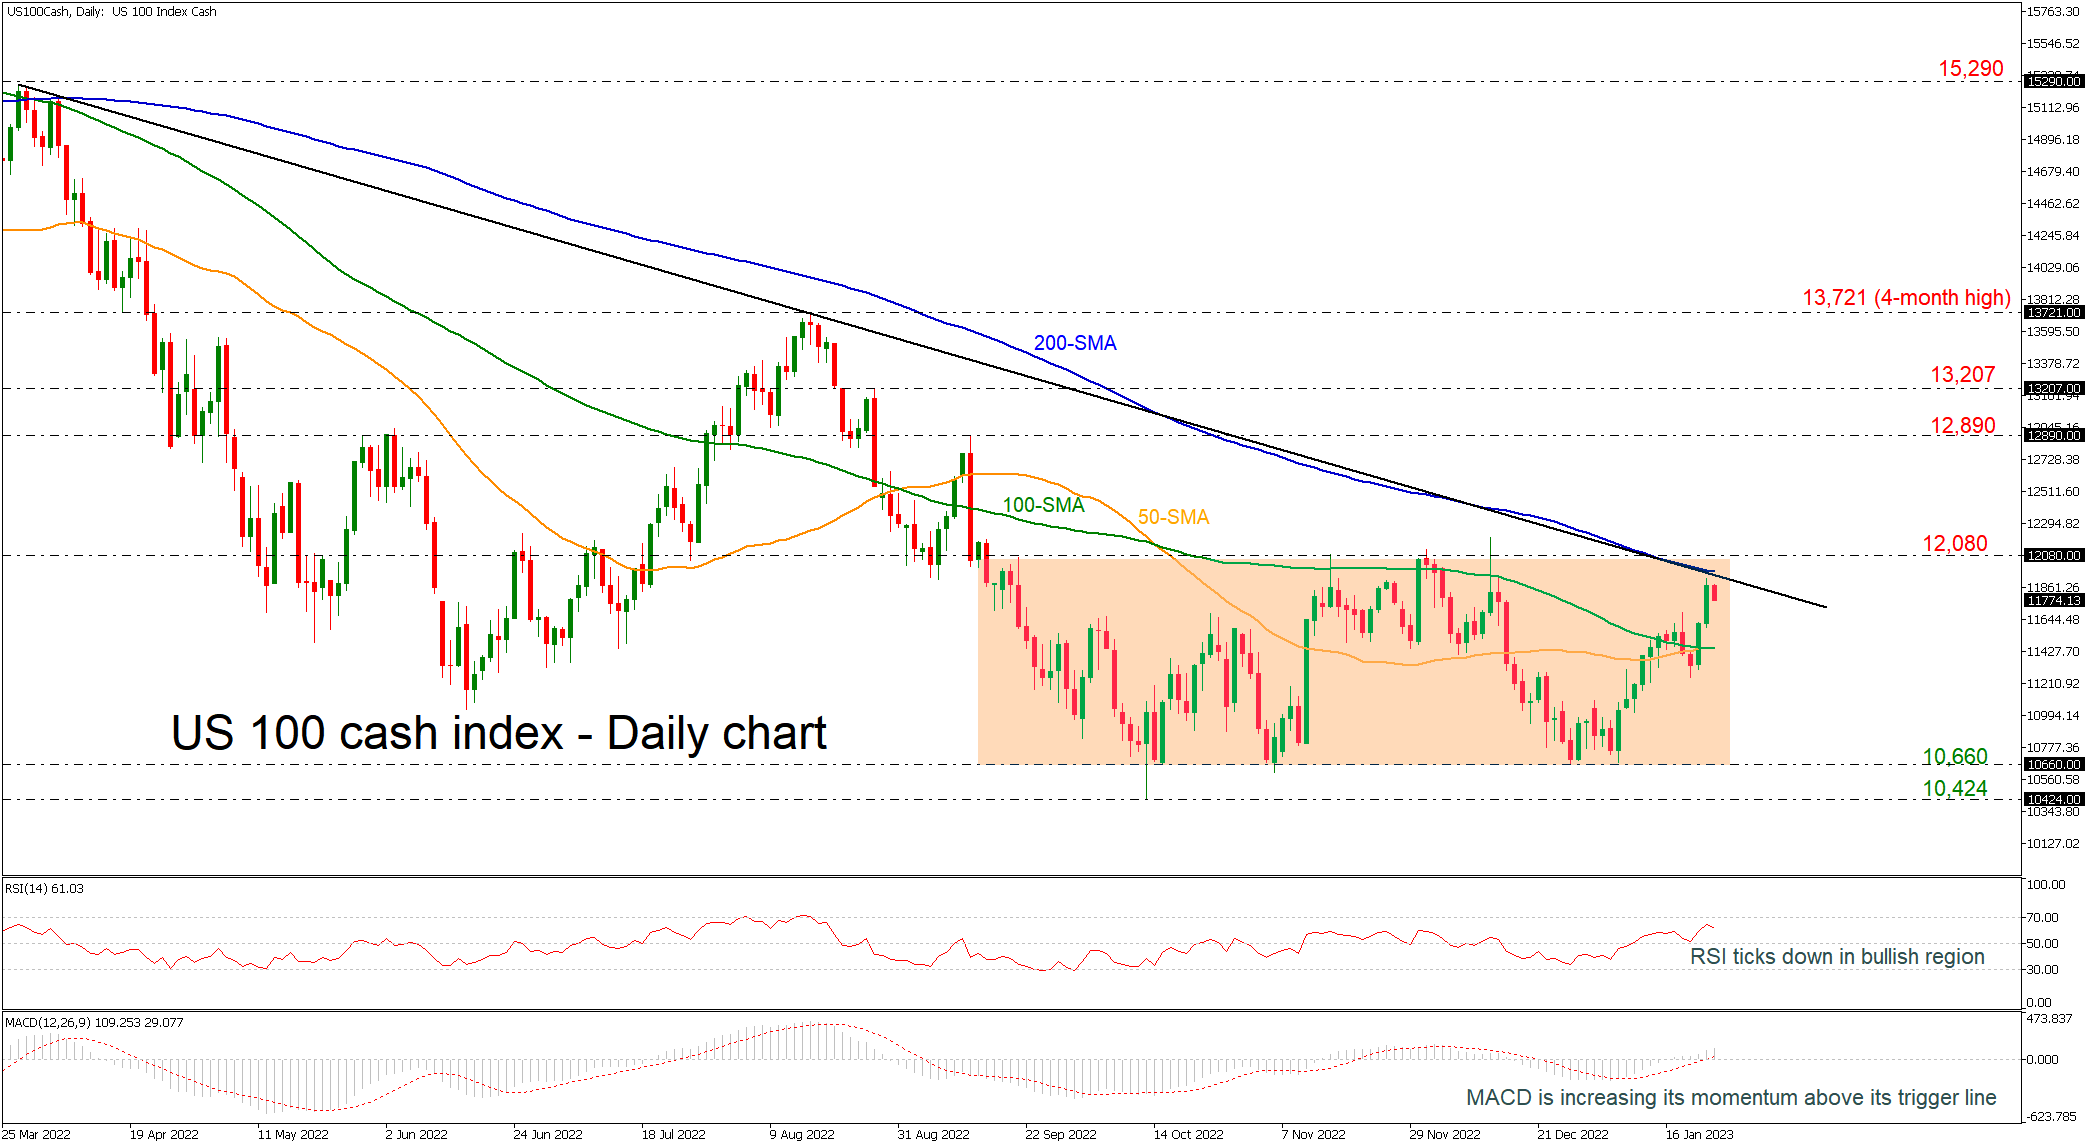
The US 100 cash index is flirting with the long-term downtrend line, taken from the peak in March 2022 and the 200-day SMA around 11,970. The index has been consolidating within a sideways channel with upper boundary the 12,080 resistance and lower boundary the 10,660 support. The RSI is sloping down in the positive region; however, the MACD is still extending its momentum above its trigger and zero lines.
Traders would be more eager to engage in buying activities if the price manages to surpass the nearby barrier of the 200-day SMA at 11,970. If this is successfully breached, the rally may next rest somewhere between 12,890 and 13,207.
On the flip side, the selling pressure could accelerate again if the market deteriorates below the 50- and the 100-day SMAs lines. Such a move could next bring the 10,660 lower boundary under the spotlight, which if violated could trigger sharper losses probably towards 10,424.
In the long-term timeframe, the pair is in a bearish trend, while in the medium-term it is neutral. A push above 12,080 may shift the outlook to slightly bullish.


