
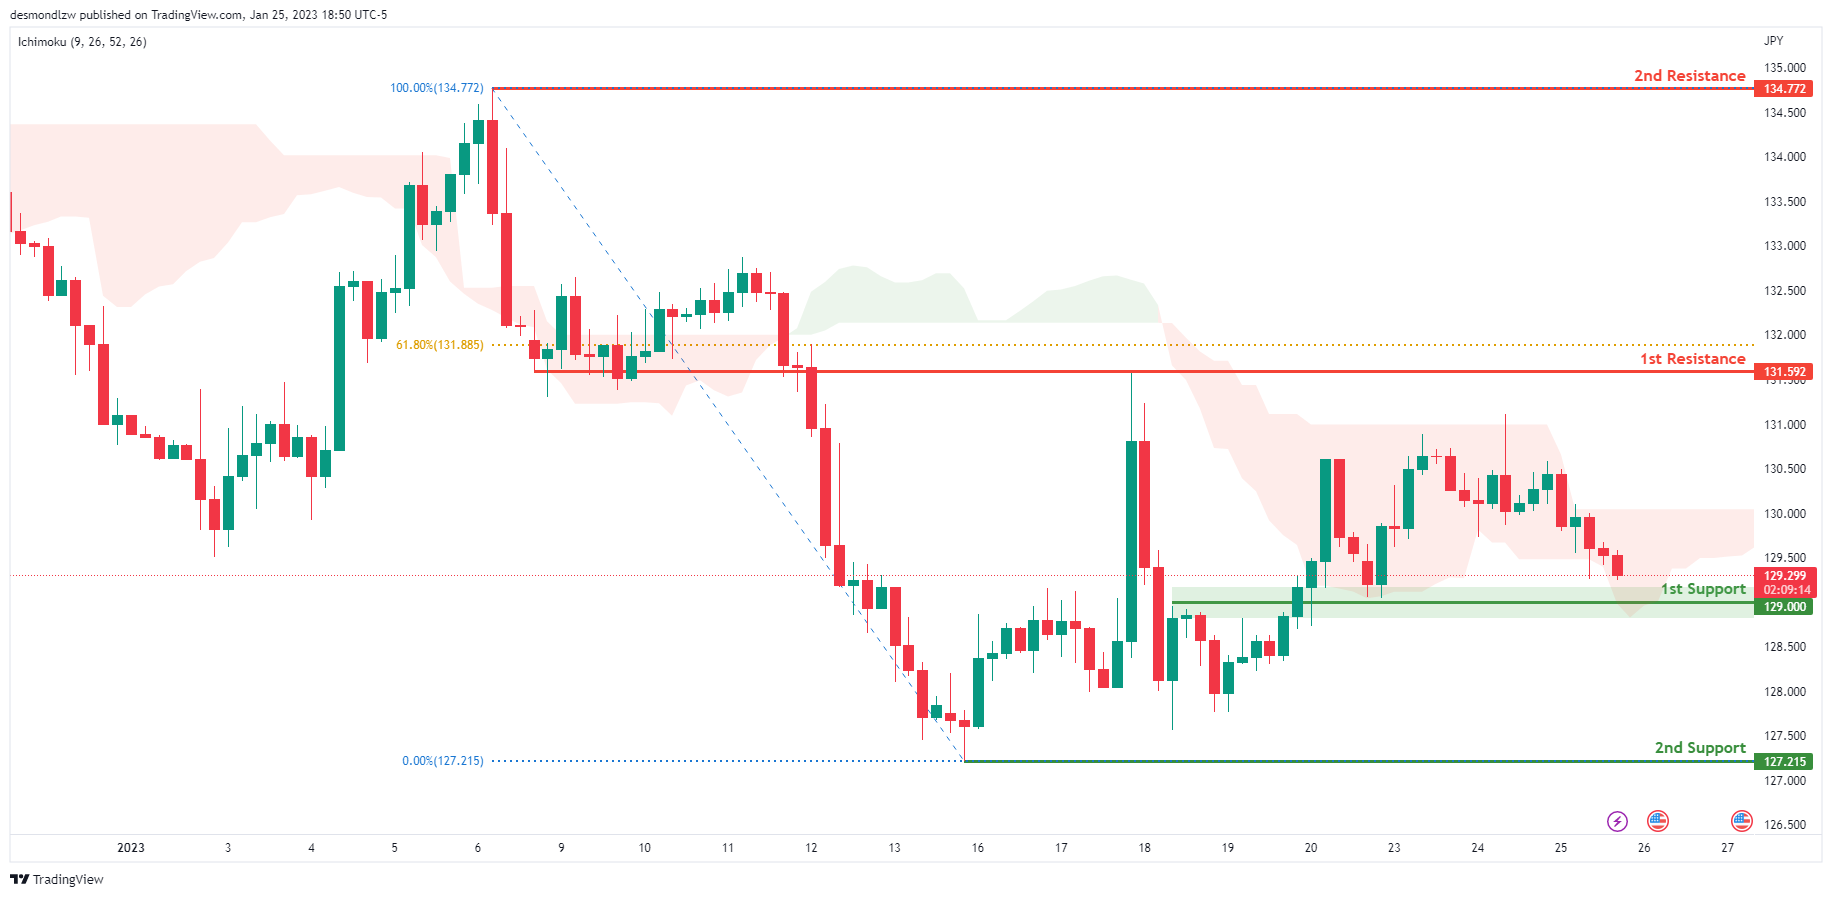
USD/JPY:
Looking at the H4 chart, my overall bias for USDJPY is bullish due to the current price crossing above the Ichimoku cloud, indicating a bullish market. If this bullish momentum continues, expect the price to possibly continue heading towards the 1st resistance level at 131.592, where the 61.8% Fibonacci line is. In an alternate scenario, price could possibly head back down to retest the 1st support at 129.000, where the overlap support is.
Areas of consideration:
- H4 time frame, 1st resistance at 131.592
- H4 time frame, 1st support at 129.000
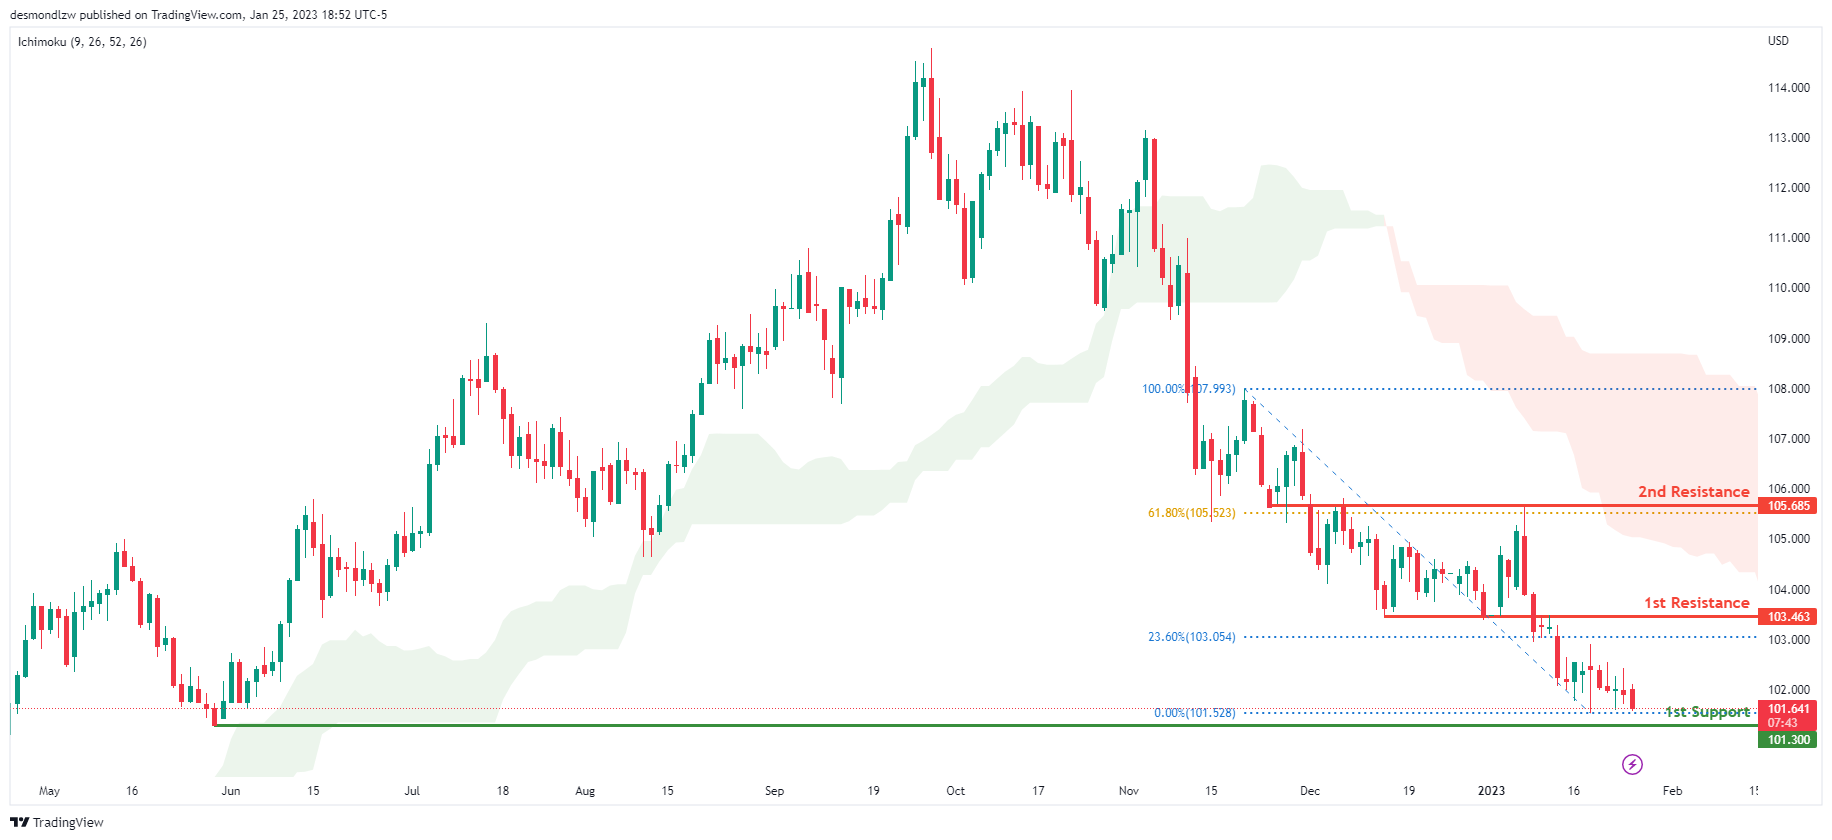
DXY:
Looking at the Daily chart, my overall bias for DXY is bearish due to the current price being below the Ichimoku cloud, indicating a bearish market. If this bearish momentum continues, expect the price to possibly continue heading towards the 1st support at 101.300, where the previous low is. In an alternative scenario, price could head back up to retest the 1st resistance at 103.463, where the 23.6% Fibonacci line is.
Areas of consideration:
- H4 time frame, 1st resistance at 103.463
- H4 time frame, 1st support at 101.300
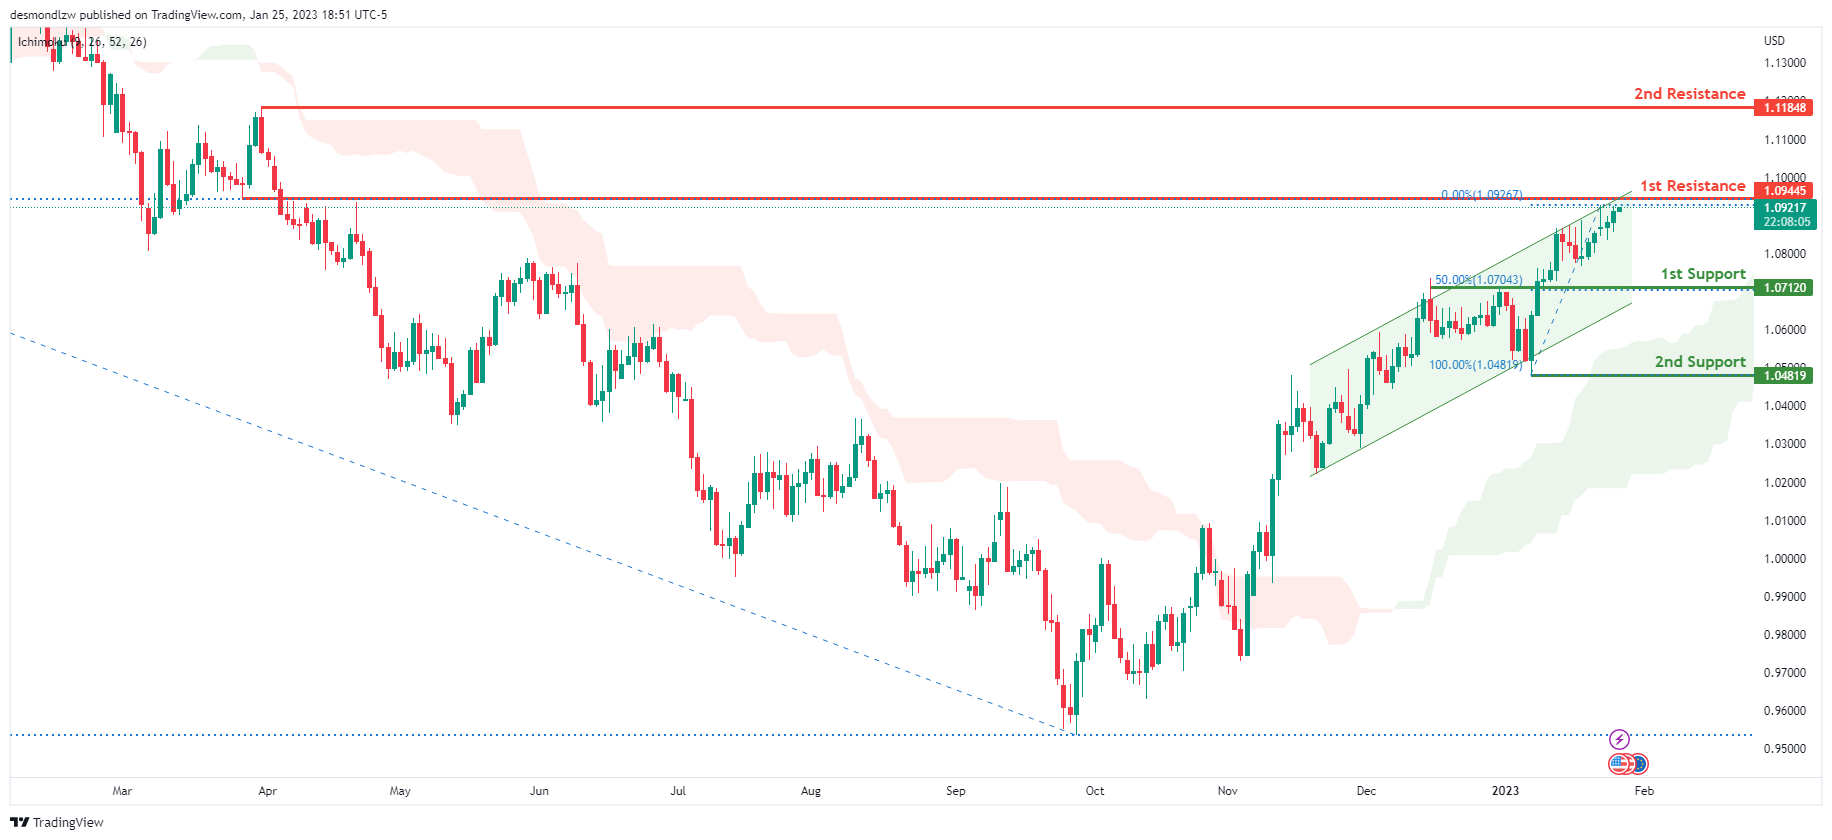
EUR/USD:
Looking at the Daily chart, my overall bias for EURUSD is bullish due to the current price being above the Ichimoku cloud, indicating a bullish market structure. To add confluence to this bias, price is also within an ascending channel. If this bullish momentum continues, expect the price to possibly continue heading towards the 1st resistance at 1.09445, where the 50% Fibonacci line is. In an alternate scenario, price could possibly head back down to retest the 1st support level at 1.07120, where the 50% Fibonacci line is.
Areas of consideration :
- H4 1st resistance at 1.09445
- H4 1st support at 1.07120
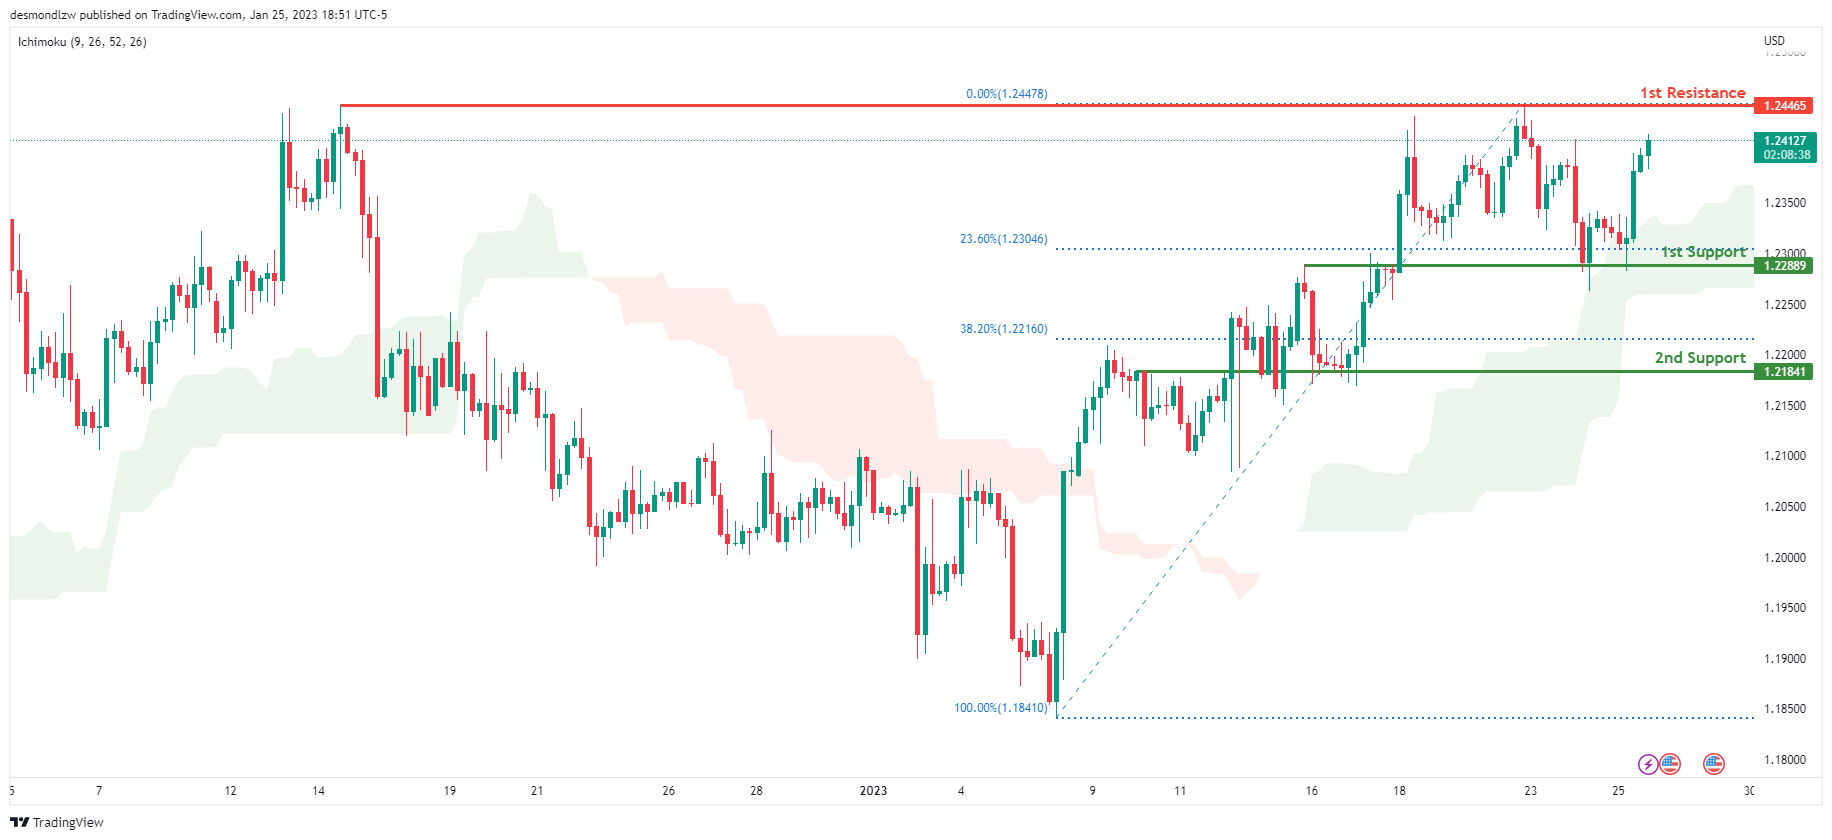
GBP/USD:
Looking at the H4 chart, my overall bias for GBPUSD is bullish due to the current price being above the Ichimoku cloud, indicating a bullish market. If this bullish momentum continues, expect price to possibly continue heading towards the 1st resistance line at 1.24465, where the previous swing high is. In an alternate scenario, price could possibly head back down and retest the 1st support at 1.22889, where the 23.6% Fibonacci line is.
Areas of consideration:
- H4 1st resistance at 1.24465
- H4 1st support at 1.22889
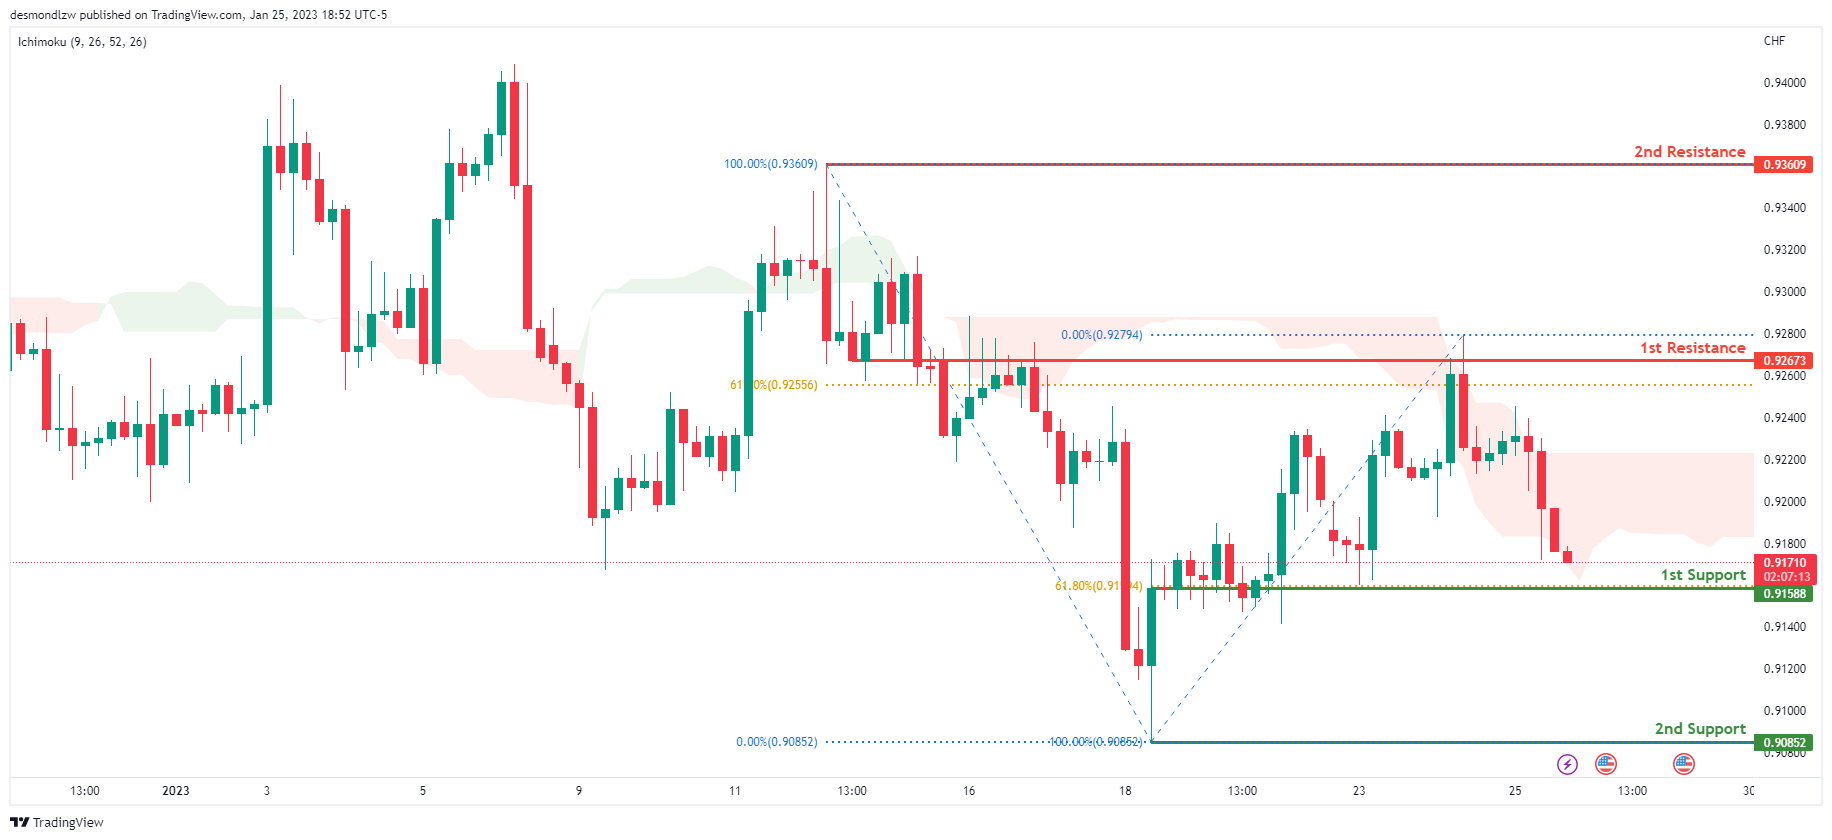
USD/CHF:
Looking at the H4 chart, my overall bias for USDCHF is bearish due to the current price crossing below the Ichimoku cloud, indicating a bearish market. If the current bearish trend continues, expect the price to possibly continue to head towards the 1st support at 0.91588, where the 61.8% Fibonacci line is. In an alternative scenario, price could possibly head back up to retest the 1st resistance at 0.92673, where the 61.8% Fibonacci line is.
Areas of consideration
- H4 1st support at 0.91588
- H4 1st resistance at 0.92673
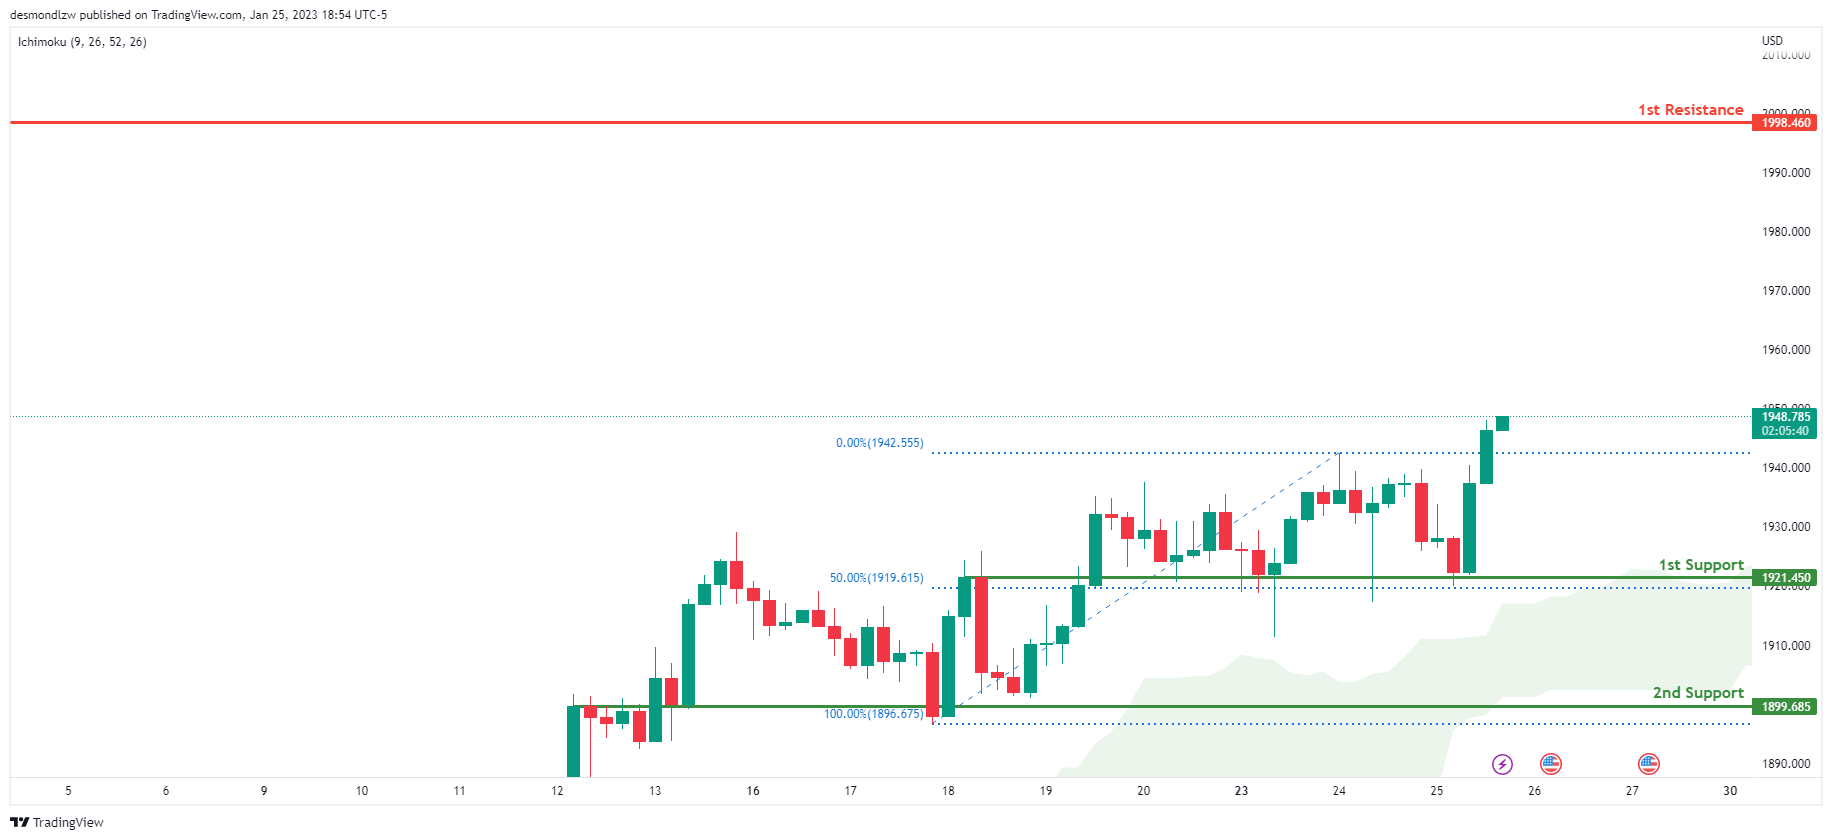
XAU/USD (GOLD):
Looking at the H4 chart, my overall bias for XAUUSD is bullish due to the current price being above the Ichimoku cloud, indicating a bullish market. If this bullish momentum continues, expect the price to possibly continue heading towards the 1st resistance at 1998.460, where the intermediary high is. In an alternative scenario, price could possibly head back down to retest the 1st support at 1921.450 where the 50% Fibonacci line is.
Areas of consideration:
- H4 time frame, 1st resistance at 1998.460
- H4 time frame, 1st support at 1921.450
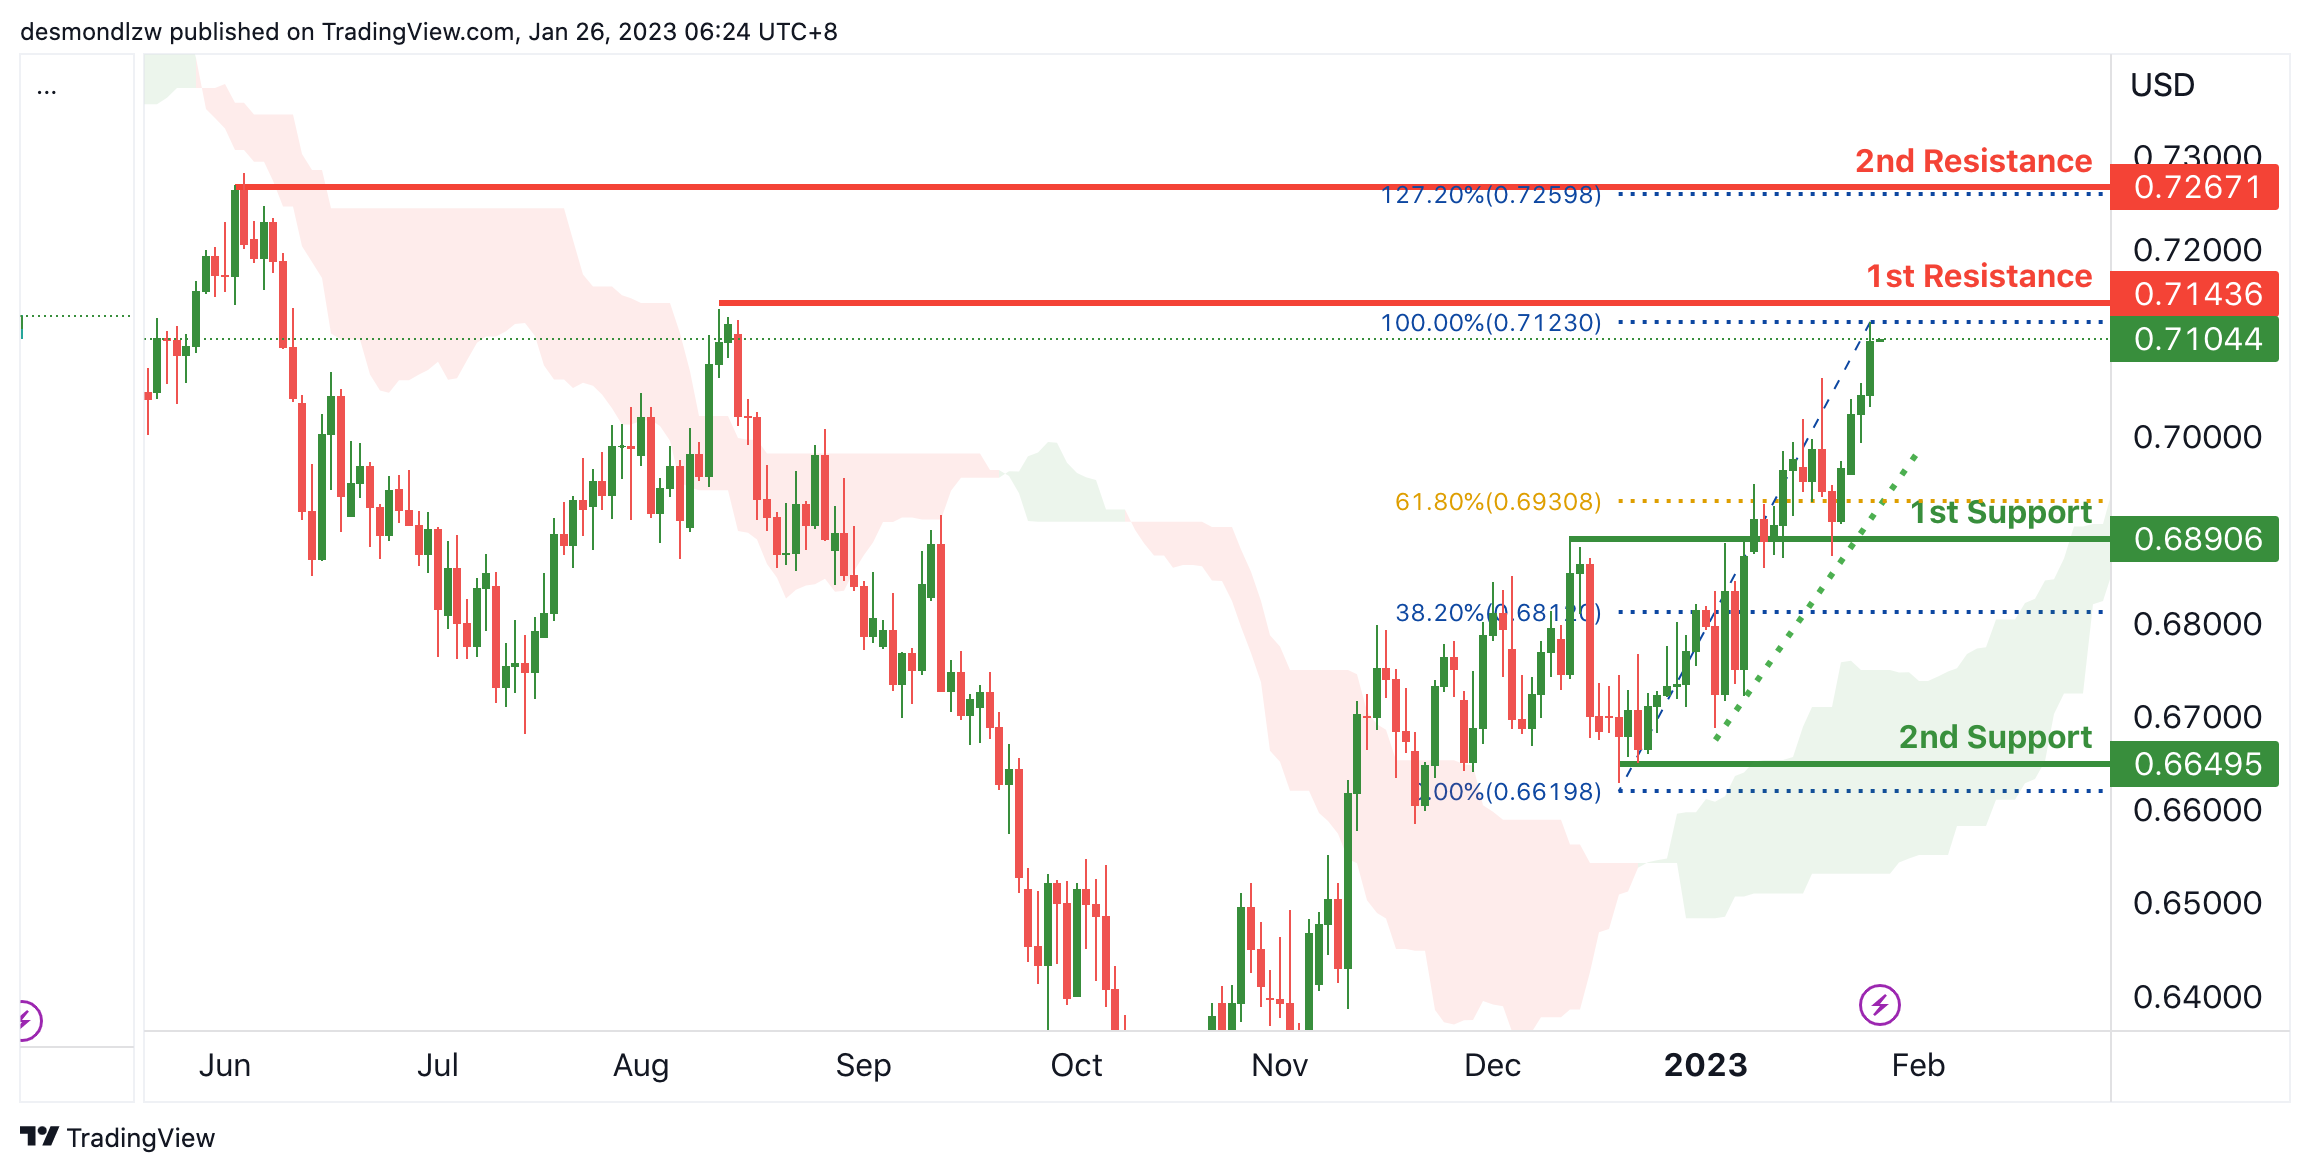
AUD/USD:
Looking at the H4 chart, we can see that the 1st support is at 0.68906 which is a recent swing low. As the price is above the Ichimoku cloud
Combined with the up trend line, suggests the bullish market.
In terms of resistance, the 1st resistance area is at 0.71436 which is the recent swing high. And the 2nd resistance is at 0.72671 which is in line with the 127% Fibonacci extension. Expecting the price will break the 1st resistance and take profit at intermediate resistance.
Areas of consideration
- H4 , 2nd resistance at 0.72671
- H4. 1st resistance at 0.71436
- H4, 1st support at 0.68906
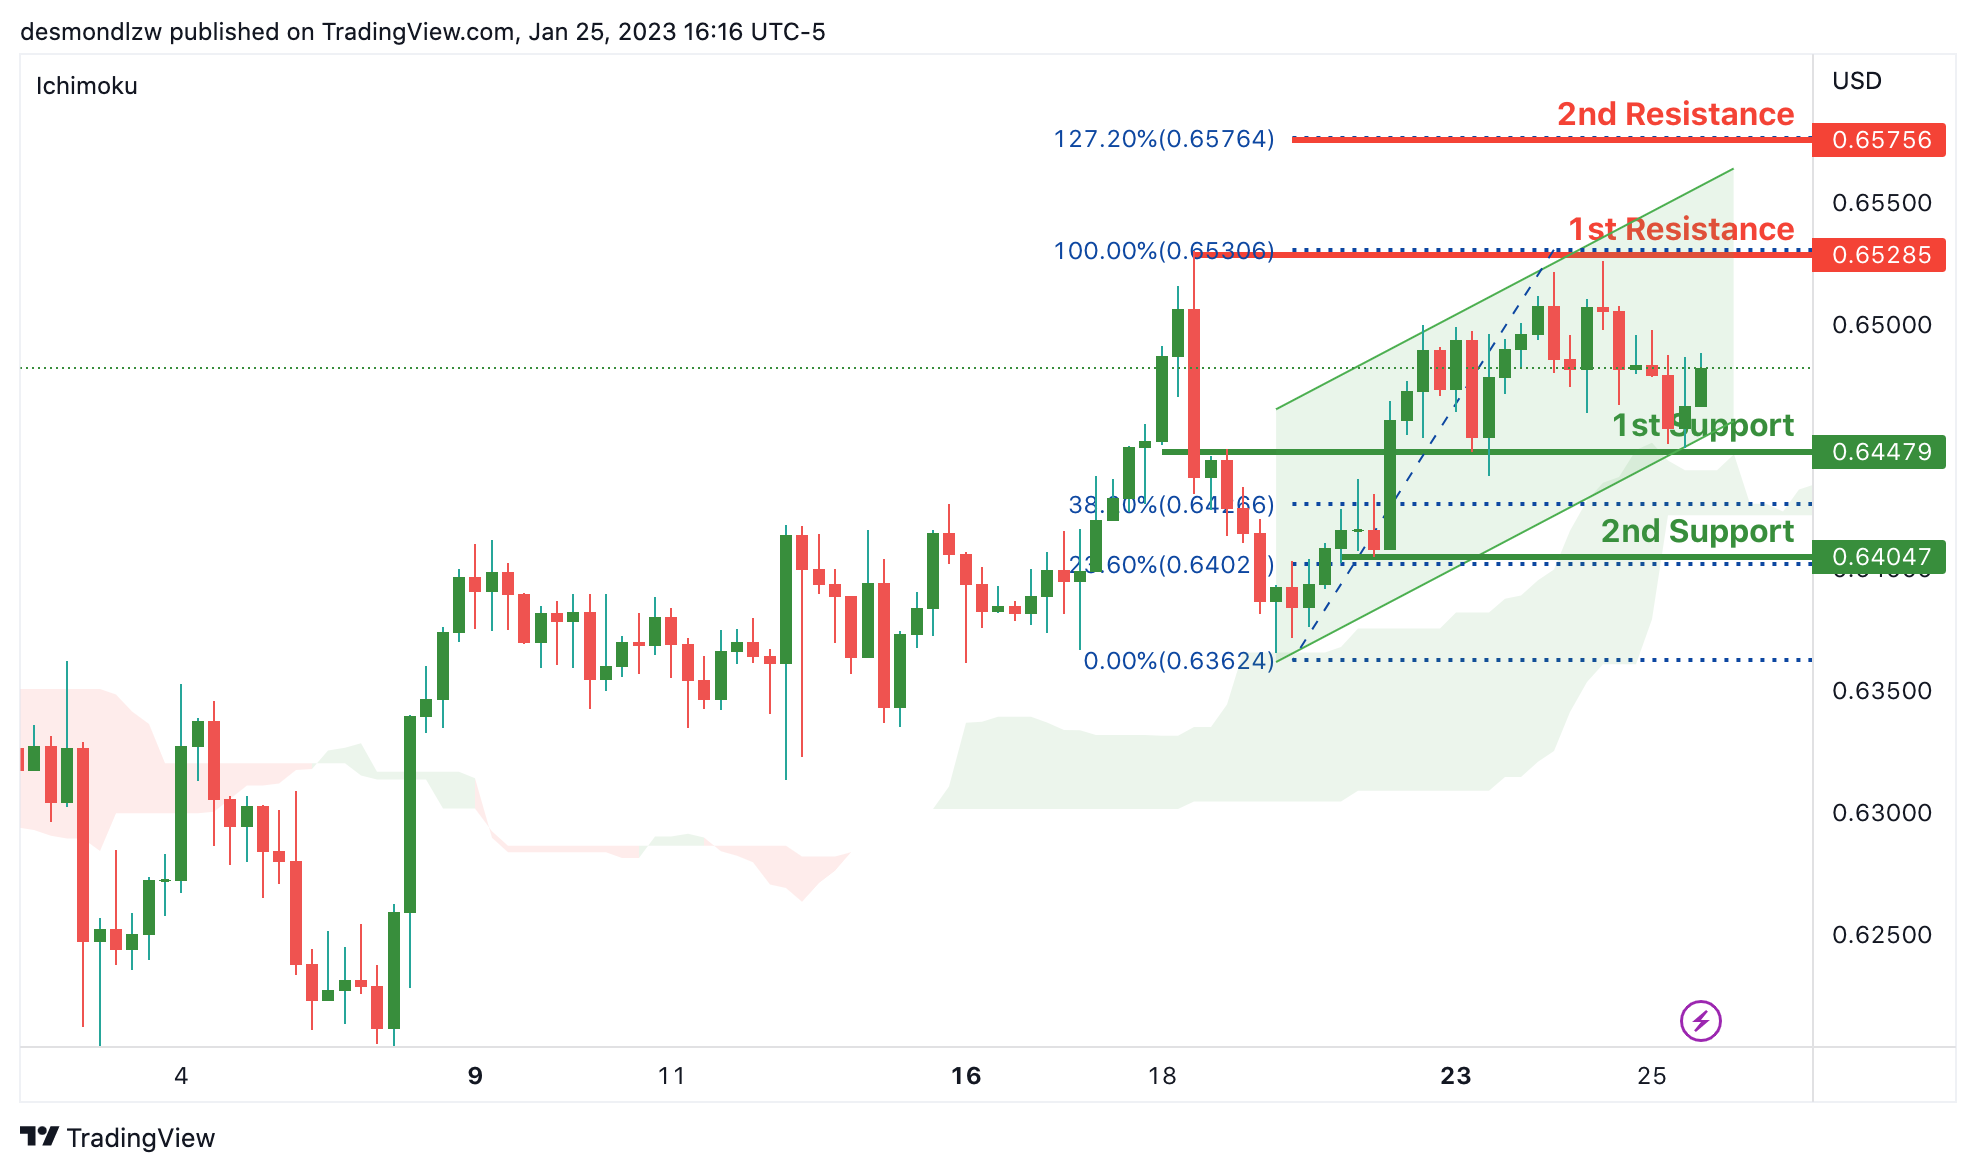
NZD/USD:
Looking at the H4 chart, we can see that the 1st support is at 0.64479 which is an overlap support. As the current price is above Ichimoku cloud, and there is an ascending channel, which indicates there is a bullish market. If this momentum continues, the price is expected to move to the 1st resistance at 0.65306 which is the recent swing high. And the 2nd resistance is 127% Fibonacci extension which is at 0.65756.
In alternative scenario, the price may drop break the 1st support level and drop to 2nd support at 0.64047
Areas of consideration:
- H4 time frame, 2nd resistance at 0.65756.
- H4 time frame, 1st resistance at 0.65306
- H4 time frame, 1st support at 0.64479
- H4 time frame, 2nd support at 0.64047
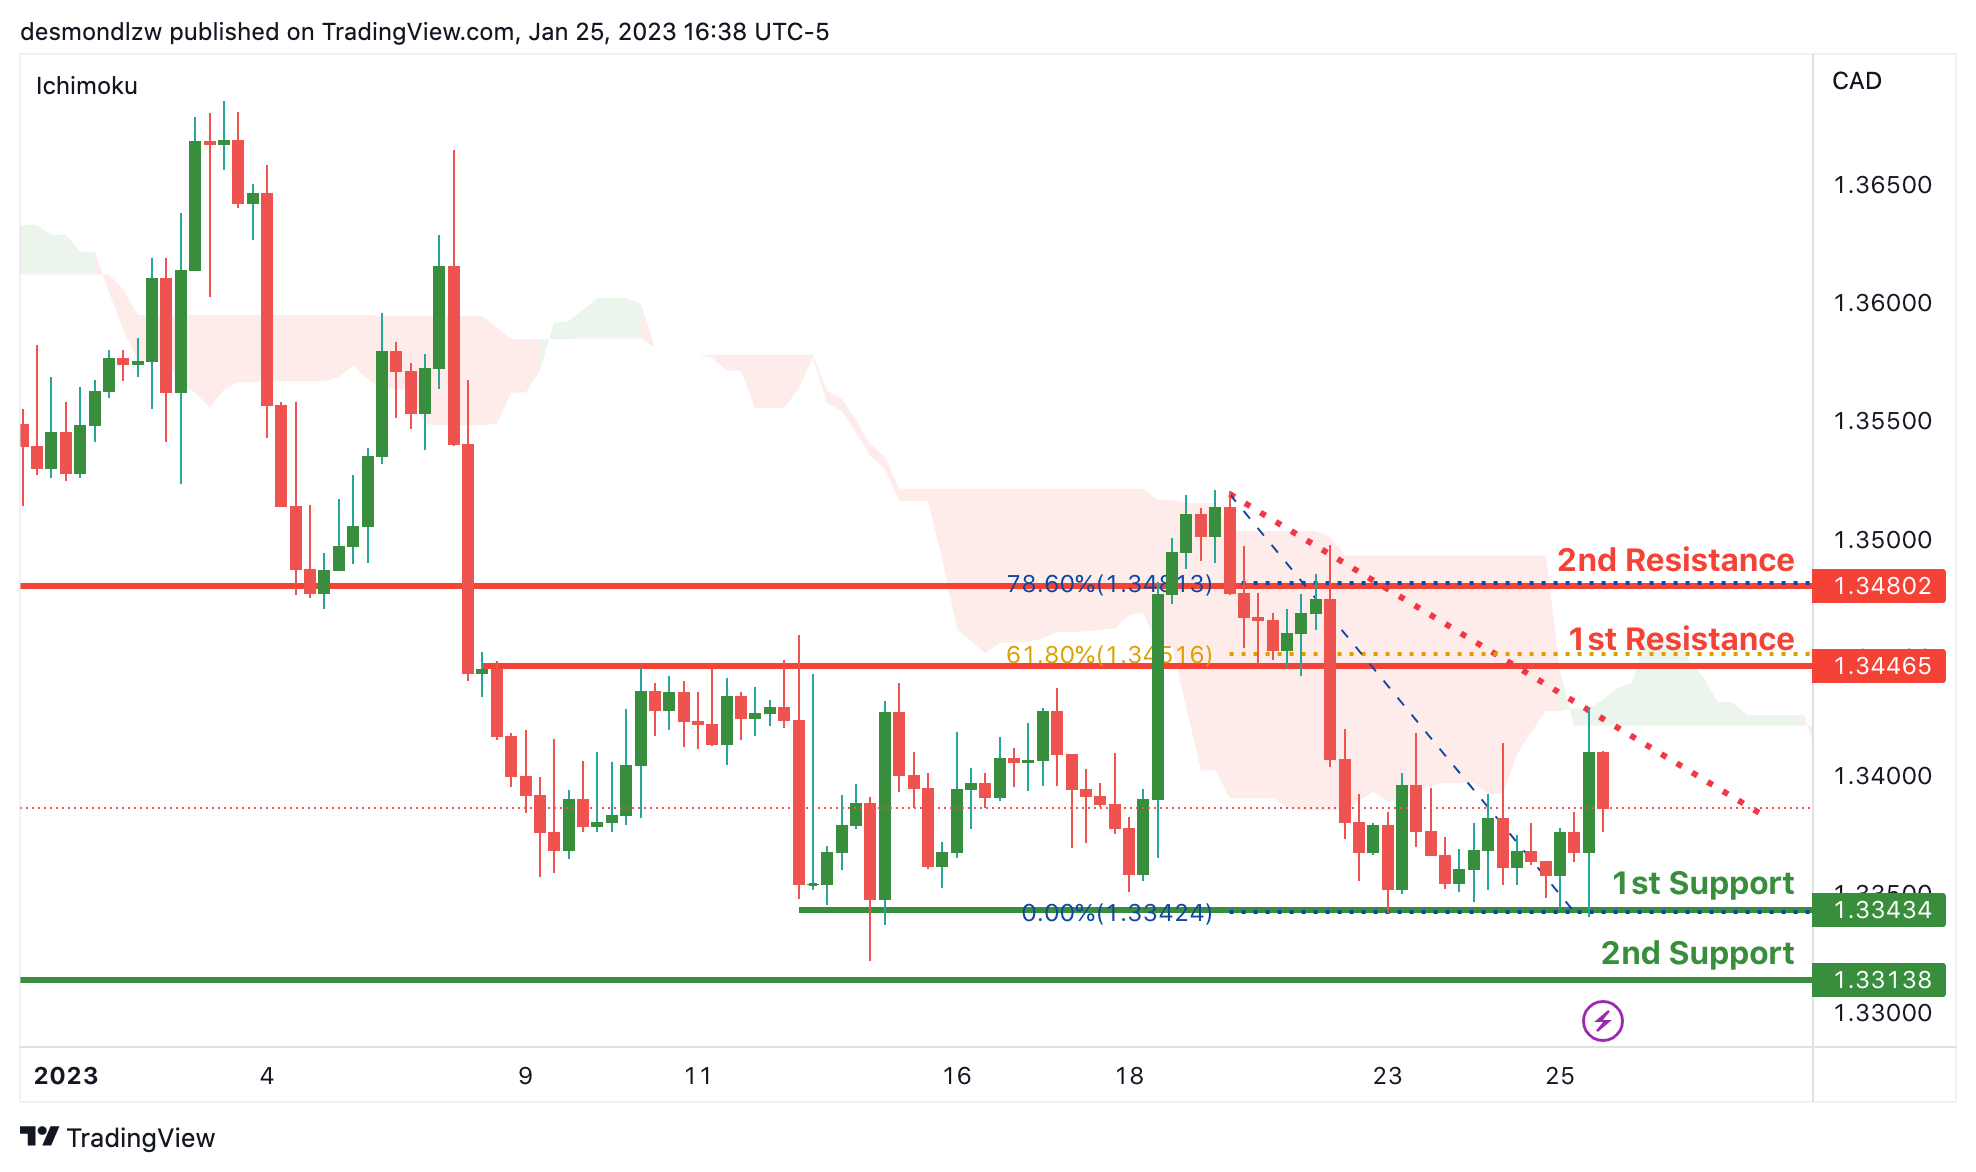
USD/CAD:
Looking at the H4 chart, my overall bias for USDCAD is bearish, due to the current price being below the Ichimoku cloud, and there is a descending trend line indicating a bullish market. If this bearish momentum continues, expect the price to possibly continue heading towards the 1st support at 1.33434 which is an overlap support and recent swing low. The price may further drop to the 2nd support at 1.33138.
In an alternative scenario, price could possibly head up to the 1st resistance at 1.34465 which is in line with 61.8% Fibonacci retracement. The 2nd resistance is at 1.34802 which is in line with 78.6% Fibonacci line.
Areas of consideration:
- H4 time frame, 2nd resistance 1.34802
- H4 time frame, 1st resistance at 1.34465
- H4 time frame, 1st support at 1.33434
- H4 time frame, 2nd support at 1.33138
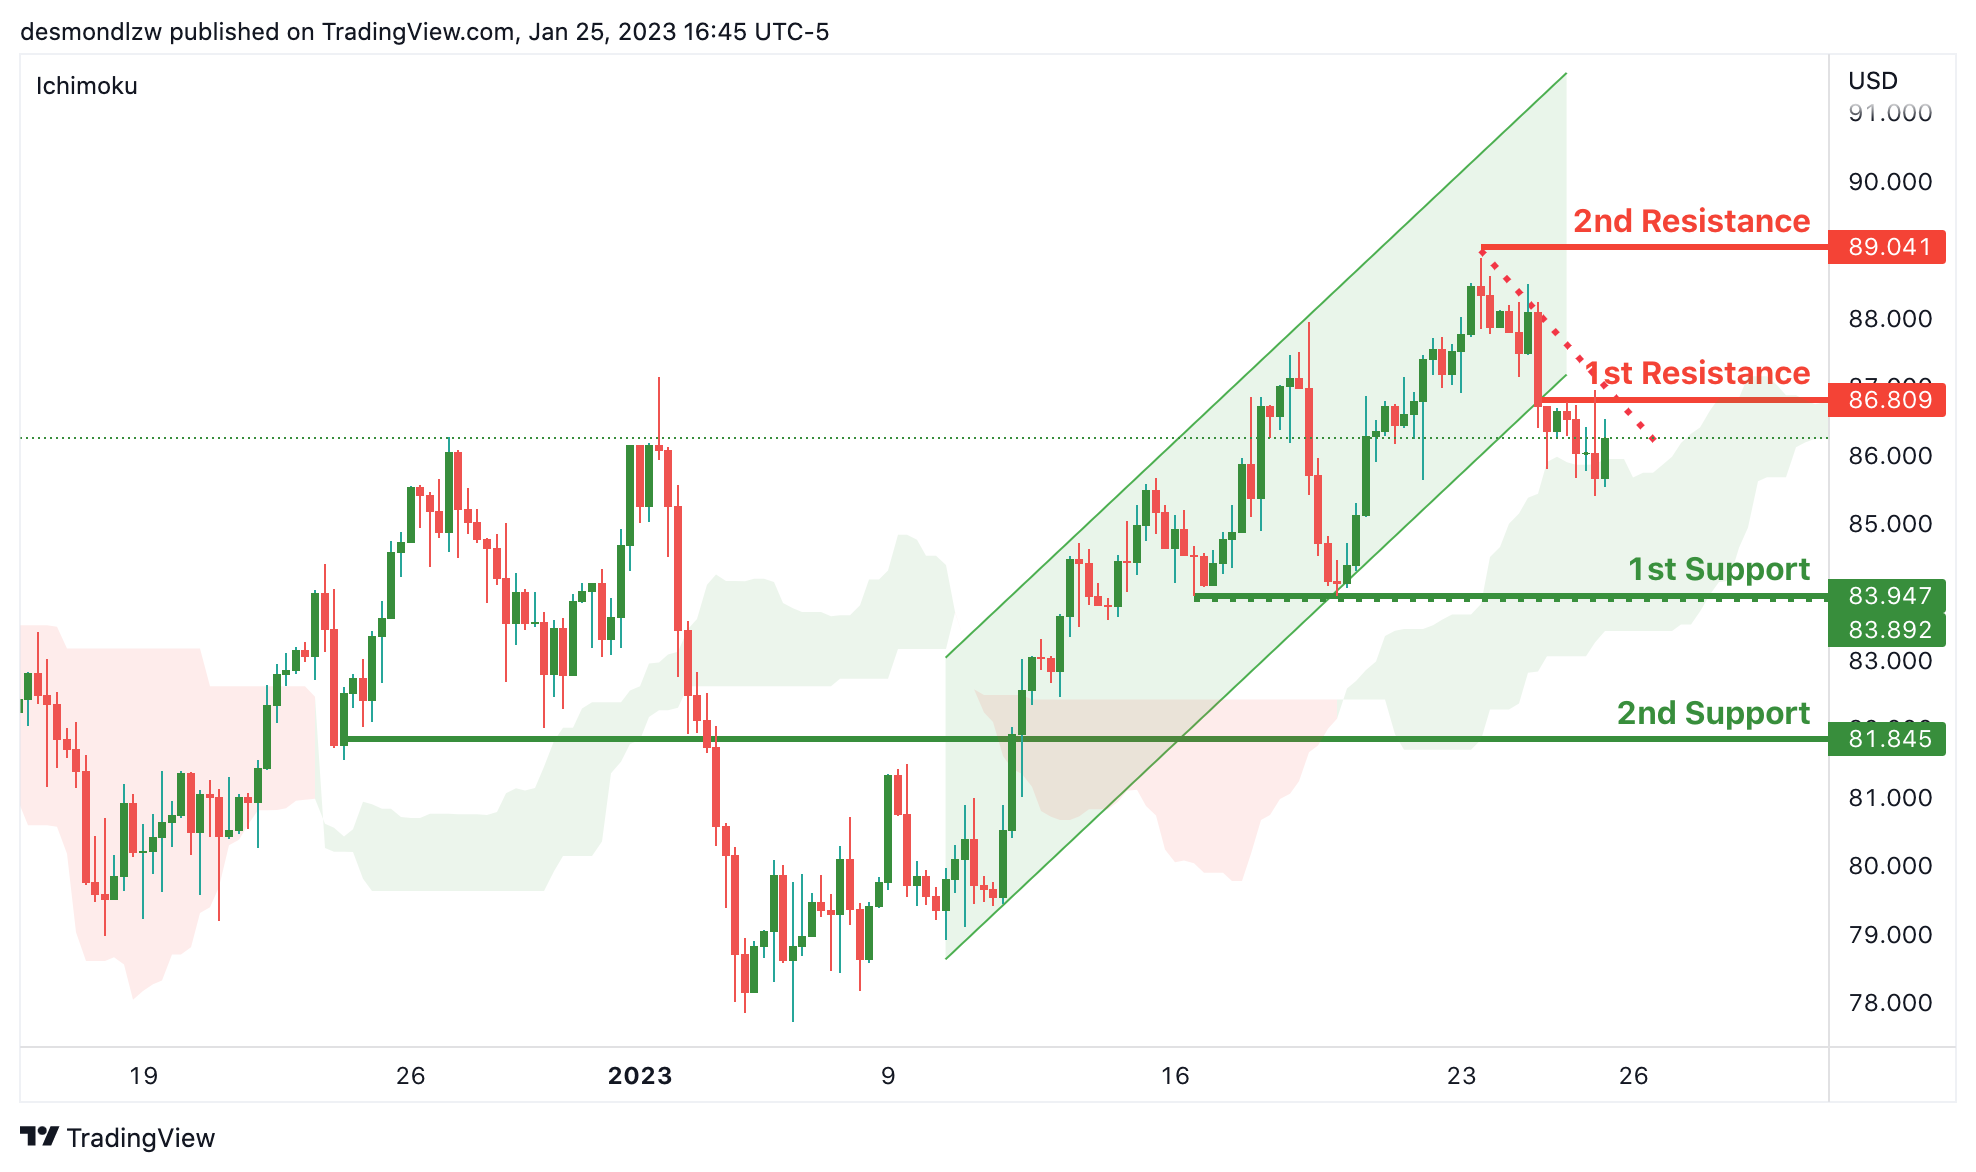
OIL:
Looking at the H4 chart, my overall bias for BOC is bearish, as the current ascending trend line has been broken and the price is moving within the Ichimoku cloud, a downside trend line has been created, suggesting there is bearish market. The price may drop to the 1st support at 83.947, if this bearish momentum continues, the price is expected to move down to the 2nd support at 81.845.
In terms of resistance, the 1st resistance is at 86.809 which is the recent swing high. 2nd resistance is at 89.041.
Areas of consideration:
- H4 time frame, 2nd resistance at 89.041
- H4 time frame, 1st resistance at 86.809
- H4 time frame,1st support at 83.947,
- Hr time frame, 2nd support at 81.845
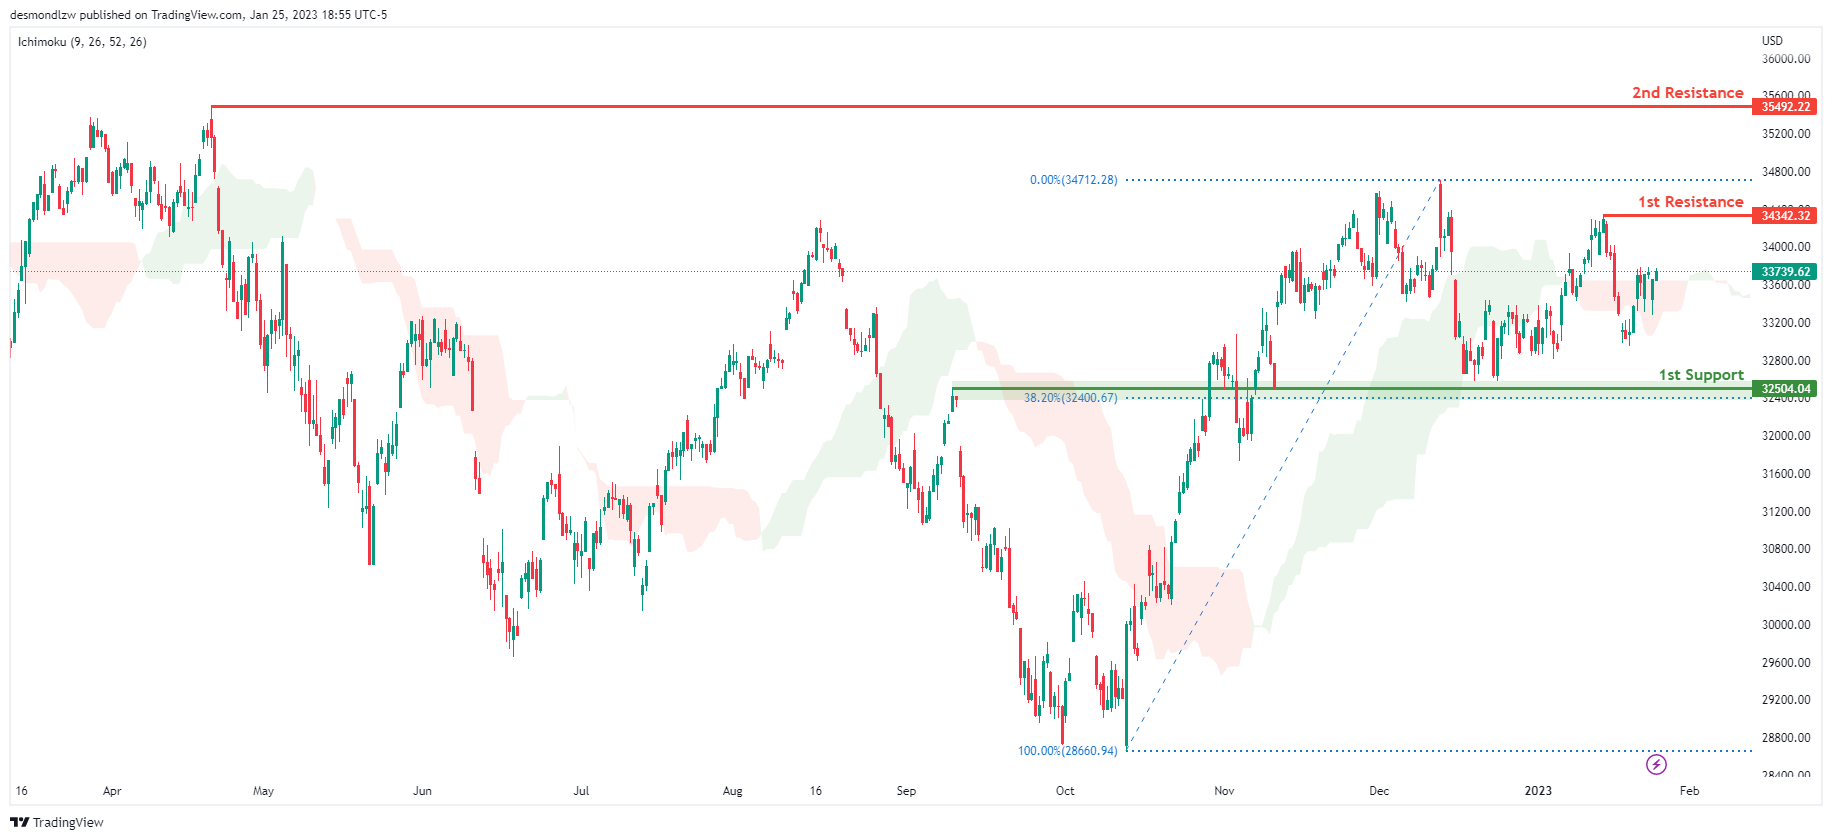
Dow Jones Industrial Average:
On the H4 chart, the overall bias for DJI is bullish. To add confluence to this, the price is crossing above the Ichimoku cloud which indicates a bullish market. If this bullish momentum continues, expect the price to possibly continue heading towards the 1st resistance line at 34342.32, where the recent swing high is. In an alternative scenario, price could possibly head back down towards the 1st support at 32581.97, slightly above where the 38.2% Fibonacci line is.
Areas of consideration:
- H4 time frame, 1st support at 32581.97
- H4 time frame, 1st Resistance at 34342.32
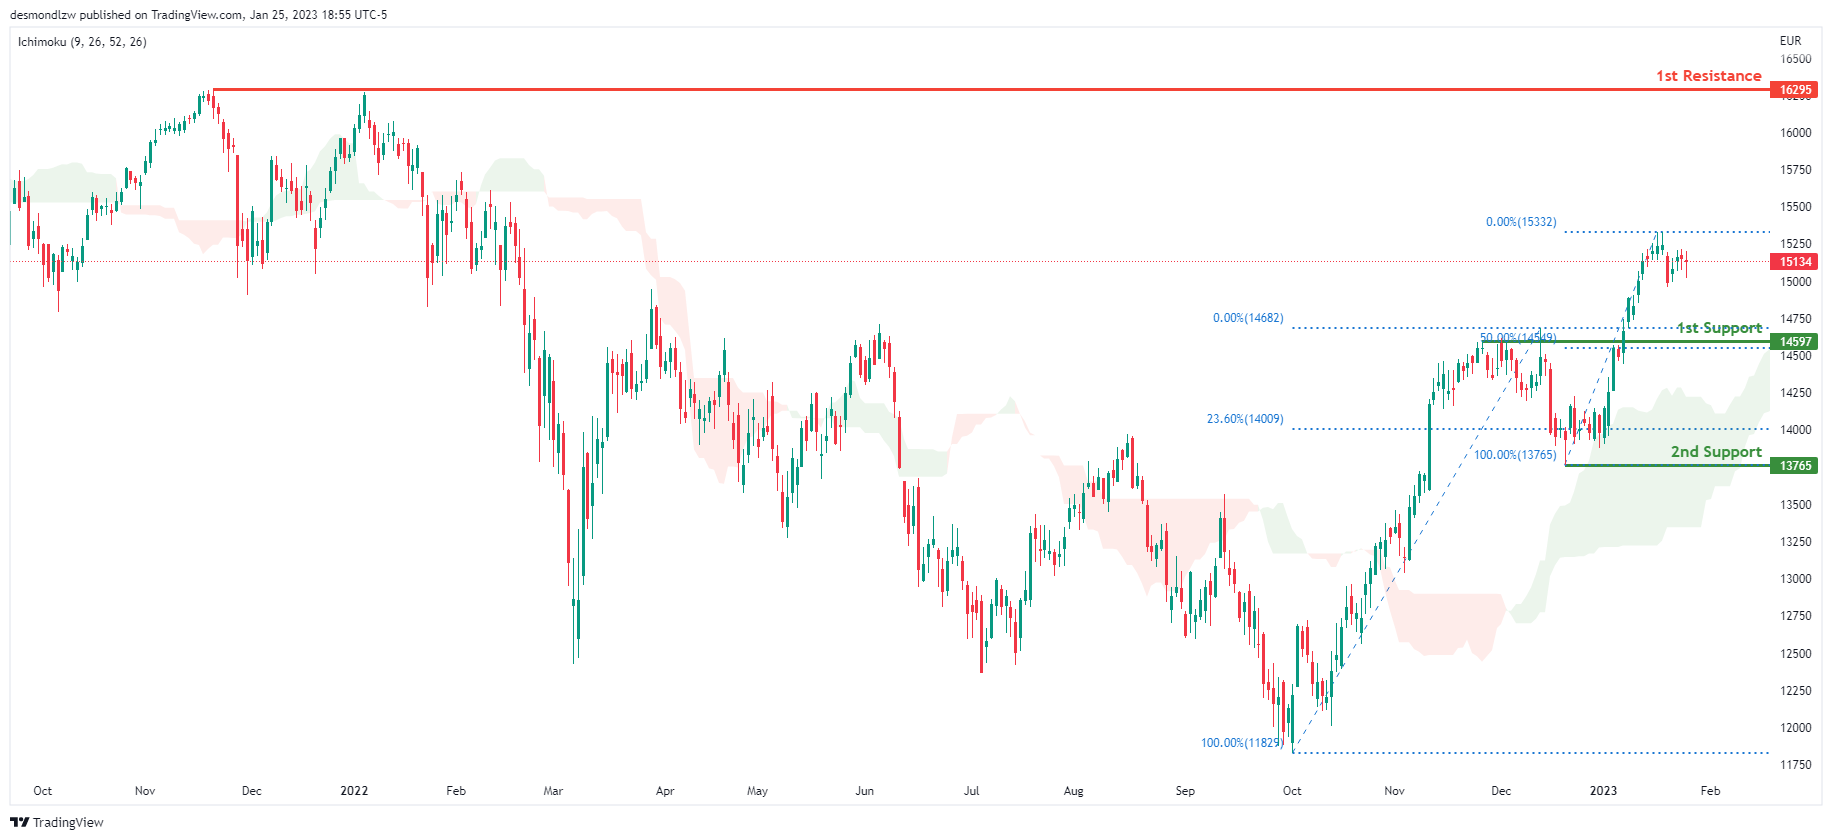
DAX:
Looking at the Daily chart, my overall bias for DAX is bullish due to the current price crossing above the Ichimoku cloud, indicating a bullish market. If this bullish momentum continues, expect the price to possibly head towards the 1st resistance line at 16295, where the previous swing high is. In an alternative scenario, price could possibly head down to retest the 1st support at 14597, where the 50% Fibonacci line is.
Areas of consideration:
- H4 time frame, 1st resistance is at 16295
- H4 time frame, 1st support is at 14597
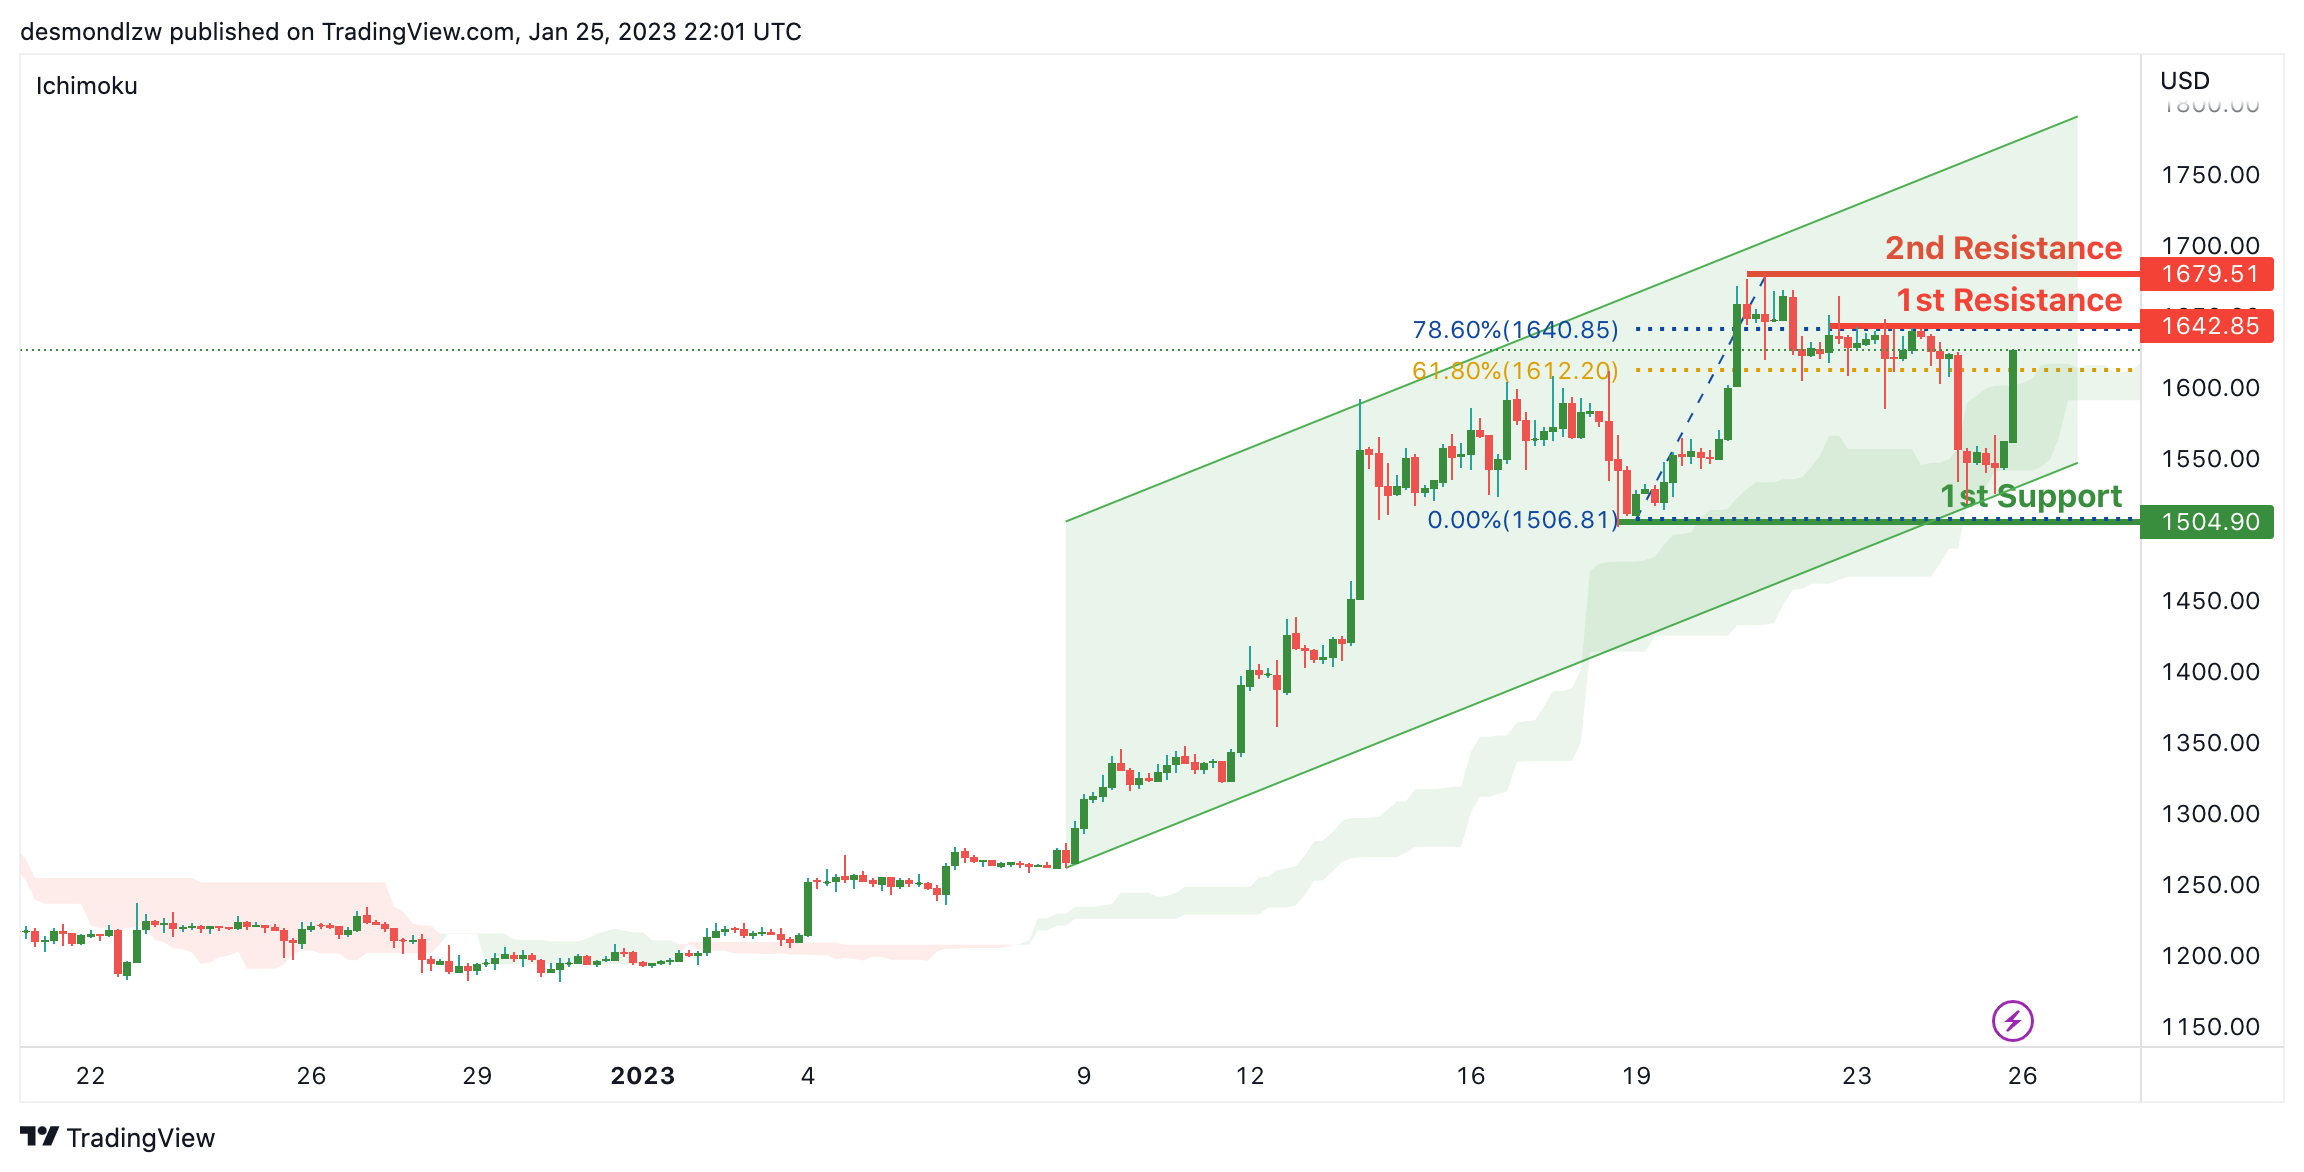
ETHUSD:
Looking at the H4 chart, my overall bias for ETHUSD is bullish, as the current price is above the Ichimoku cloud and an ascending trend line has been created. The price may move up to the 1st resistance at 1642.85 which is an overlap resistance and in line with 61.8% Fibonacci retracement. If the bullish momentum continues, the price may rise to the 2nd resistance at 1679.51 which is the recent6 swing high.
In an alternative scenario, the price may down to the 1st support at 1506.81 which is the recent swing low.
Areas of consideration:
- H4 time frame, 2nd resistance 1679.51
- H4 time frame, 1st resistance of 1642.85
- H4 time frame, 1st support at 1506.81
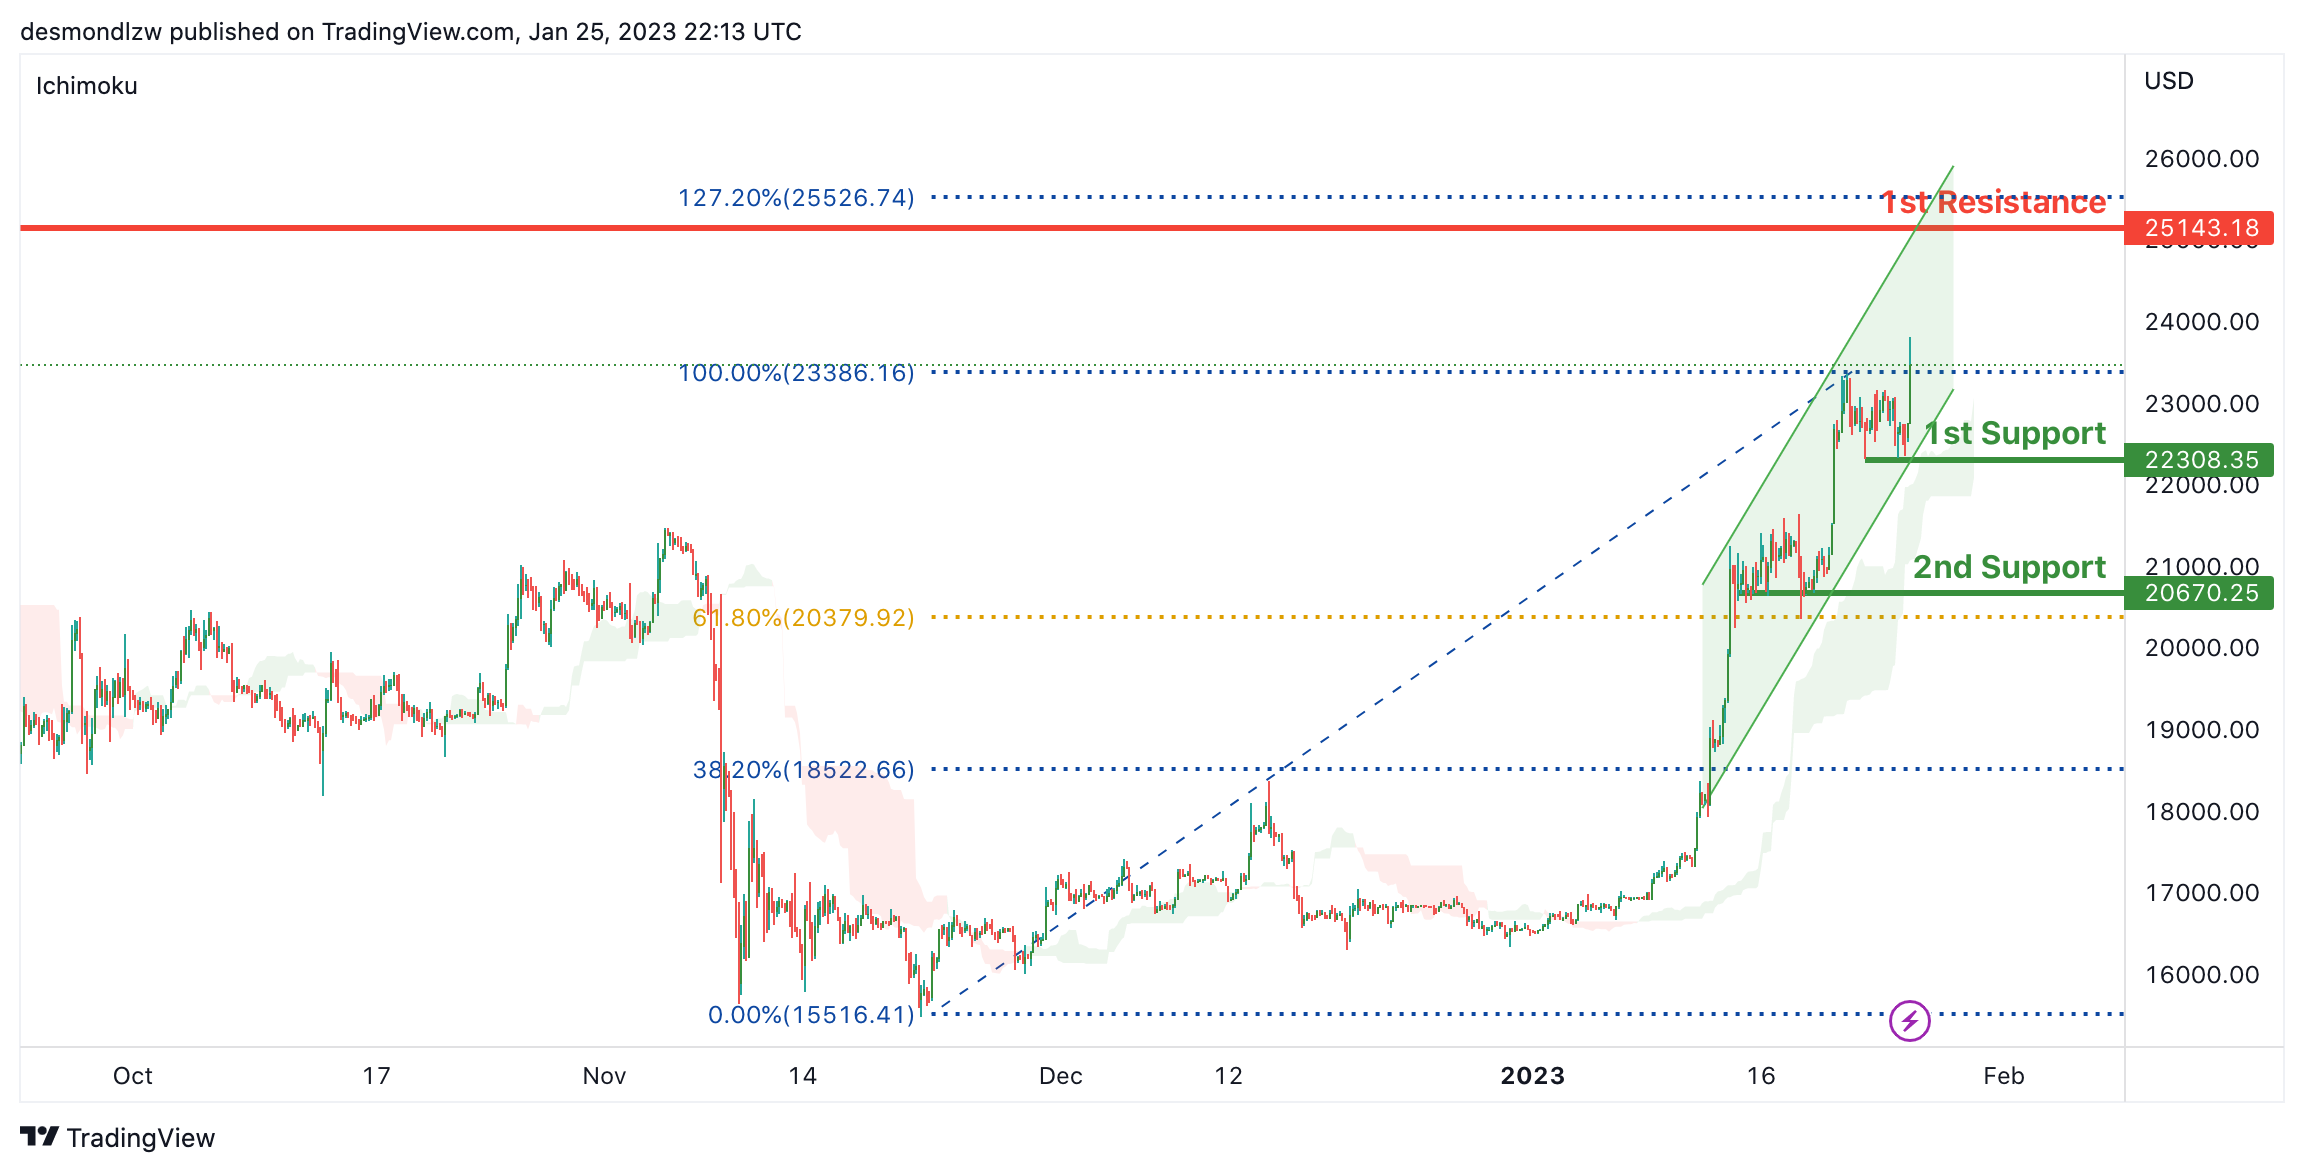
BTCUSD:
Looking at the H4 chart, my overall bias for BTCUSD is bullish due to the current price being above the Ichimoku cloud, and there is an ascending channel, indicating a bullish market. If this bullish momentum continues, expect the price to possibly rise to the 1st resistance at 25143.18 which is the recent swing high and also in line with 127% Fibonacci projection.
In an alternative scenario, the price could possibly head back down to retest at the 1st support at 22308.35. 2nd support is at 20670.25which is in line with 61.8% Fibonacci line
Areas of consideration:
- H4 time frame, 1st resistance 25143.18
- H4 time frame, 1st support at 22308.35
- H4 time frame, 1st support a 20670.25
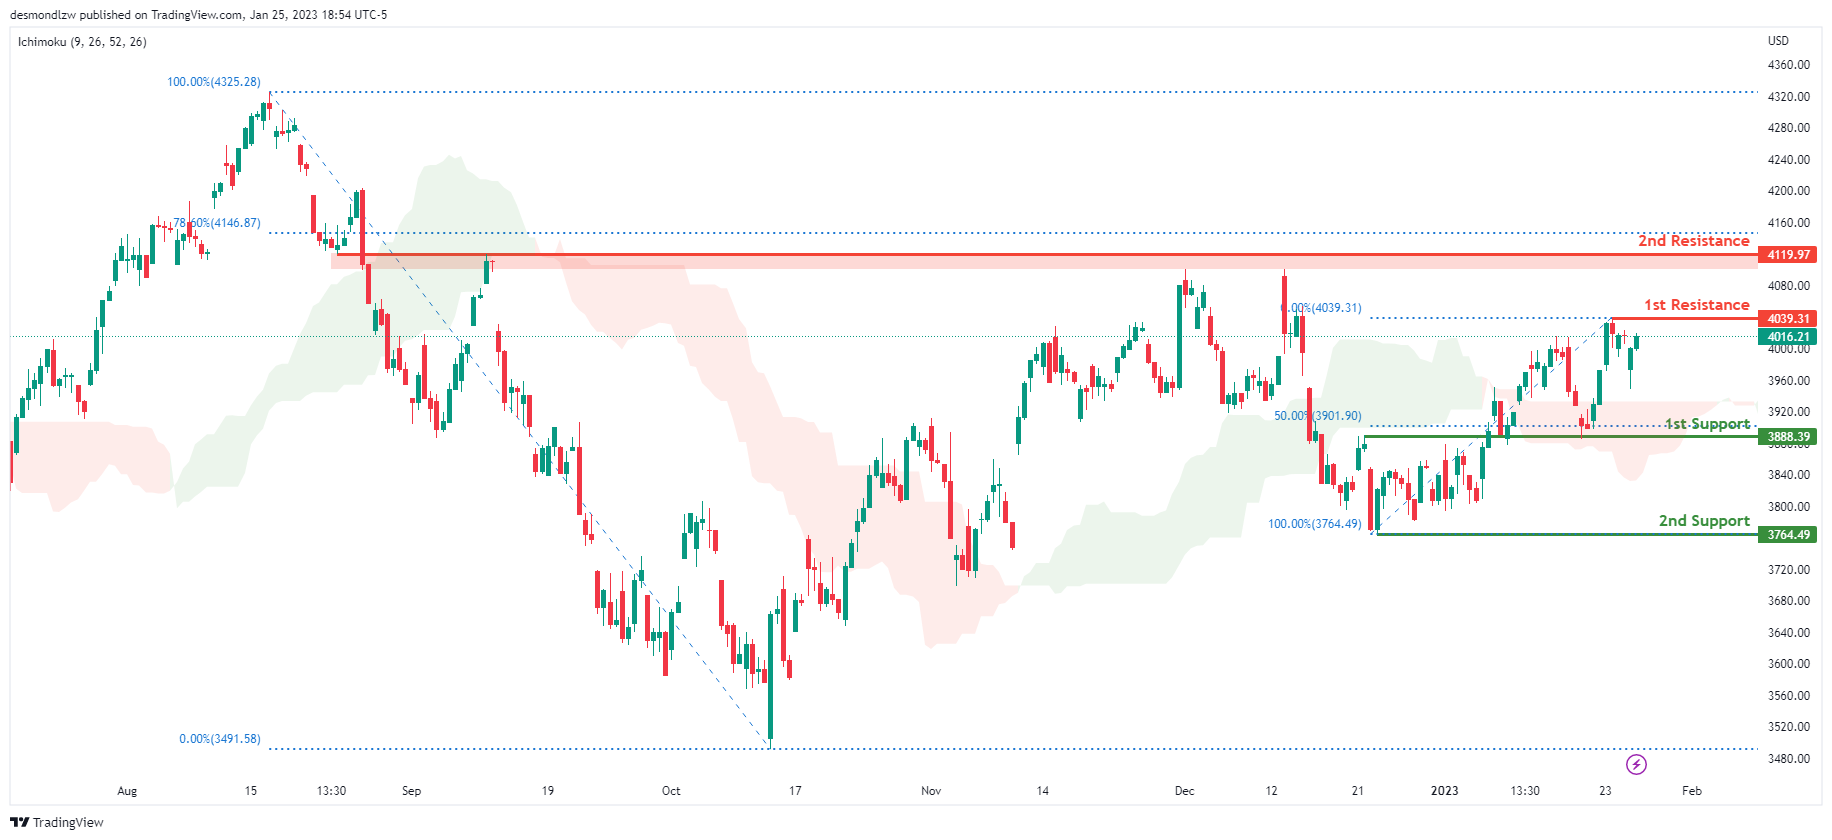
S&P 500:
Looking at the H4 chart, my overall bias for S&P500 is bullish due to the current price being above the Ichimoku cloud, indicating a bullish market. If this bullish momentum continues, expect the price to continue heading towards the 1st resistance at 4039.31, where the recent high is. In an alternative scenario, price could possibly head back down to break the 1st support at 3888.39, where the 50% Fibonacci line is, before heading towards the 2nd support at 3764.49, where the recent swing low is.
Areas of consideration:
- H4 time frame, 1st support at 3888.39
- H4 time frame, 2nd support at 3764.49
- H4 time frame, 1st resistance at 4039.31


