
Information is not investment advice
The Backstory
The first FOMC meeting comes after a buildup of anticipation from traders and investors alike, as the markets await what posture the Fed will take regarding the interest rates; would there be a hike or a cut in interest rates? Recall that the Federal Open Market Committee had previously ended the year 2022 with a 50bps hike, and an indication from Powell, the committee chairman, that the Fed could consider raising interest rates by 75bps in the course of the year 2023.
How does this affect the Forex market?
The interest rates provide insights into the strength of the US Dollar, which helps traders and investors manage their expectations from the currency. Increased rates often lead to increased strength for the Dollar.
What do the charts have to say?
In light of the fundamental breakdown above, we will draw our conclusions from the outlook of price on the charts using price action.
US Dollar – Daily Timeframe
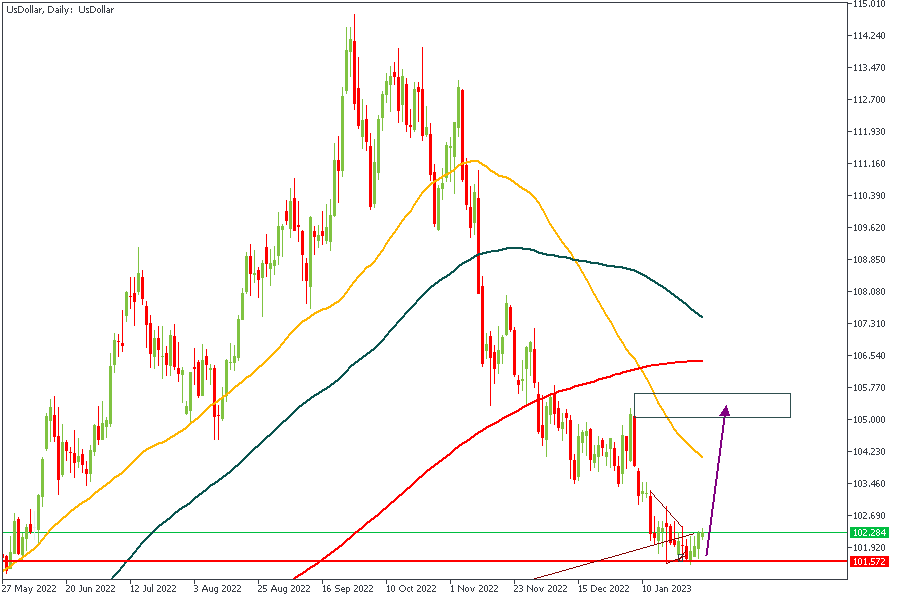
The US Dollar on the Daily timeframe has made an initial reaction off the Daily Pivot as predicted in my previous articles. The reaction seems to have even broken above a miniature trendline resistance, giving us further confidence in the possibility of a bullish price action toward the 50-Day Moving Average as the very least target.
Analyst’s Expectations:
- Direction: Bullish
- Target: 104
- Invalidation: 101.7
EURUSD – Daily Timeframe
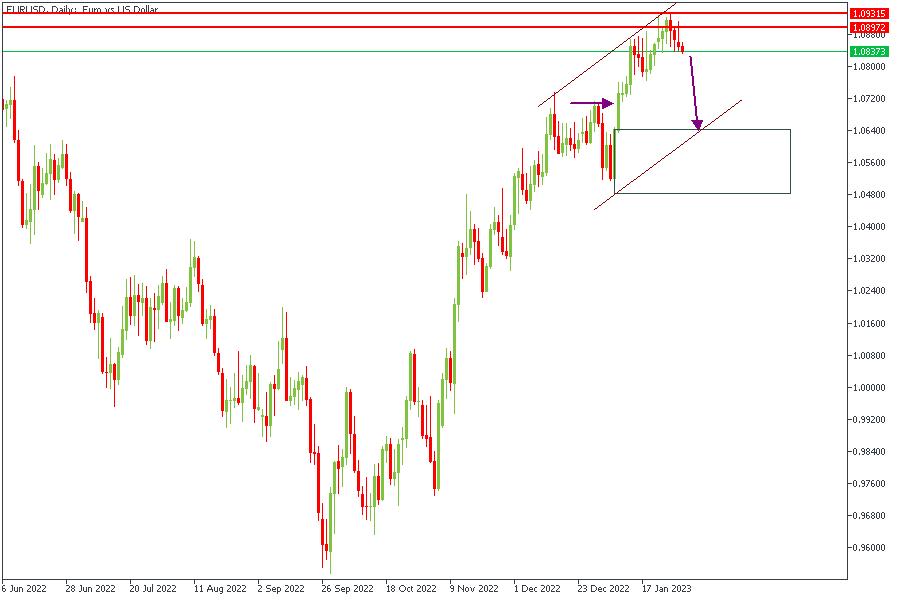
EURUSD has already begun the reaction from the daily pivot and the trendline resistance. As far as I can see, however, price seems to be heading towards the demand zone as marked since it was the “order block” right before price broke the previous high with a bullish FVG (Fair Value Gap).
Analysts’ Expectation:
- Direction: Bearish
- Target: 1.06500
- Invalidation: 1.09201
GBPUSD- Daily Timeframe
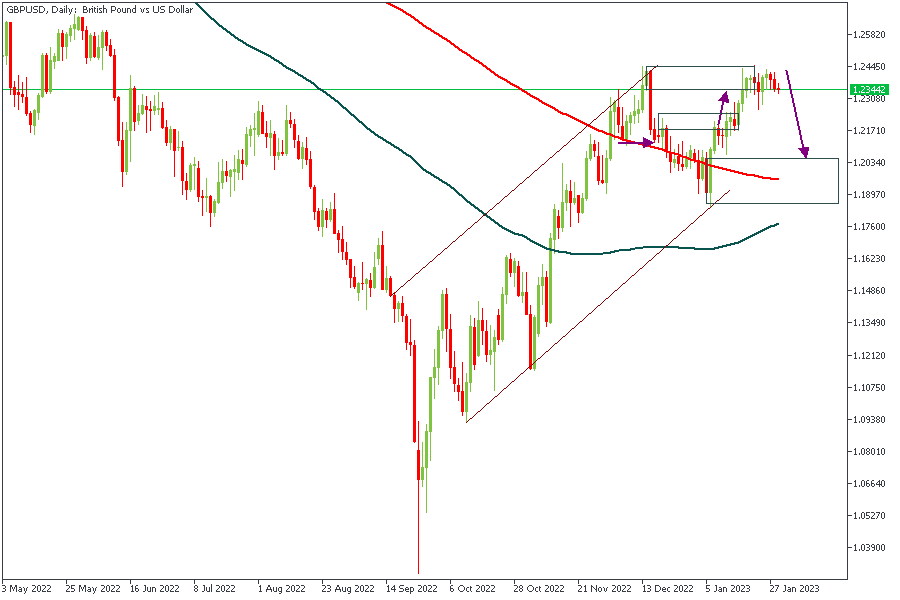
The chart above shows the price action on the daily timeframe of the GBPUSD pair, and similar to what we saw on the EURUSD daily chart, price here is also reacting from an area of resistance. The major clause here, however, is that the reaction is a tad more sluggish than I would have loved to see. The 200-Day moving average could be the next target in view as I expect price to seek out a strong area of support in order to continue its bullish march.
Analyst’s Expectations:
- Direction: Bearish
- Target: 1.20624
- Invalidation: 1.24539
XAUUSD – Daily Timeframe
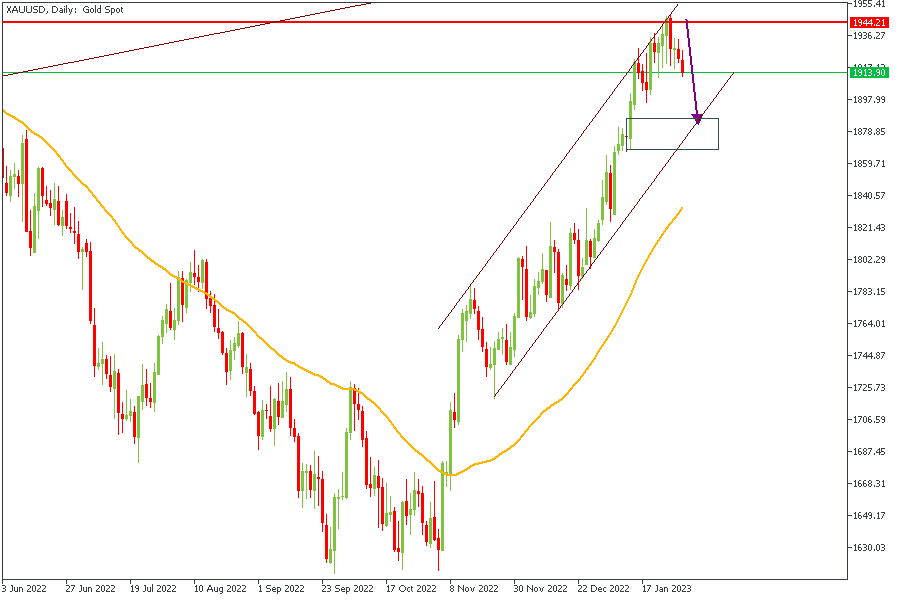
From the Daily pivot zone, XAUUSD has played out a 300-pip bearish reaction. The point of the reaction aligned perfectly with the trendline resistance of the rising channel, indicating the likelihood that price bounces off the trendline support of the same channel to continue its bullish rally… possibly.
Analyst’s Expectations:
- Direction: Bearish
- Target: 1887.8
- Invalidation: 1945
APPLE – Daily Timeframe
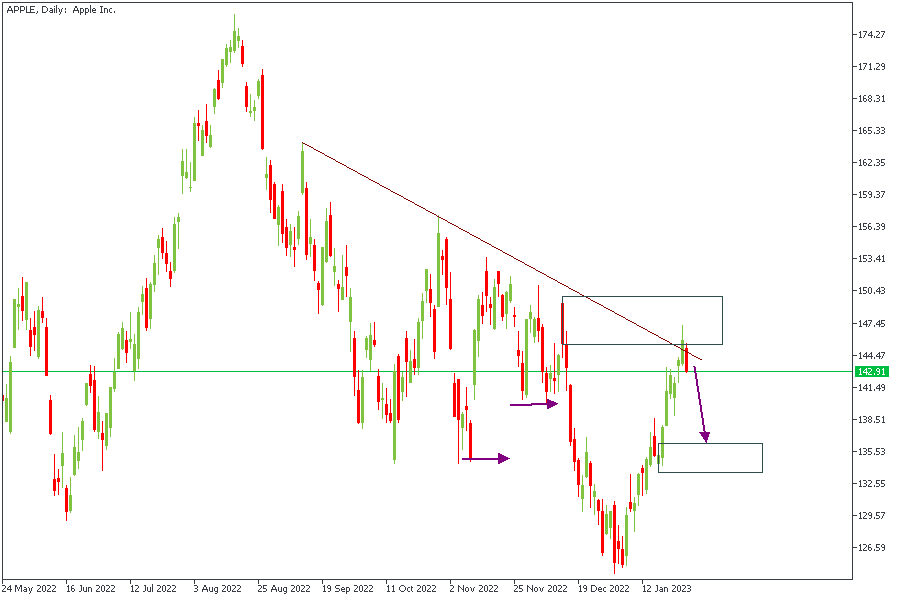
After the bearish break of structure, APPLE stock returned to the rally-base-drop supply zone that prompted the break of structure in the first place. On returning to the supply zone for a retest, price encountered the trendline resistance and was kicked down from that area of confluence. This leads me to expect a brief continuation of that bearish movement to the demand zone I marked below as the primary target.
Analyst’s Expectations:
- Direction: Bearish
- Target: $137
- Invalidation: $148
Important
The trading of CFDs comes at a risk. Thus, to succeed, you have to manage risks properly. To avoid costly mistakes while you look to trade these opportunities, be sure to do your due diligence and manage your risk appropriately.


