
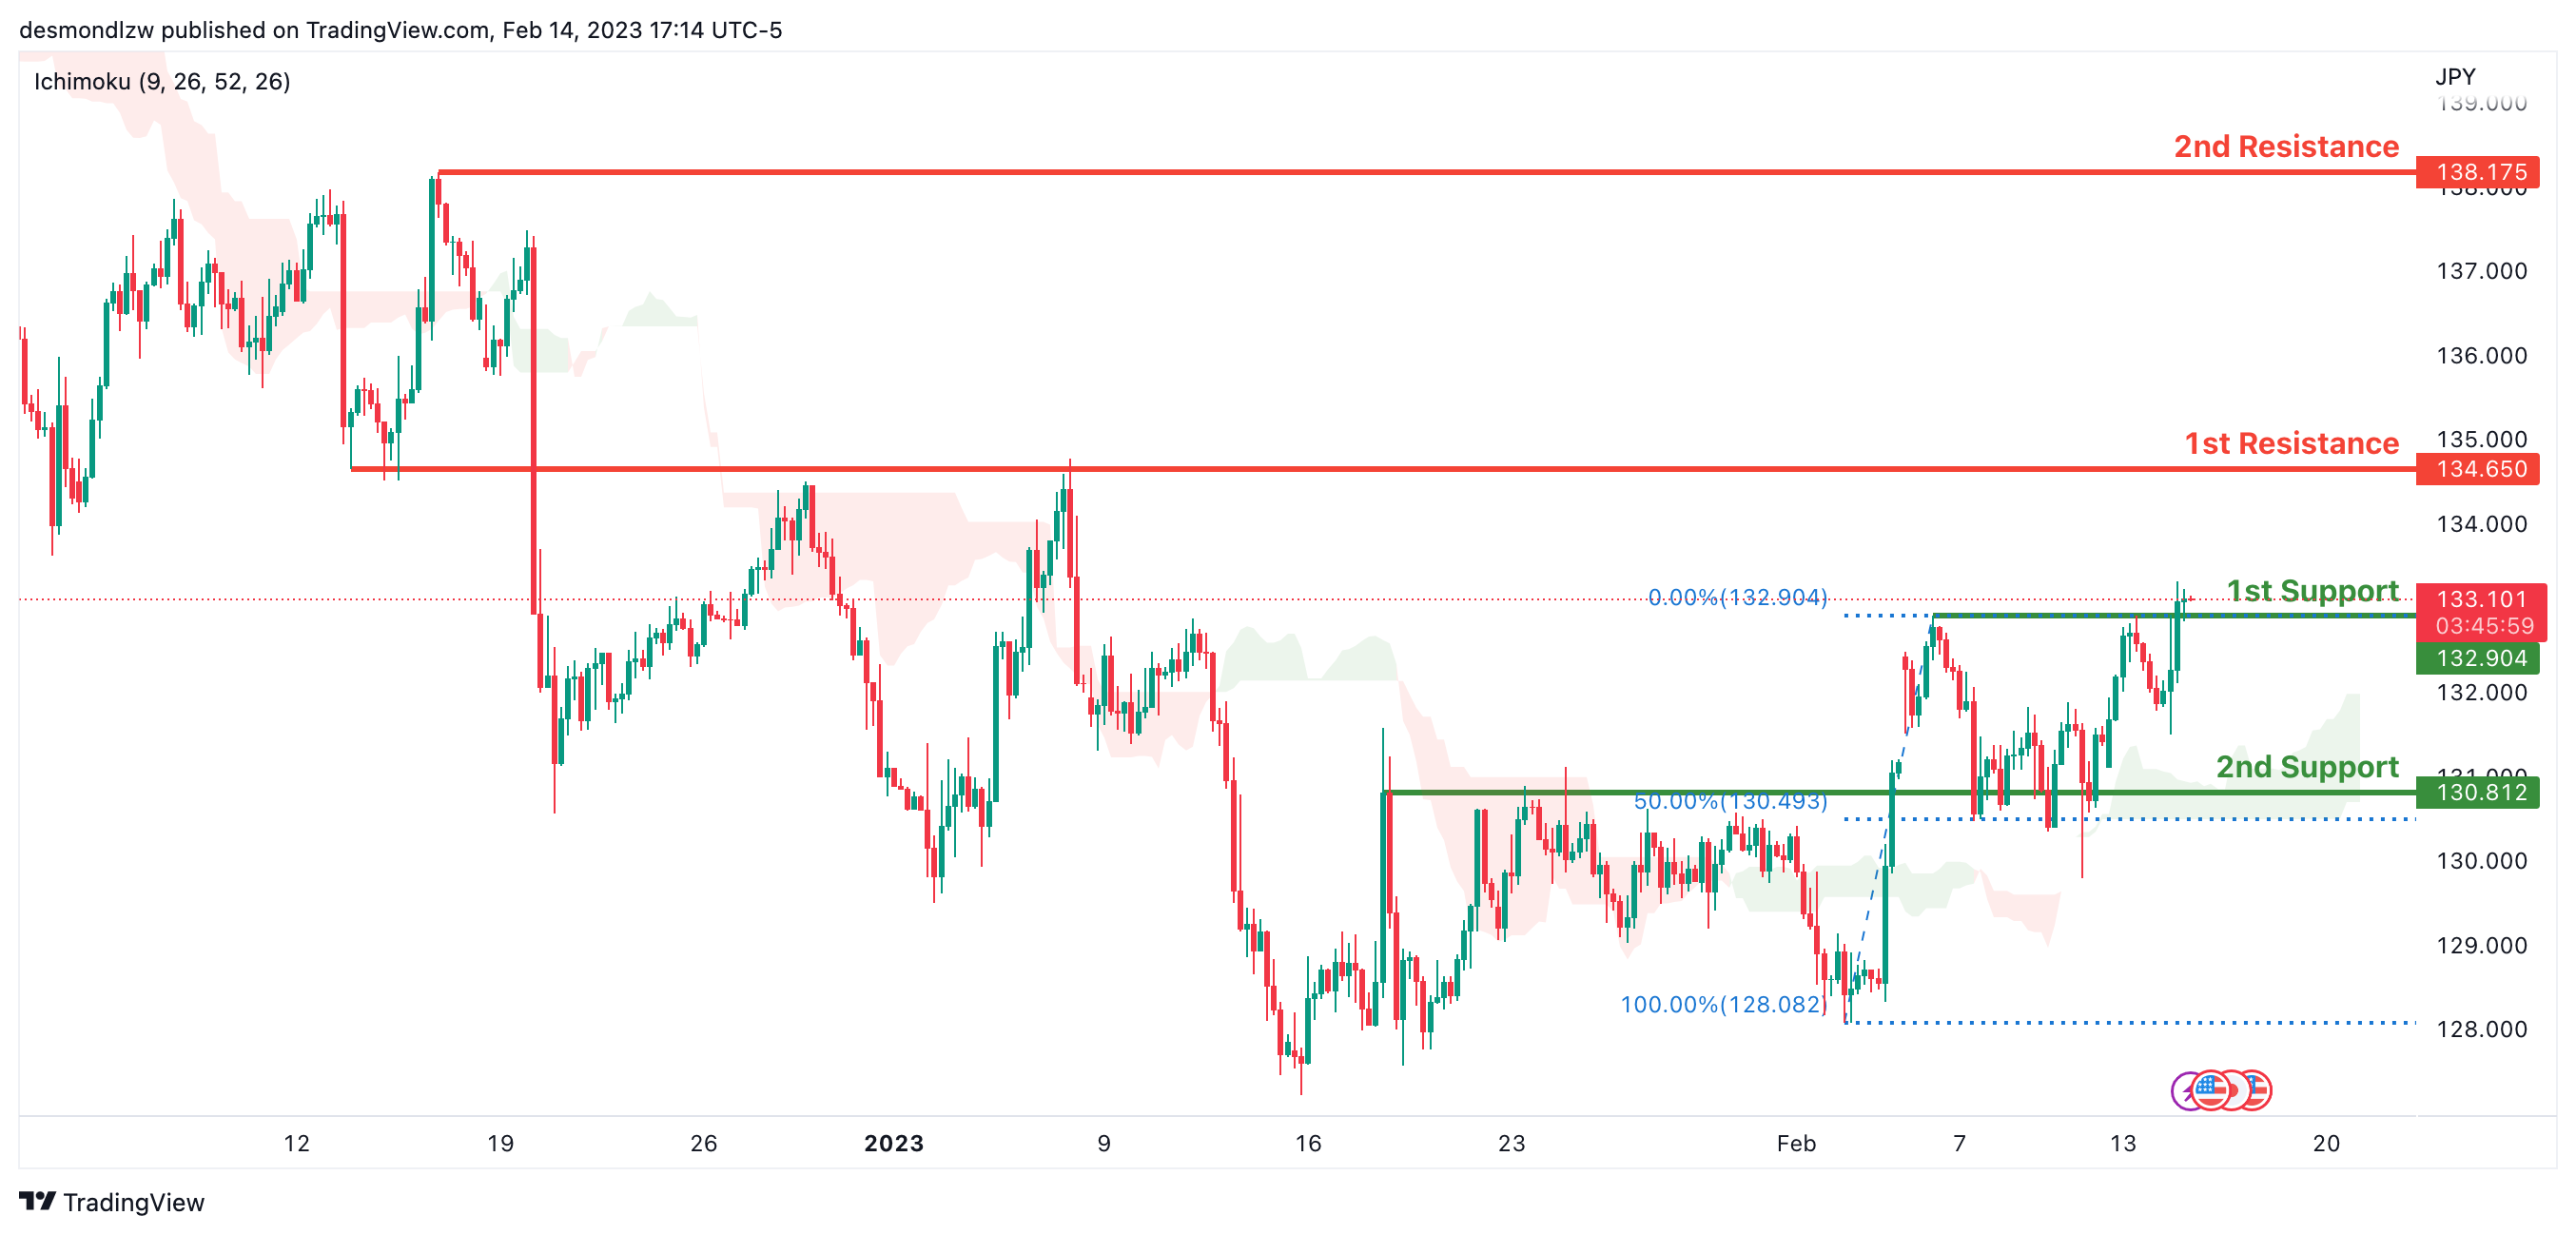
USD/JPY:
Looking at the H4 chart, my overall bias for USDJPY is bullish due to the current price crossing above the Ichimoku cloud, indicating a bullish market. If this bullish momentum continues, expect the price to possibly continue heading towards the 1st resistance at 134.650, where the overlap resistance is. In an alternate scenario, price could possibly head back down to retest the 1st support at 132.904, where the overlap support is.
Areas of consideration:
- H4 time frame, 1st resistance at 134.650
- H4 time frame, 1st support at 132.904
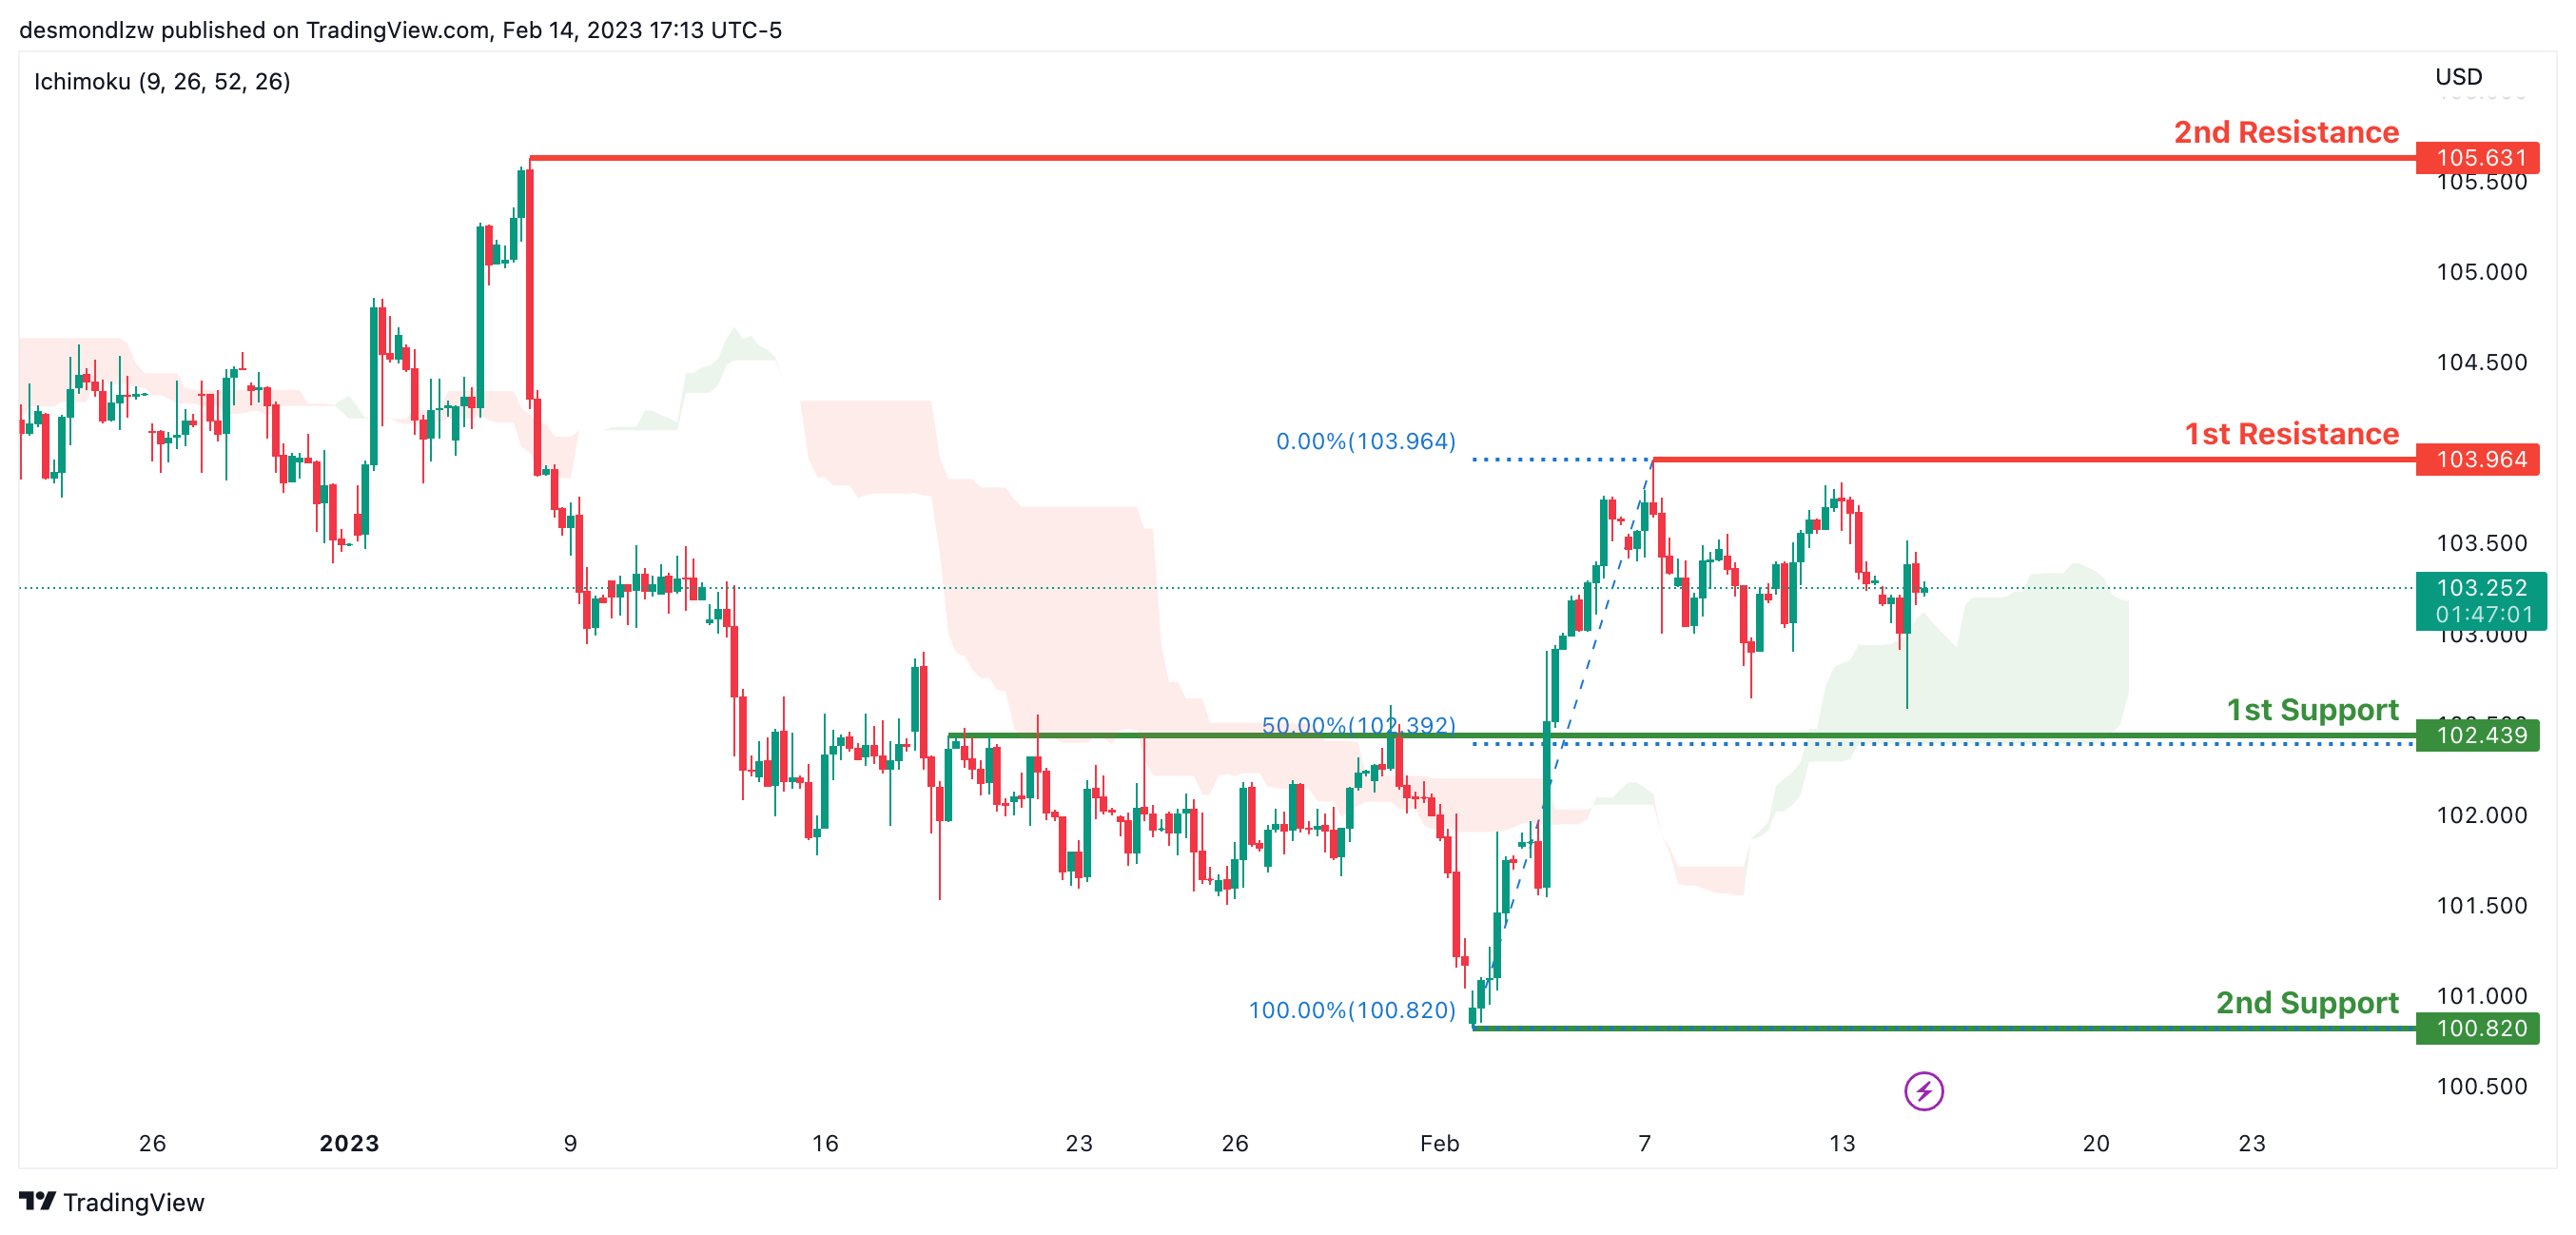
DXY:
Looking at the H4 chart, my overall bias for DXY is bullish due to the current price crossing above the Ichimoku cloud, indicating a bullish market. If this bullish momentum continues, expect the price to possibly continue heading towards the 1st resistance at 103.964, where the previous swing high is. In an alternative scenario, price could head back down to retest the 1st support at 102.439, where the 50% Fibonacci line and overlap support is.
Areas of consideration:
- H4 time frame, 1st resistance at 103.964
- H4 time frame, 1st support at 99.241
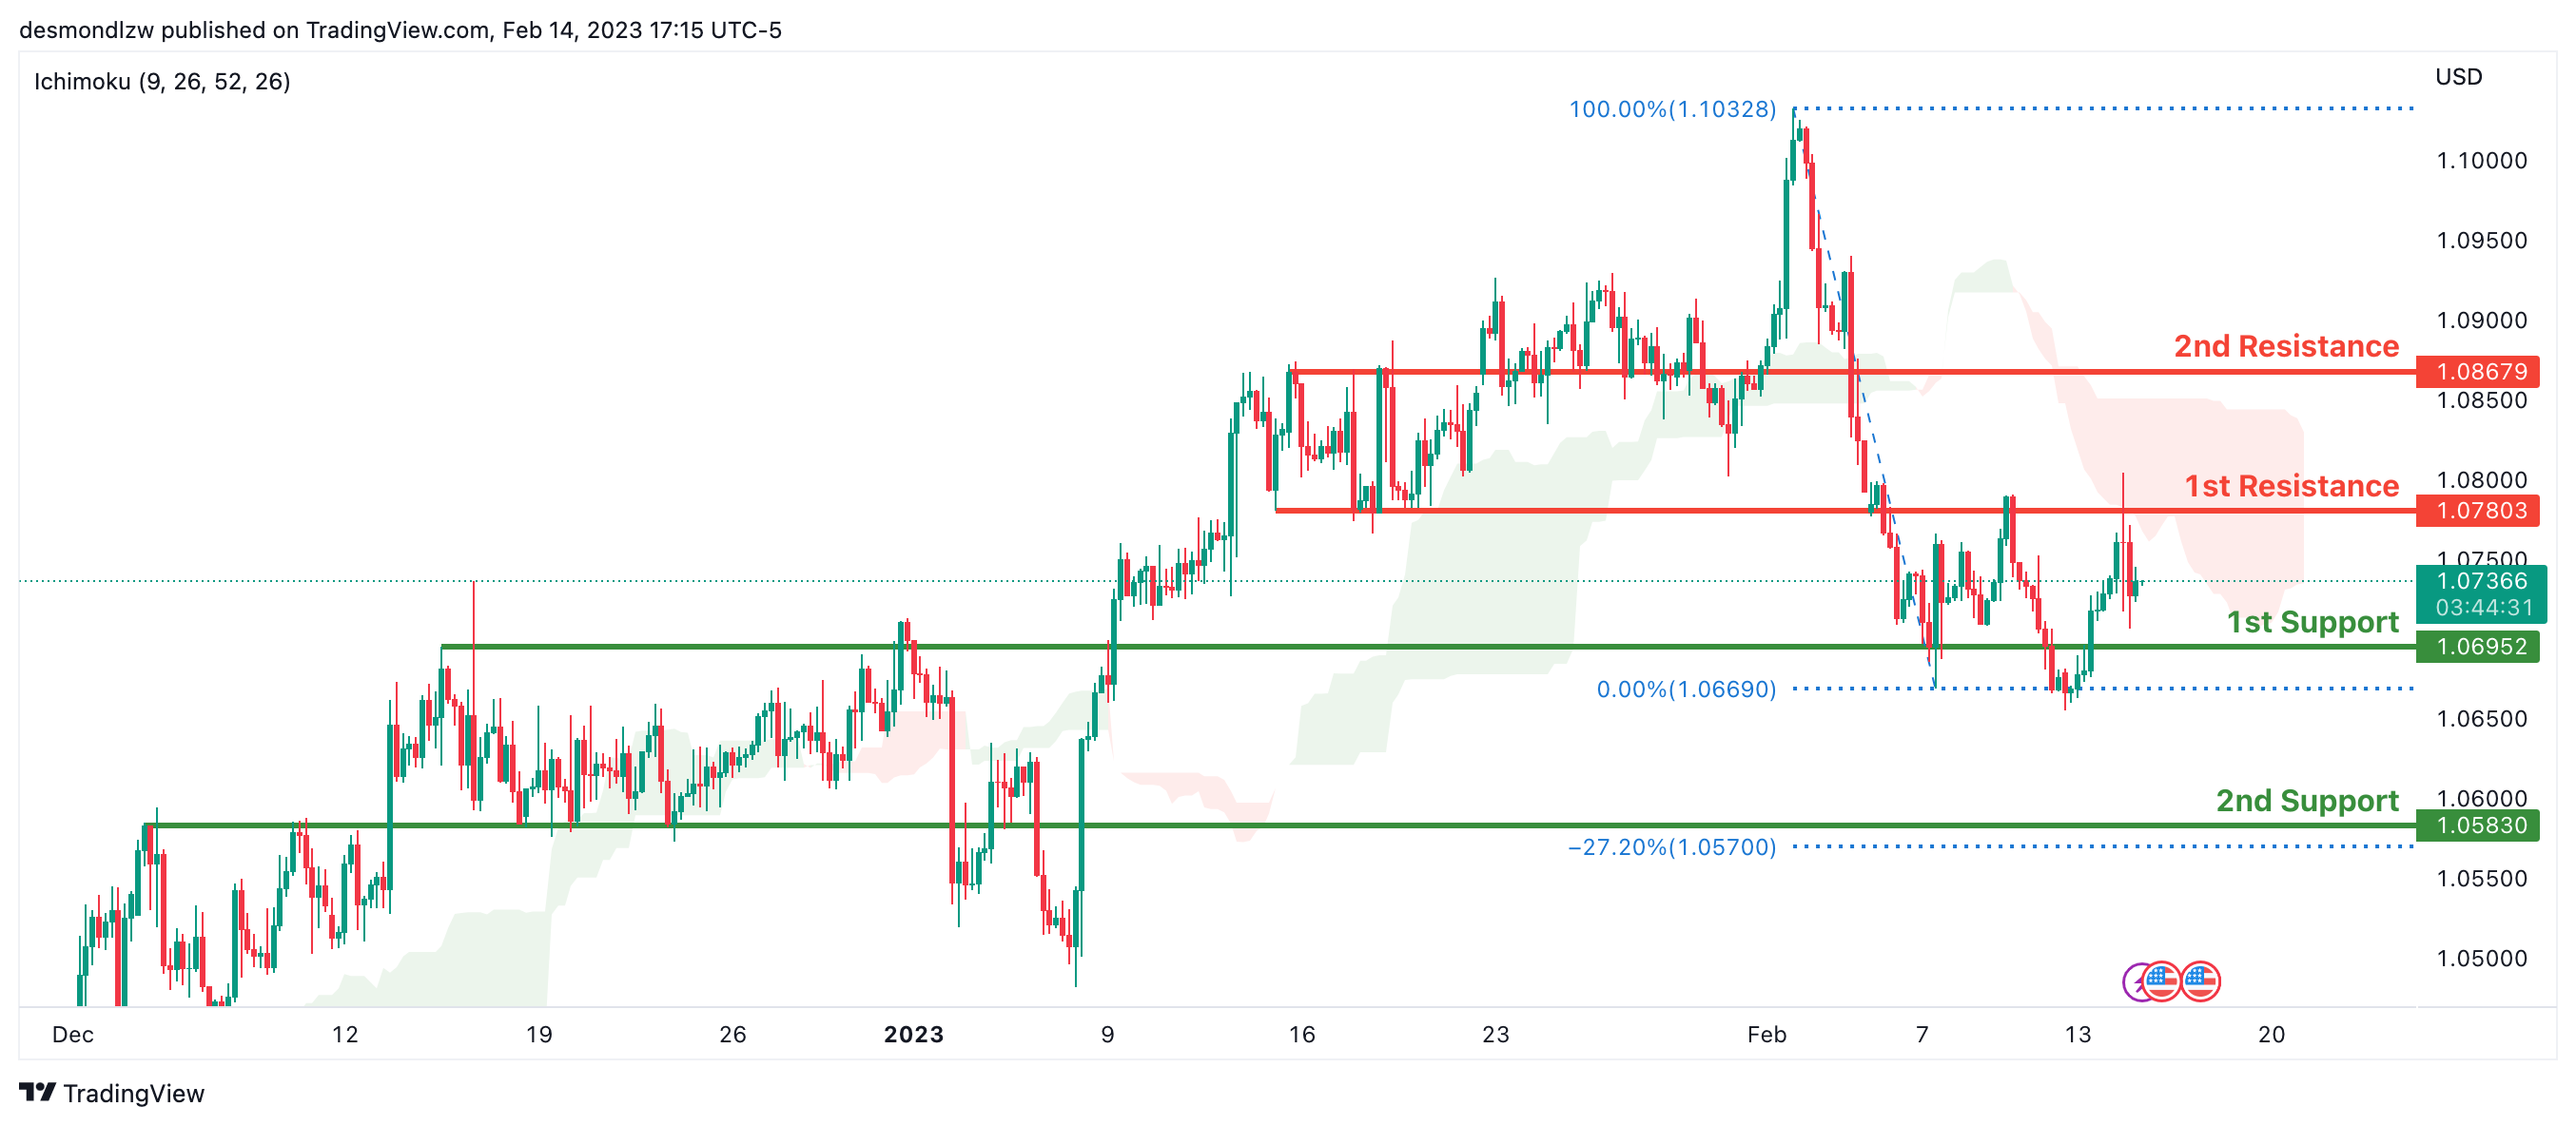
EUR/USD:
Looking at the H4 chart, my overall bias for EURUSD is bearish due to the current price crossing below the Ichimoku cloud, indicating a bearish market structure. If this bearish momentum continues, expect the price to possibly continue heading towards the 1st support at 1.06952, where the overlap support is. In an alternate scenario, price could possibly head back up to retest the 1st resistance at 1.07803, where the overlap resistance is.
Areas of consideration :
- H4 1st resistance at 1.07803
- H4 1st support at 1.06952
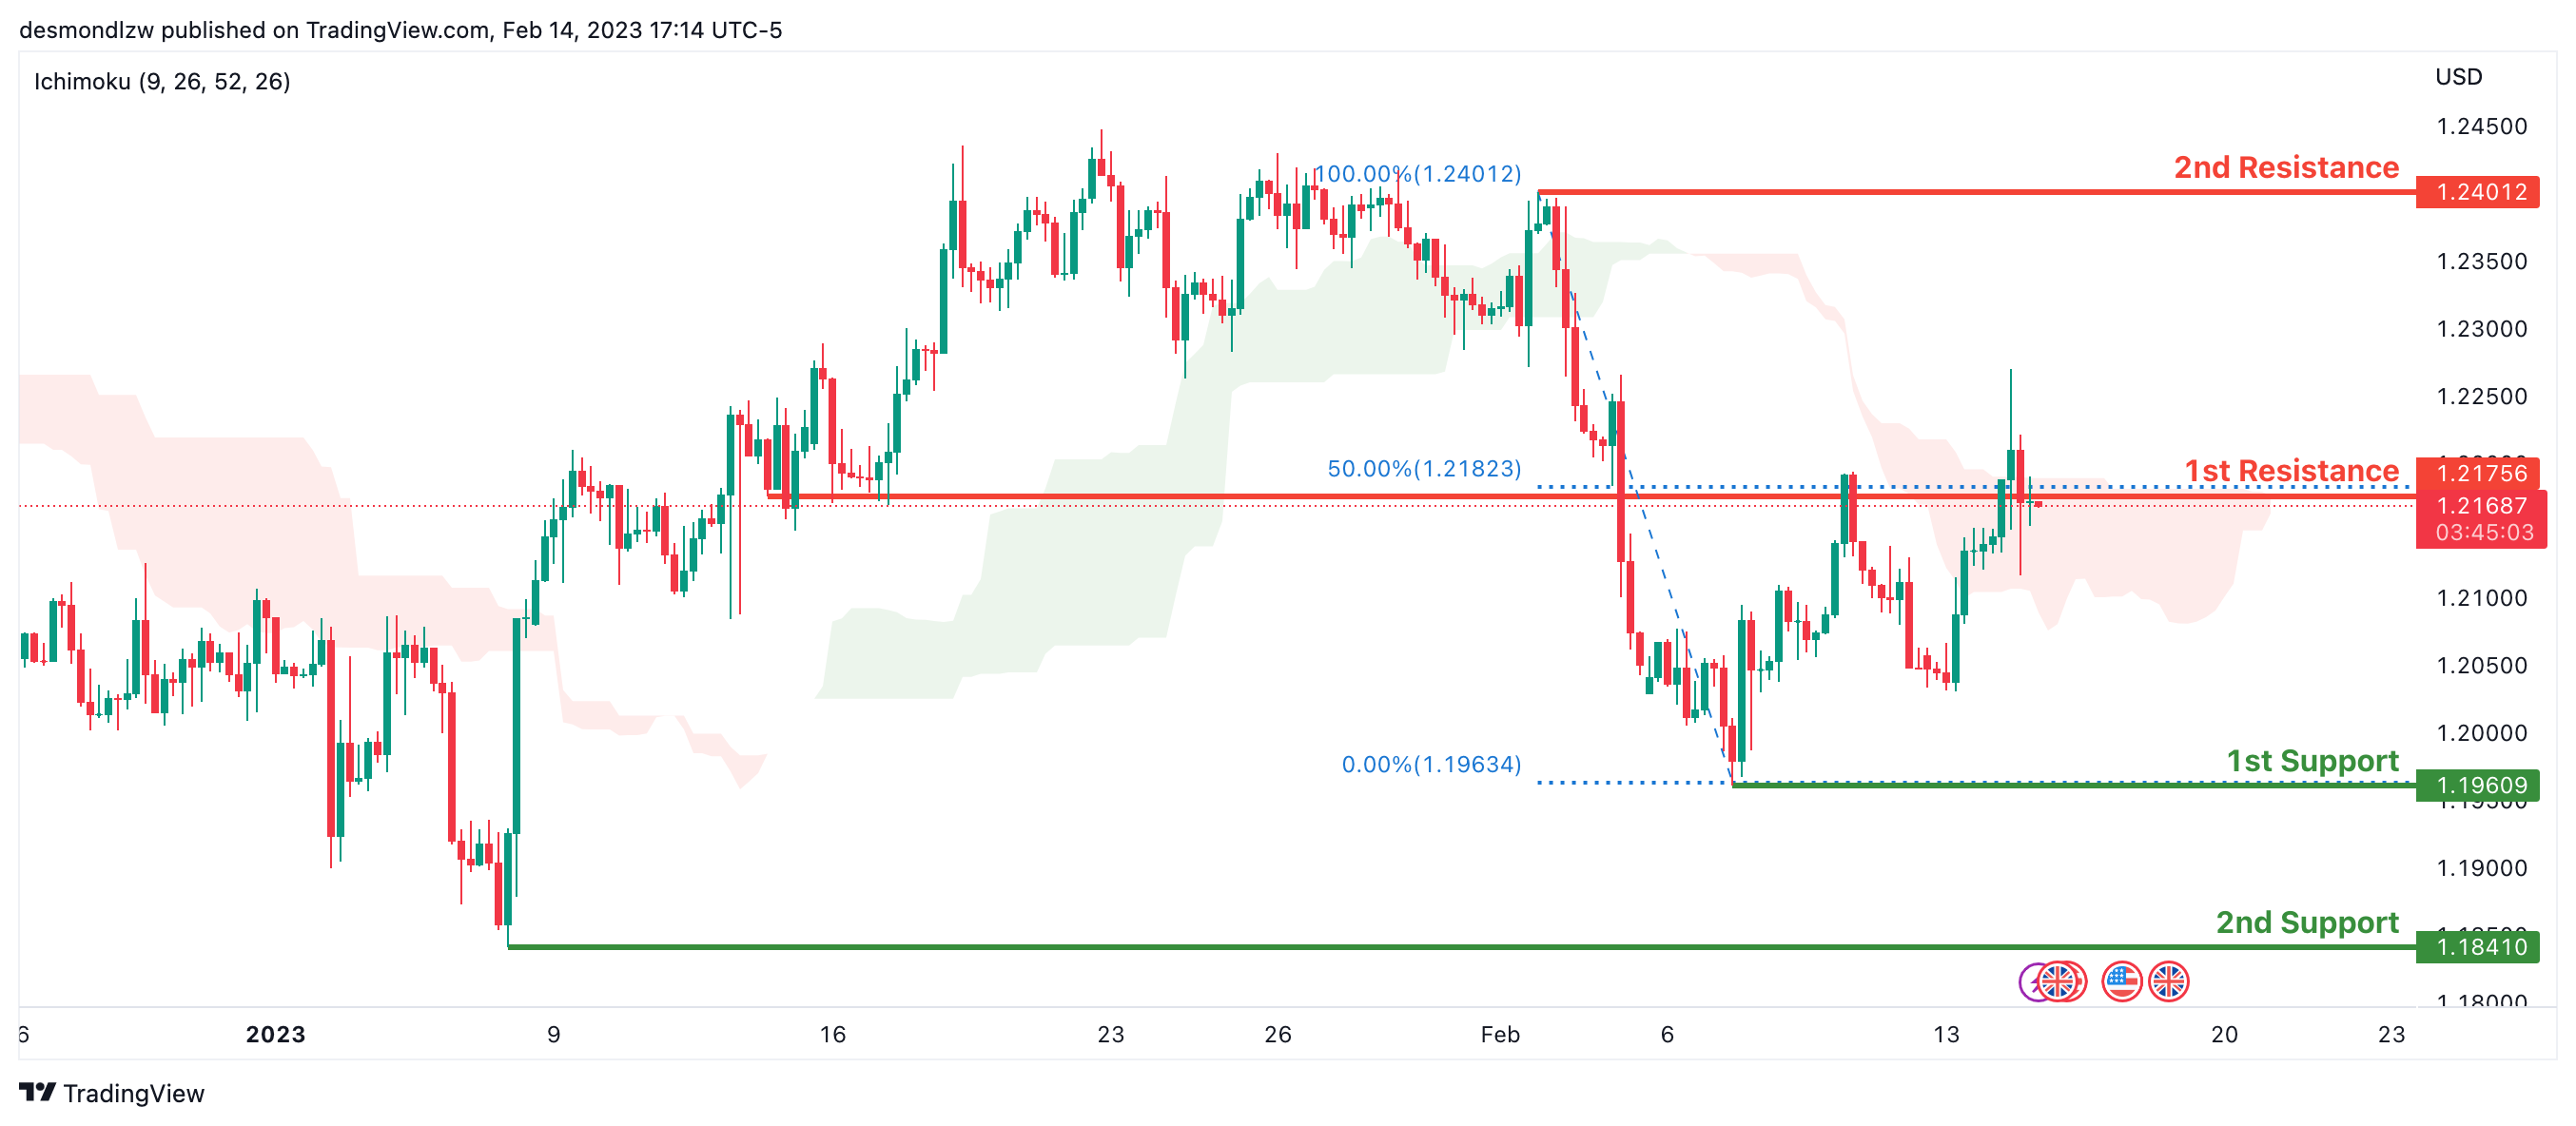
GBP/USD:
Looking at the H4 chart, my overall bias for GBPUSD is bearish due to the current price crossing below the Ichimoku cloud, indicating a bearish market. If this bearish momentum continues, expect the price to possibly continue to head towards the 1st support at 1.19609, where the recent swing low is. In an alternate scenario, price could head back up to retest the 1st resistance line at 1.21756 where the overlap resistance and 50% Fibonacci line is.
Areas of consideration:
- H4 1st resistance at 1.21756
- H4 1st support at 1.19609
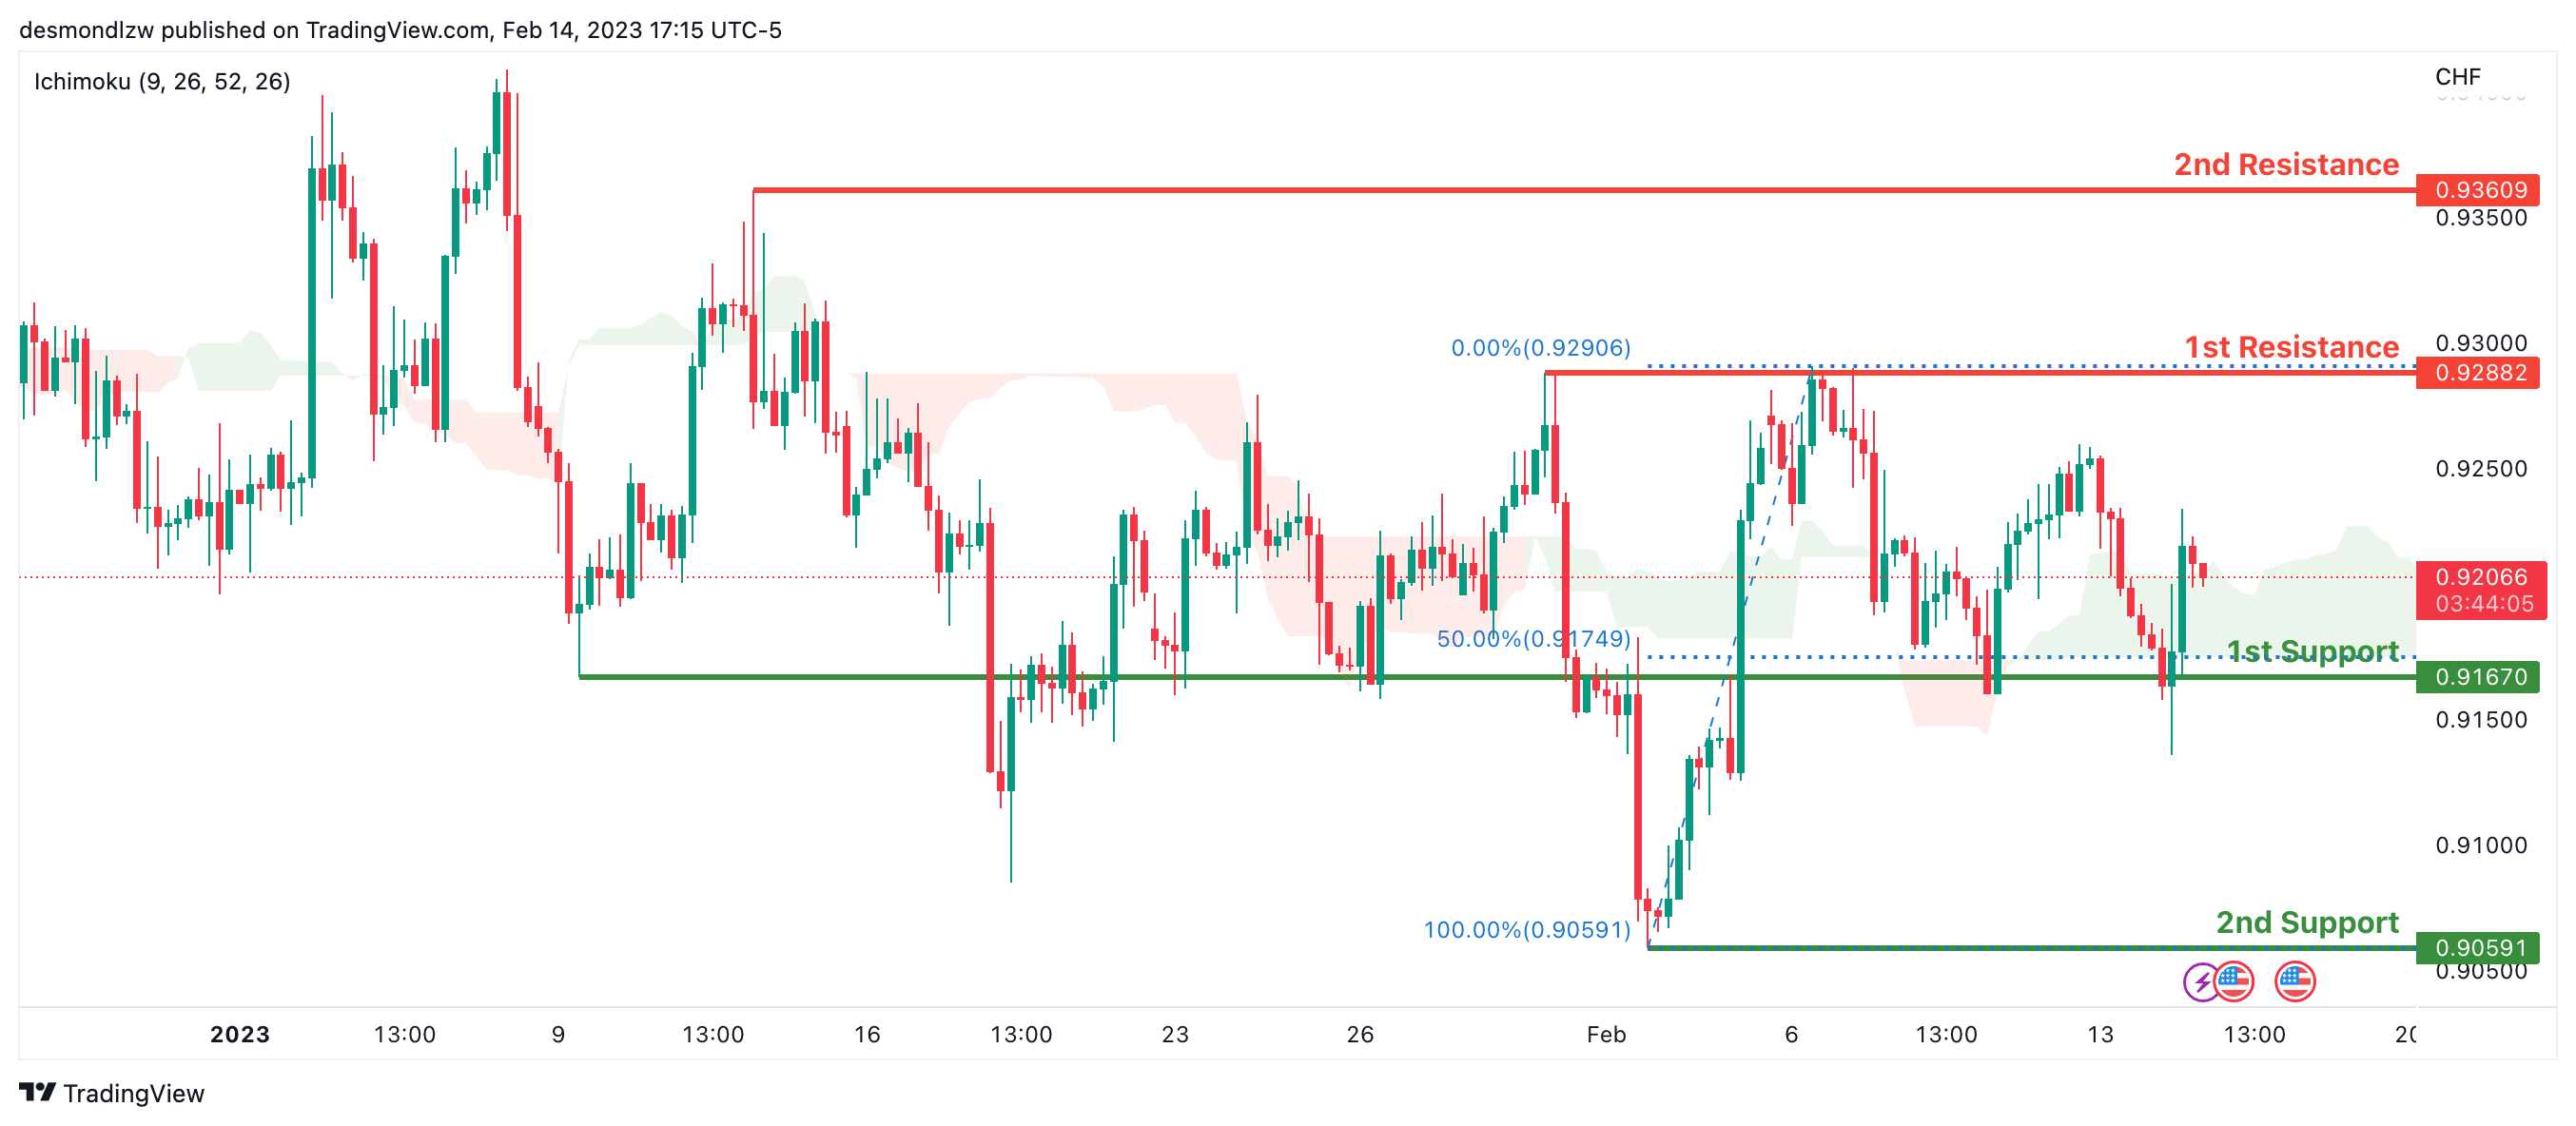
USD/CHF:
Looking at the H4 chart, my overall bias for USDCHF is bullish due to the current price being above the Ichimoku cloud, indicating a bullish market. If the current bullish trend continues, expect the price to possibly break the 1st resistance at 0.92882, where the previous swing high is, before heading towards the 2nd resistance at 0.93609 where the intermediate high is. In an alternative scenario, price could possibly head back down to retest the 1st support at 0.90591, where the recent swing low and 50% Fibonacci line is.
Areas of consideration
- H4 1st support at 0.90591
- H4 1st resistance at 0.92882
- H4 2nd resistance at 0.93609
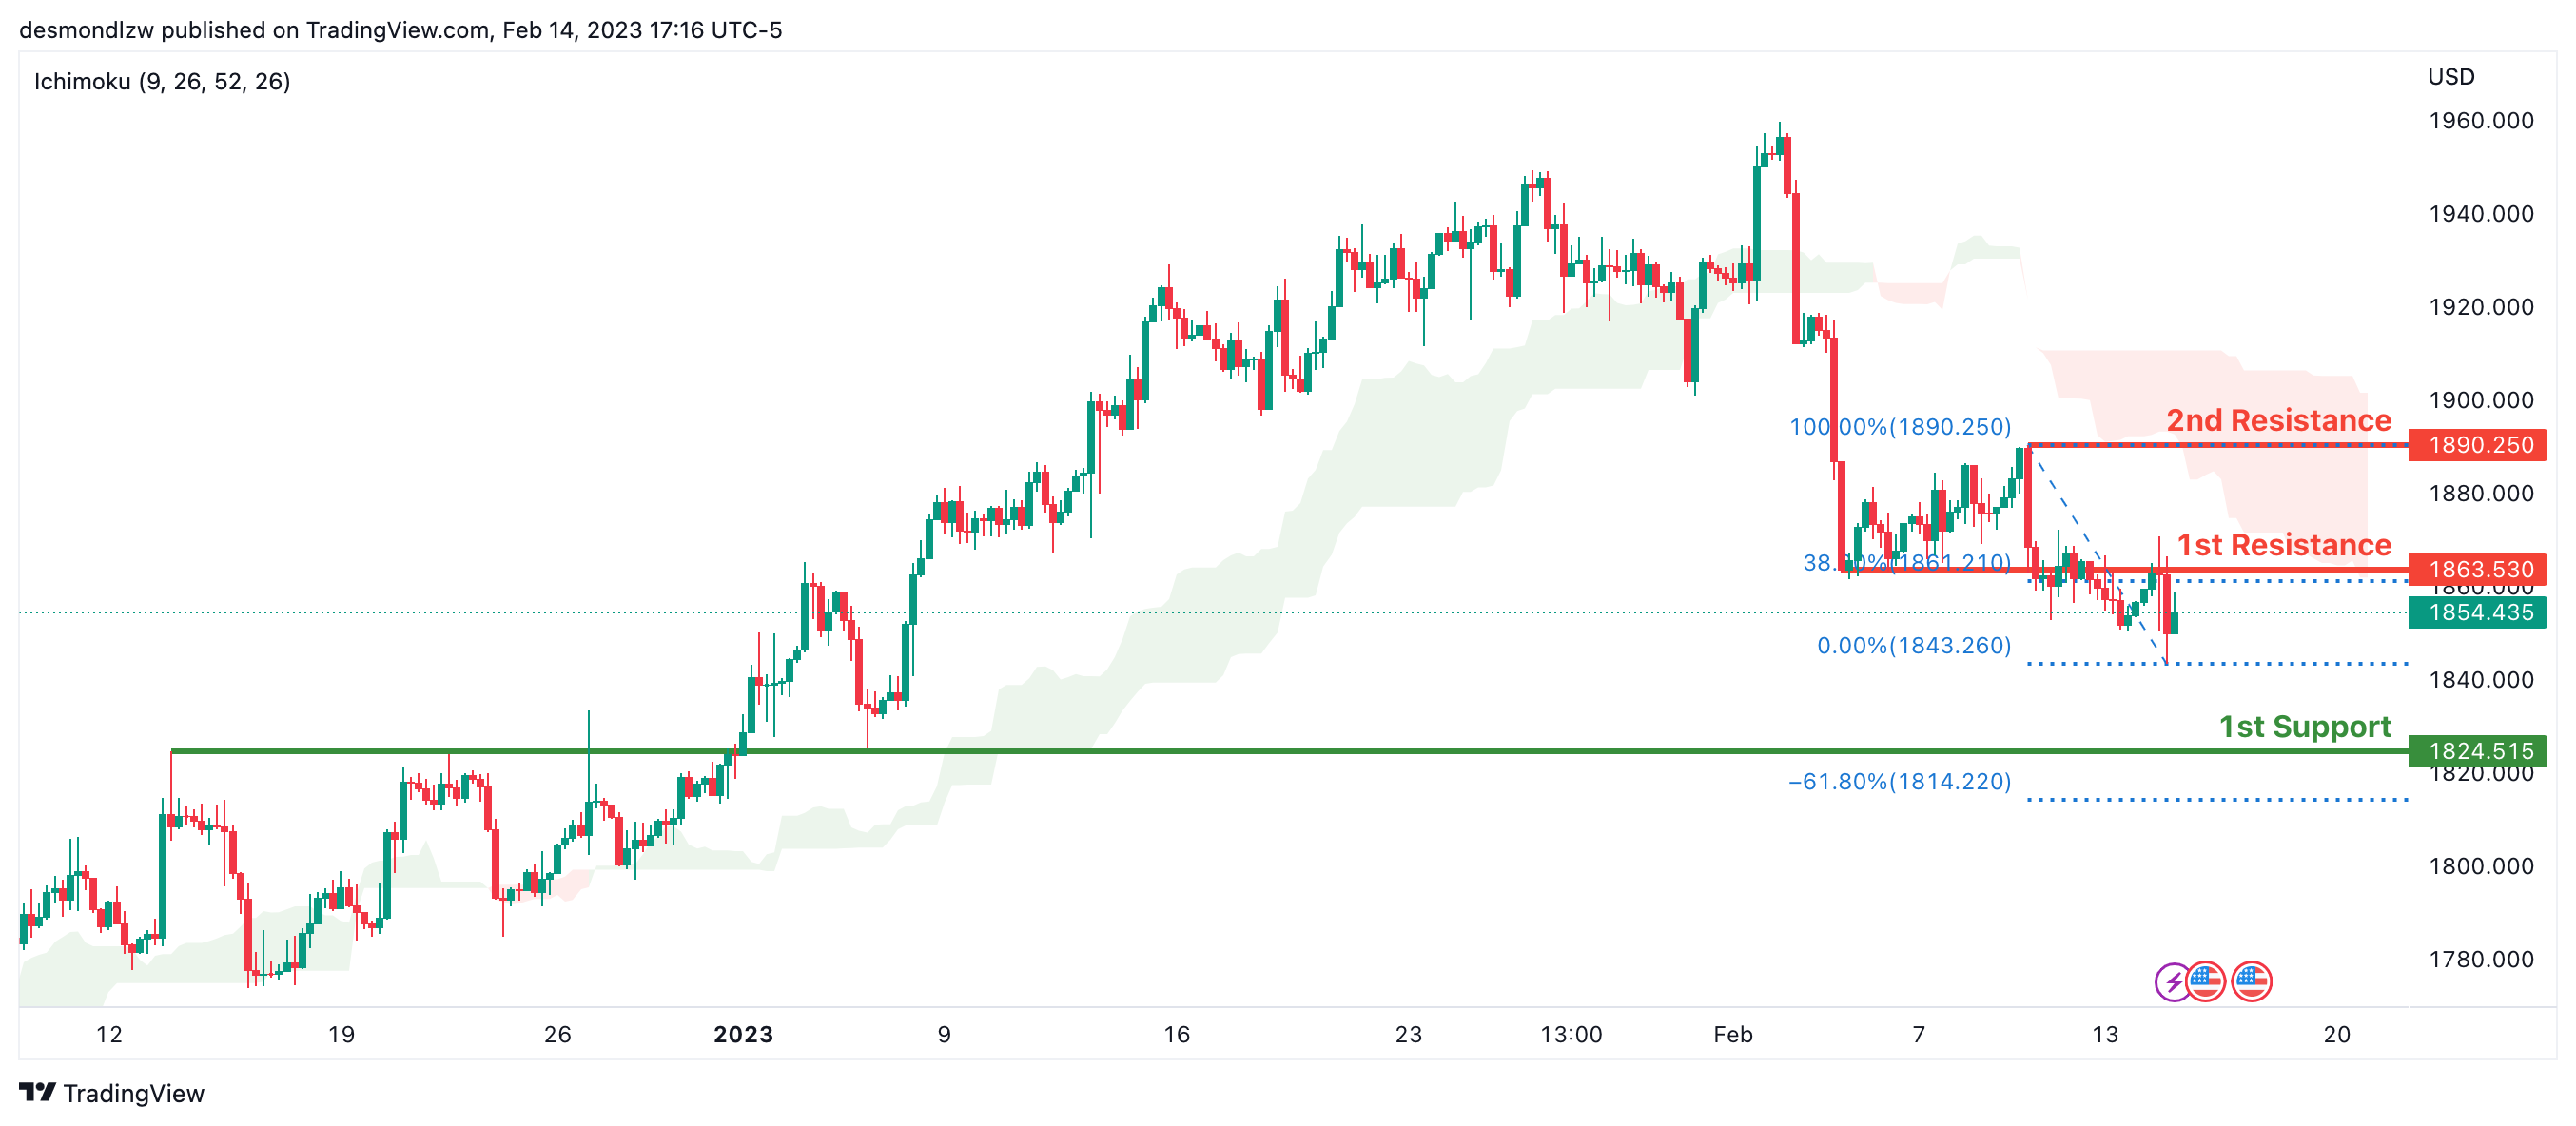
XAU/USD (GOLD):
Looking at the H4 chart, my overall bias for XAUUSD is bearish due to the current price being below the Ichimoku cloud, indicating a bearish market. If this bearish momentum continues, expect the price to possibly continue heading towards the 1st support at 1824.515 where the overlap support and -61.8% Fibonacci expansion line is. In an alternative scenario, price could possibly head back up to retest the 1st resistance at 1863.530, where the previous swing low and 38.2% Fibonacci line is.
Areas of consideration:
- H4 time frame, 1st resistance at 1863.530
- H4 time frame, 1st support at 1824.515
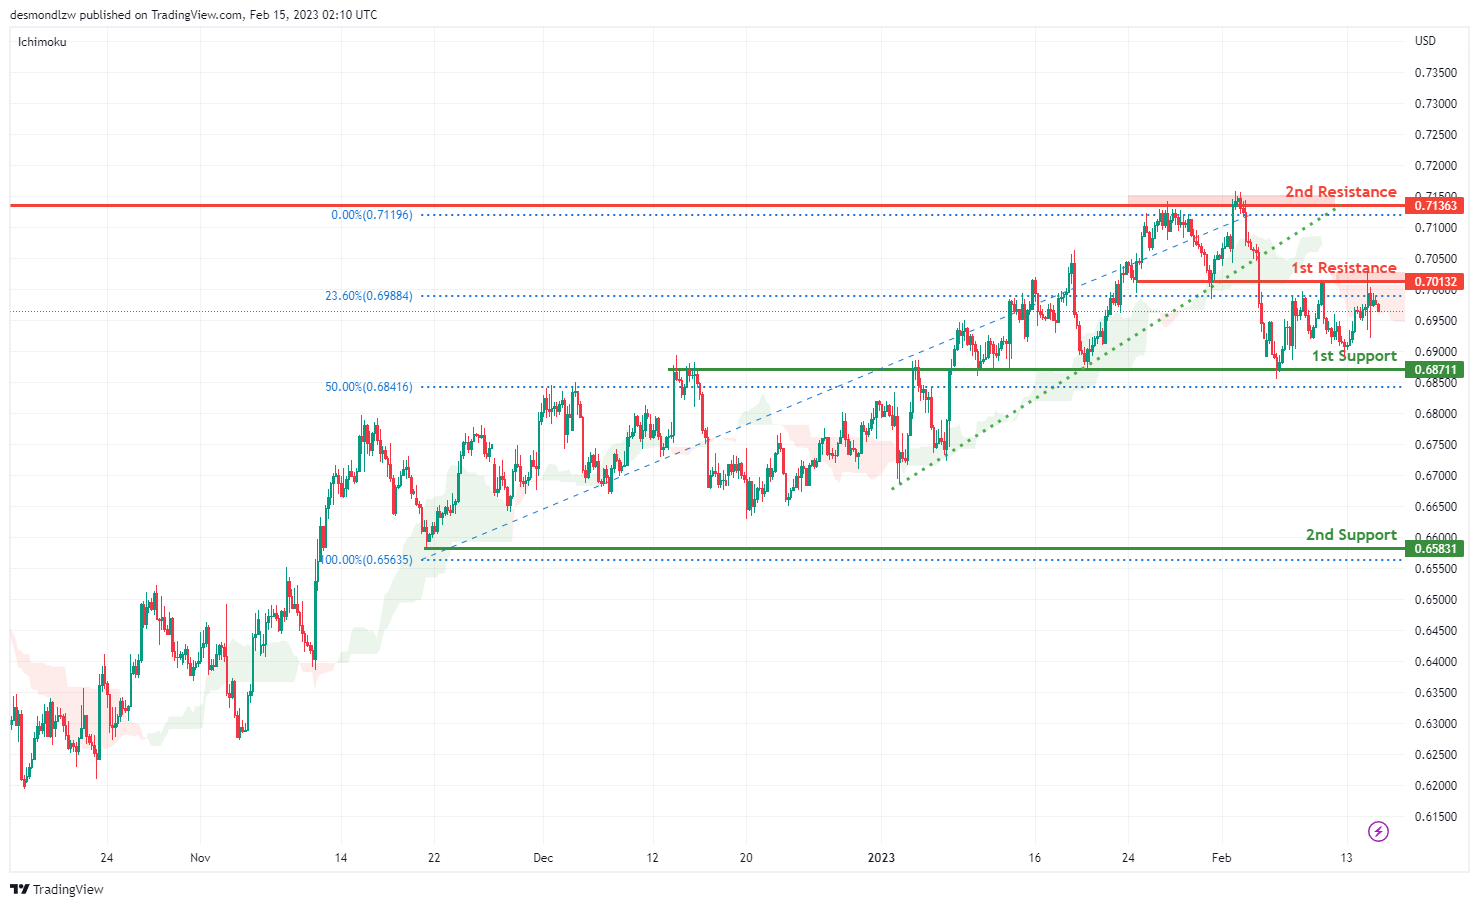
AUD/USD:
Looking at the H4 chart, my overall bias for AUDUSD is bearish due to the current price being below the Ichimoku cloud, and the ascending trend line has been broken, indicating a change of market structure.
The 1st support is at 0.68711 which is the overlap support and in line with the 50% Fibonacci retracement. The 2nd support is at 0.65831 which is the recent swing low.
In an alternate scenario, the price could possibly go back up towards the 1st resistance level at 0.70132 which is the recent swing high and in line with the 23.6% Fibonacci retracement. There is 2nd resistance at 0.71363 which is the previous swing high.
Areas of consideration
- H4. 2nd resistance at 0.71363
- H4. 1st resistance at 0.70132
- H4, 1st support at 0.68711
- H4, 2nd support at 0.65831
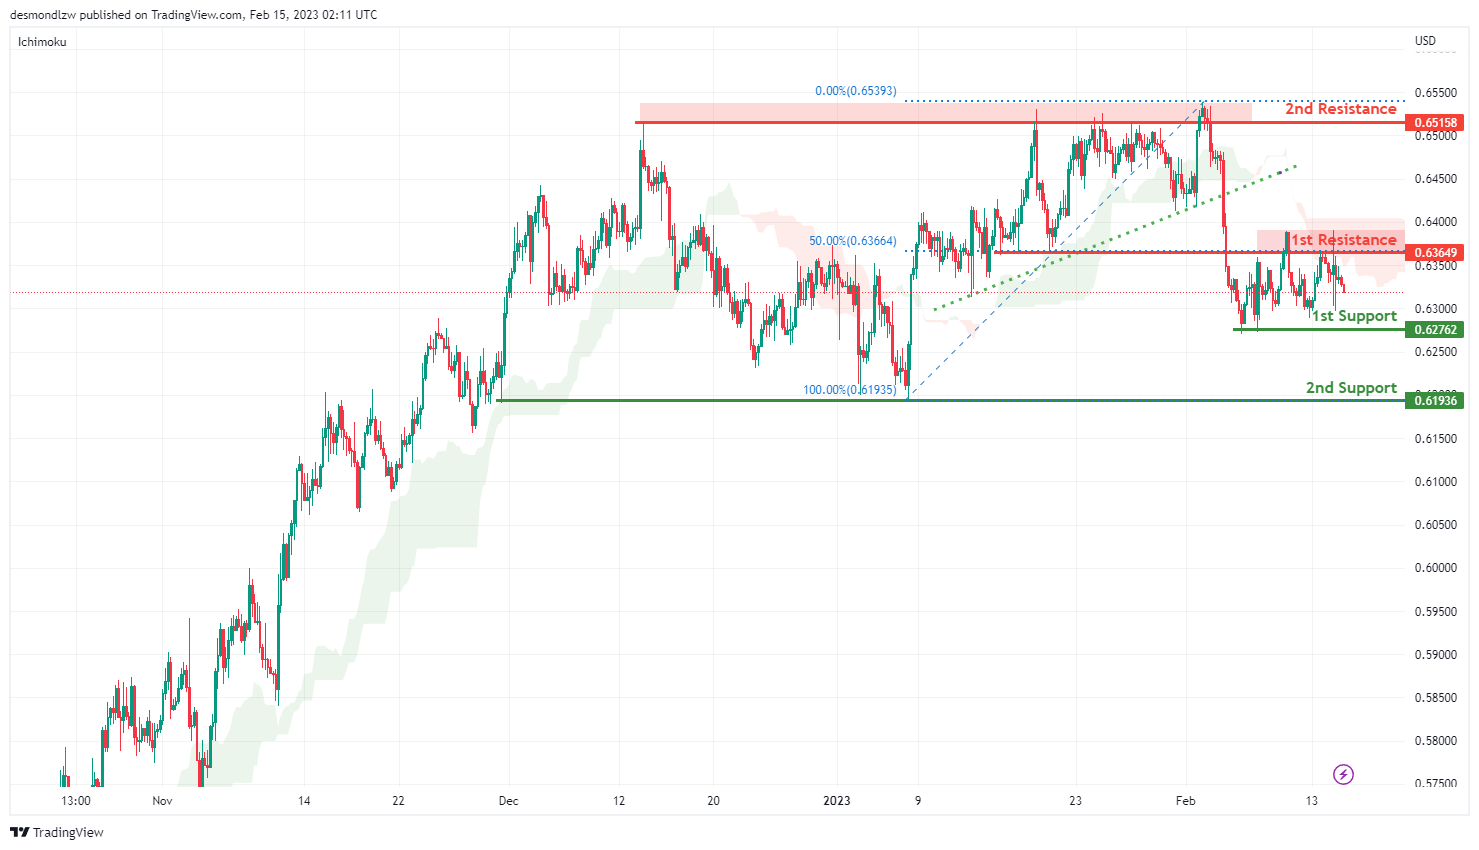
NZD/USD:
Looking at the H4 chart, my overall bias for NZDUSD is bearish, as the current price is below the Ichimoku Cloud, and the ascending trend line has been broken, indicating a change of market structure. Expecting the price to go down towards the 1st support at 0.62762 which is the recent overlap swing low. It is also inline with 23.6% Fibonacci retracement. The 2nd support is at 0.61936.
In an alternate scenario, price could possibly go up towards the 1st resistance level at 0.63649 which is the recent overlap swing high andin line with 50% Fibonacci retracement. . There is a 2nd resistance at 0.65158.
Areas of consideration:
- H4 time frame, 2nd resistance at 0.65158
- H4 time frame, 1st resistance at 0.63649
- H4 time frame, 1st support at 0.62762
- H4 time frame, 2nd support at 0.61936
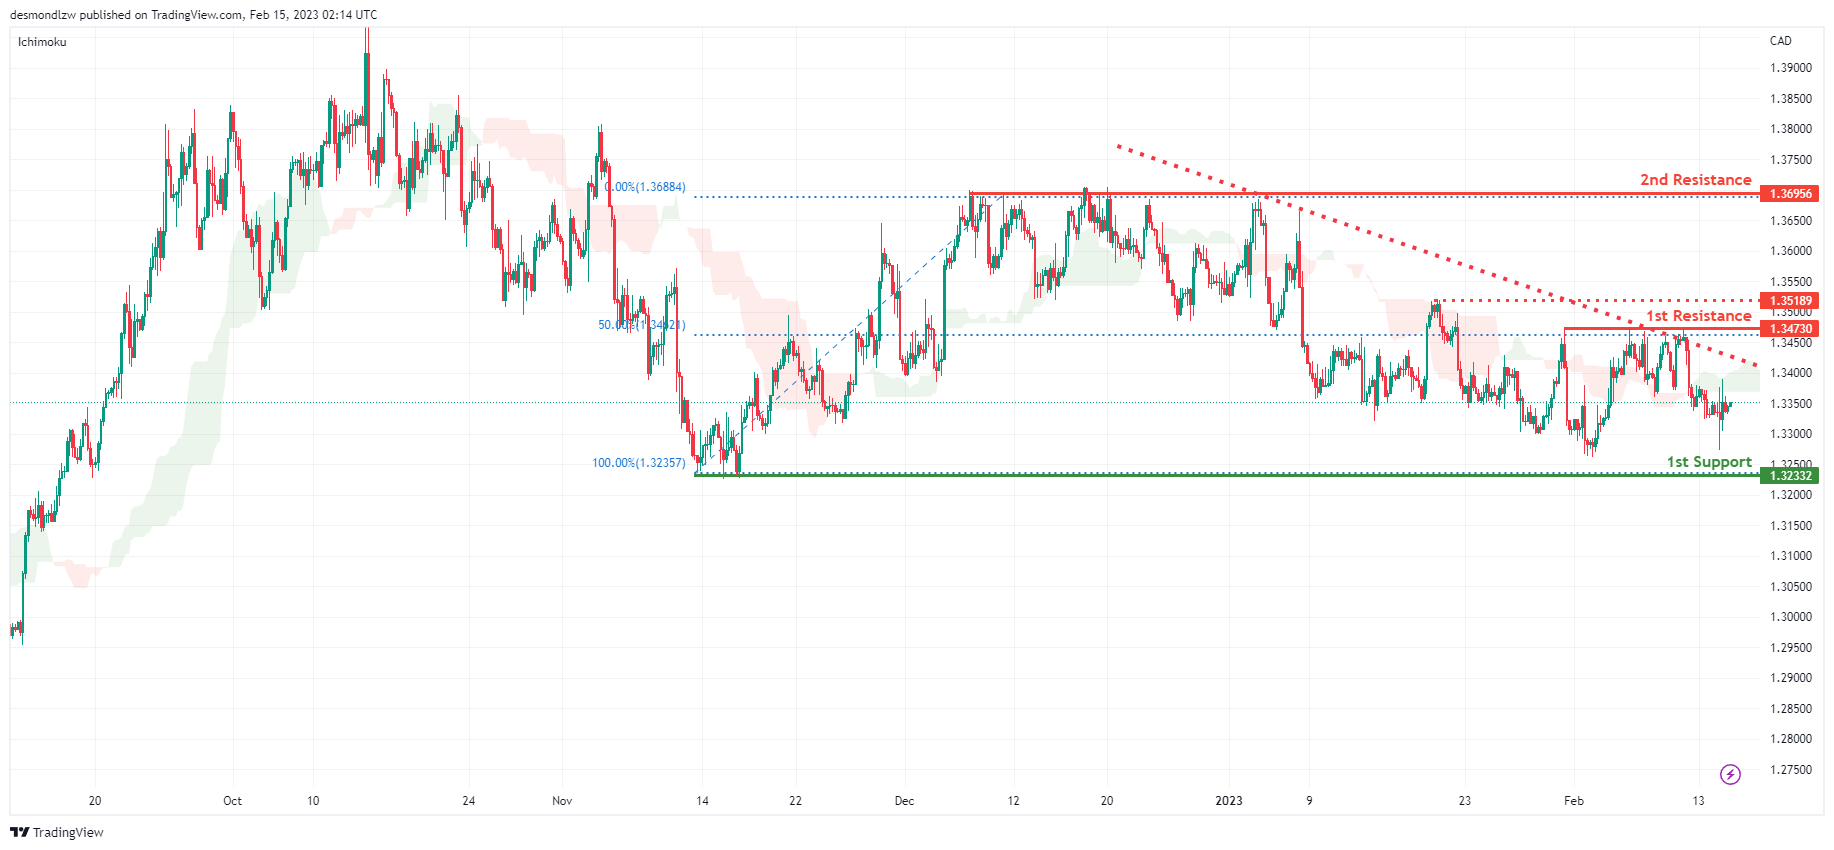
USD/CAD:
Looking at the H4 chart, my overall bias for USDCAD is bearish , as there is a descending trend line. Expecting the current price is head down towards the 1st support at 1.32332 which is the recent swing low and in line with 61.8% Fibonacci retracement.
In an alternative scenario, the price could possibly head up to the 1st resistance at 1.34730 which is the recent swing high and also in line with the 50% Fibonacci retracement. The 2nd resistance is at 1.36933 which is the previous swing high.
Areas of consideration:
- H4 time frame, 2nd resistance at 1.36933
- H4 time frame, 1st resistance at 1.34730
- H4 time frame, 1st support at 1.32332
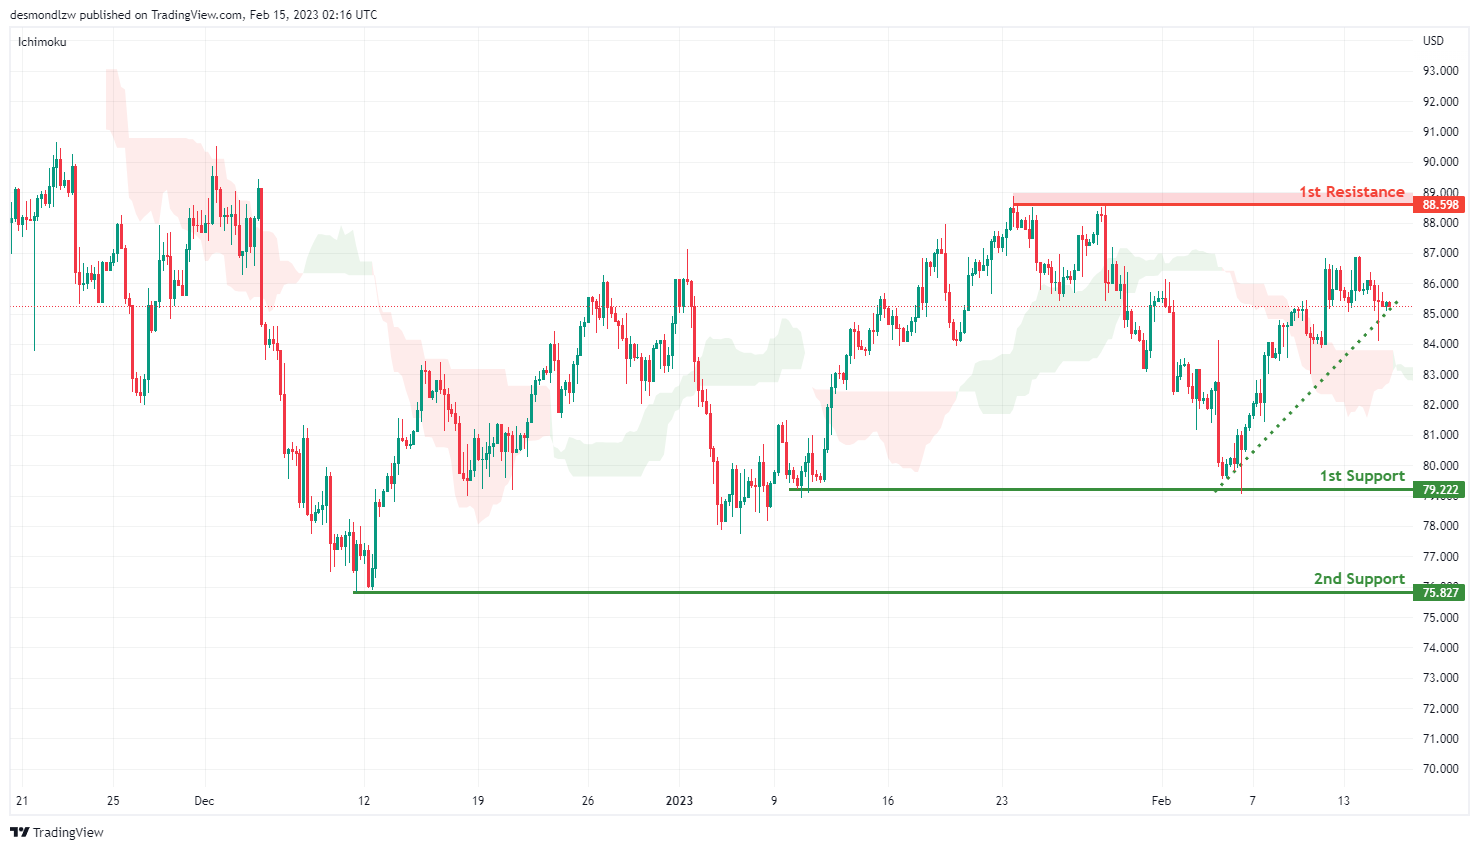
OIL:
Looking at the H4 chart, my overall bias for BOC is bullish.as the there is an ascending trend line, Expecting the price head up towards the 1st resistance level at 88.598 which is the recent swing high.
In an alternate scenario, the price could possibly head down towards the 1st support level at 79.222 which is the recent overlap swing low, before the price drops to the 2nd support at 75.827.
Areas of consideration:
- H4 time frame, 1st resistance at 88.598
- H4 time frame,1st support at 79.587
- H4 time frame, 2nd support at 75.827
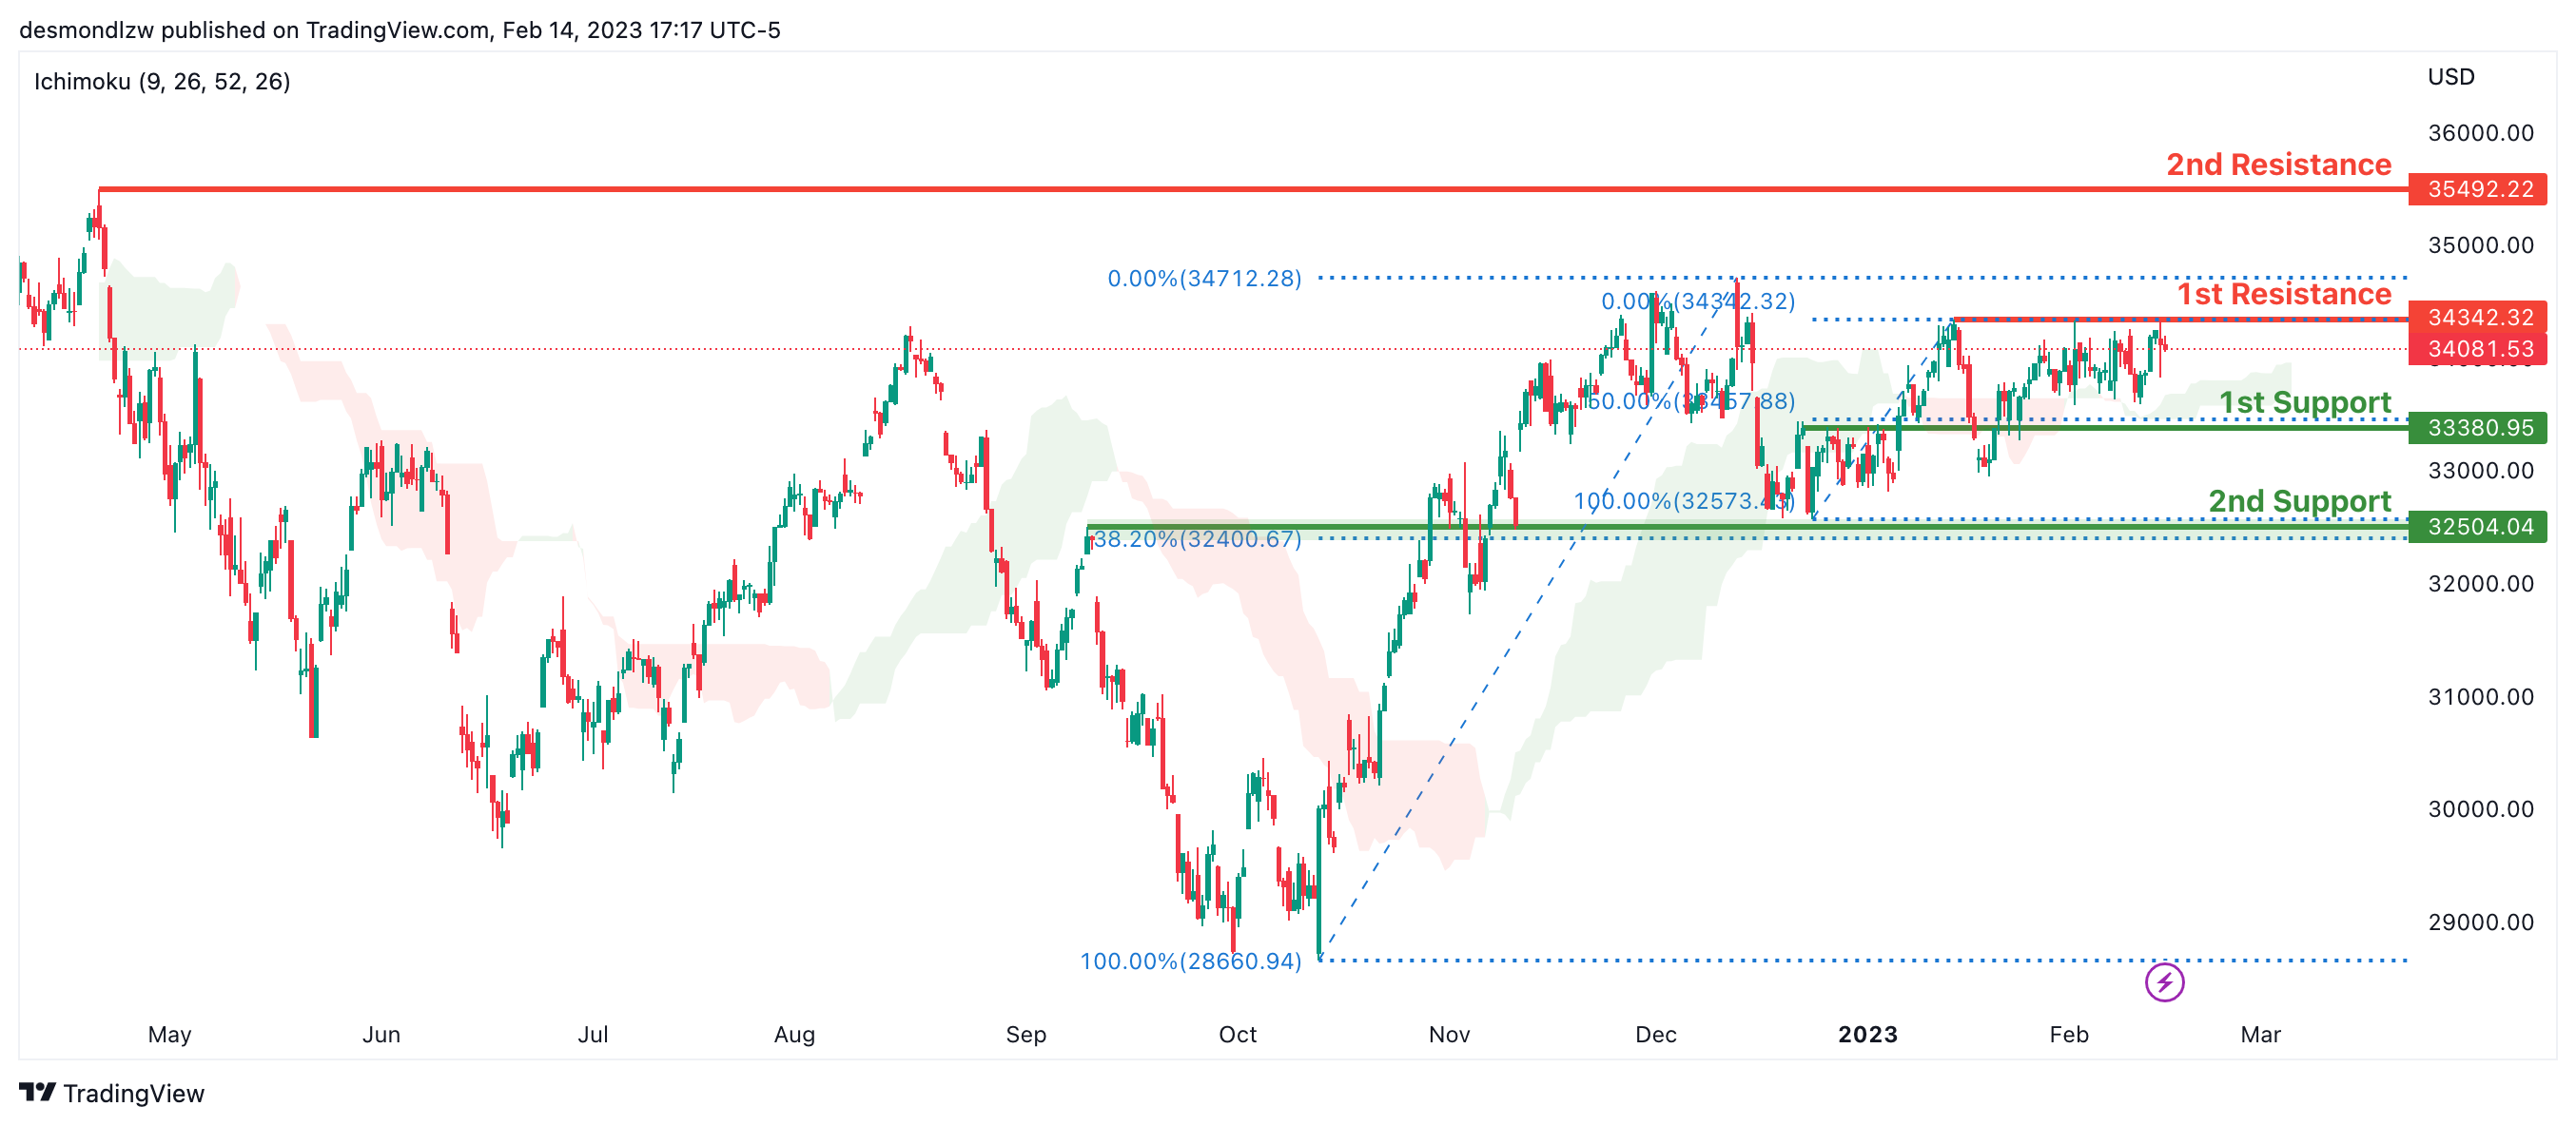
Dow Jones Industrial Average:
On the H4 chart, the overall bias for DJI is bullish. To add confluence to this, the price is crossing above the Ichimoku cloud which indicates a bullish market. If this bullish momentum continues, expect the price to possibly continue heading towards the 1st resistance line at 34342.32, where the recent swing high is. In an alternative scenario, price could possibly head back down towards the 1st support at 33380.95, where the 50% Fibonacci line is.
Areas of consideration:
- H4 time frame, 1st support at 33380.95
- H4 time frame, 1st Resistance at 34342.32
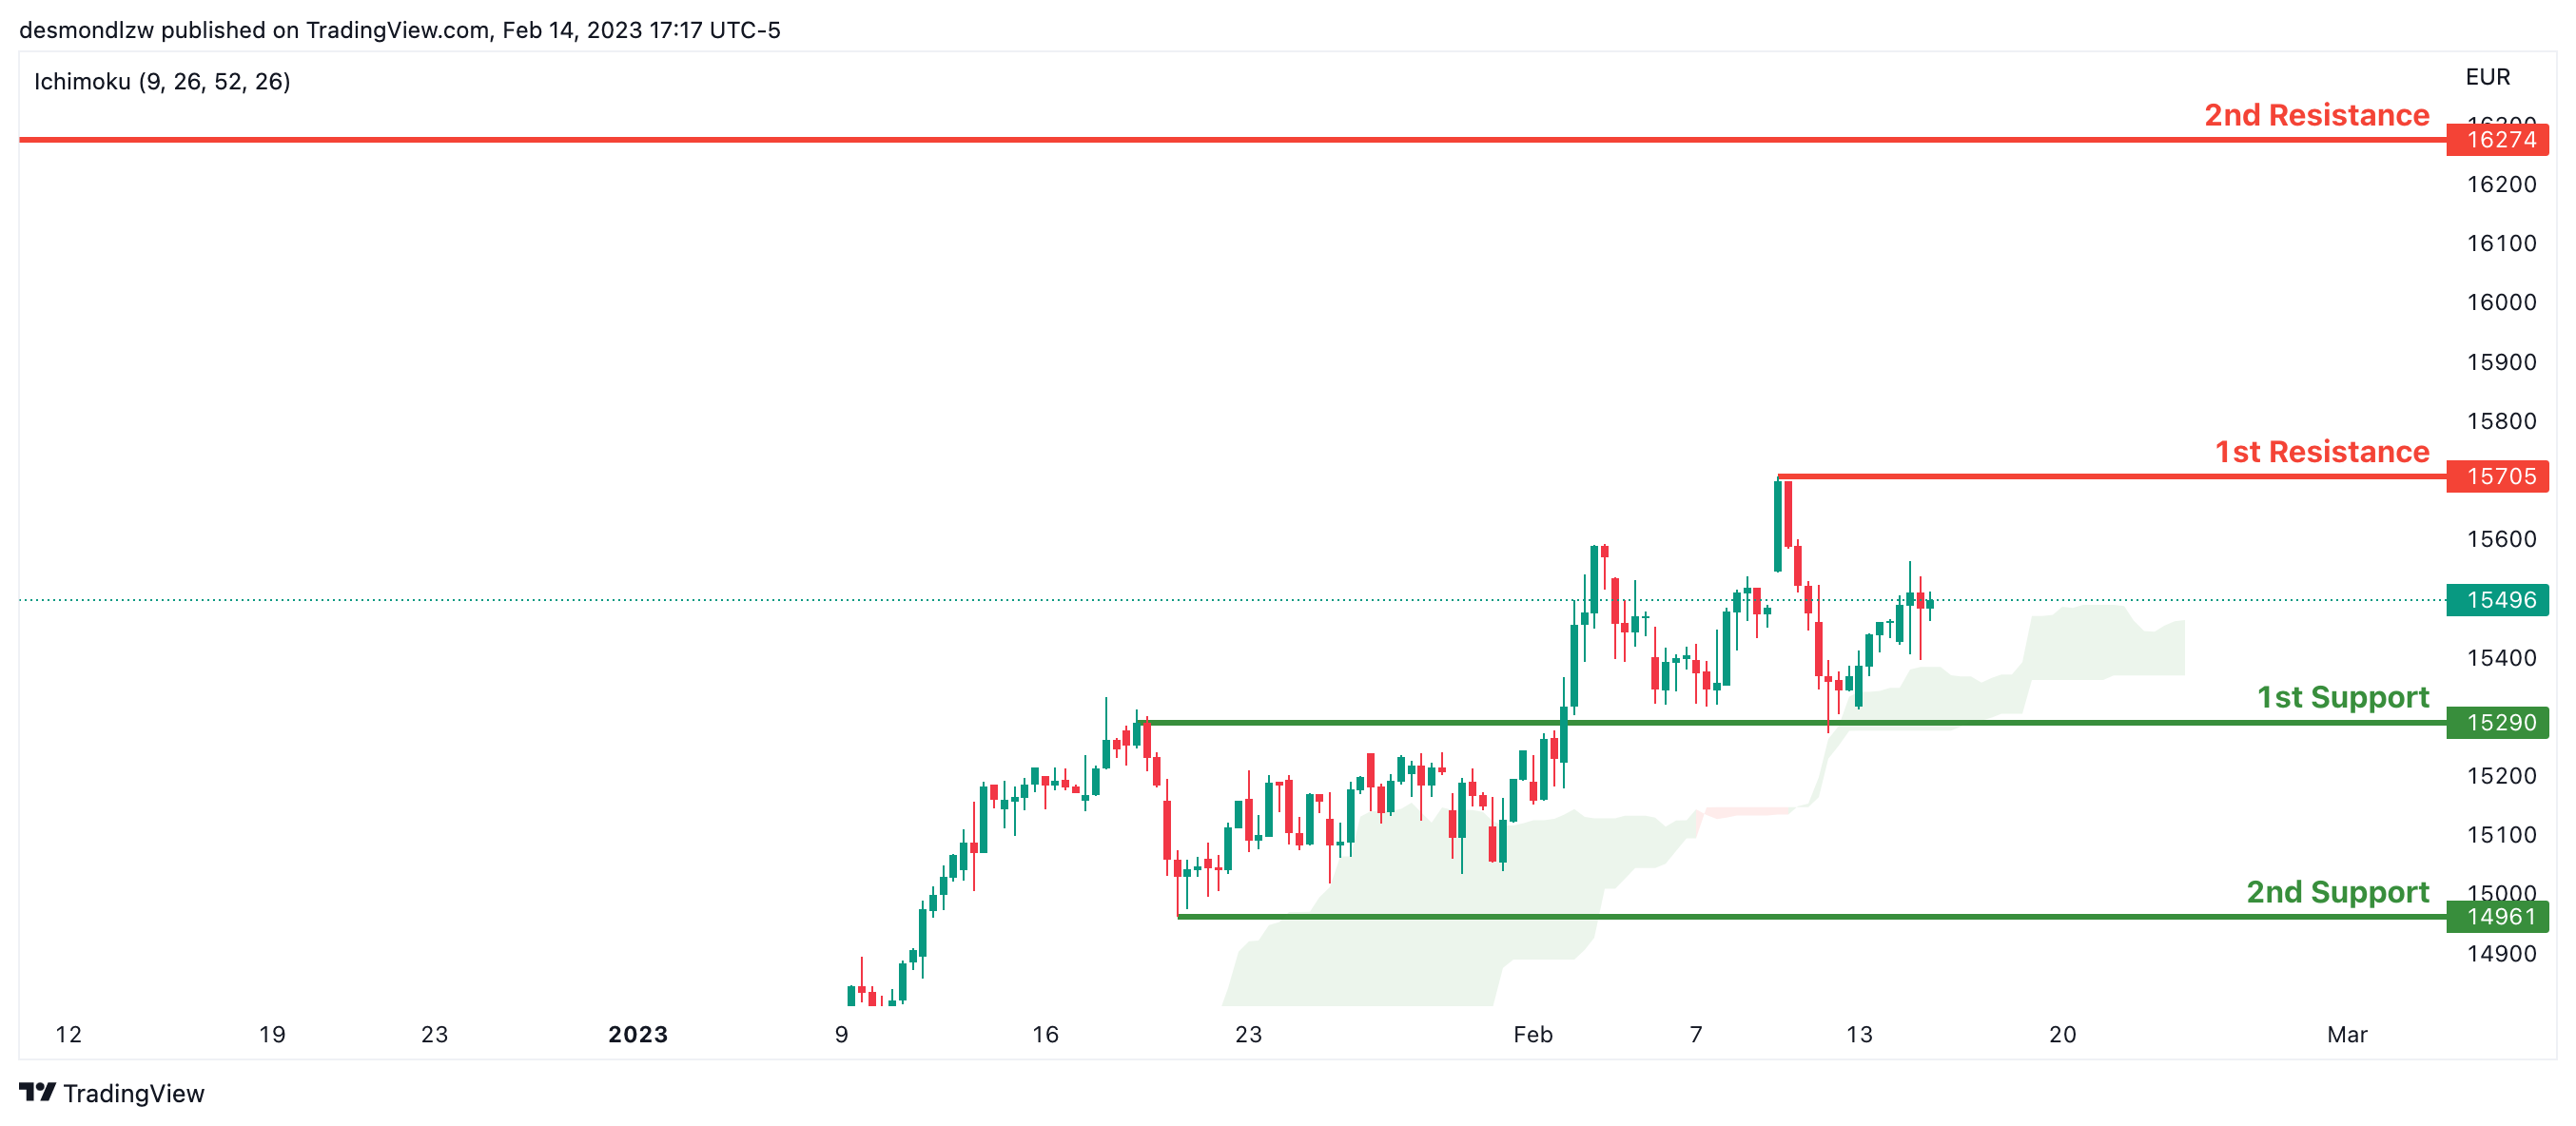
DAX:
Looking at the H4 chart, my overall bias for DAX is bullish due to the current price crossing above the Ichimoku cloud, indicating a bullish market. If this bullish momentum continues, expect the price to possibly head towards the 1st resistance line at 15705, where the recent high is. In an alternative scenario, price could possibly head down to retest the 1st support at 15290, where the overlap support is.
Areas of consideration:
- H4 time frame, 1st resistance is at 15705
- H4 time frame, 1st support is at 15290
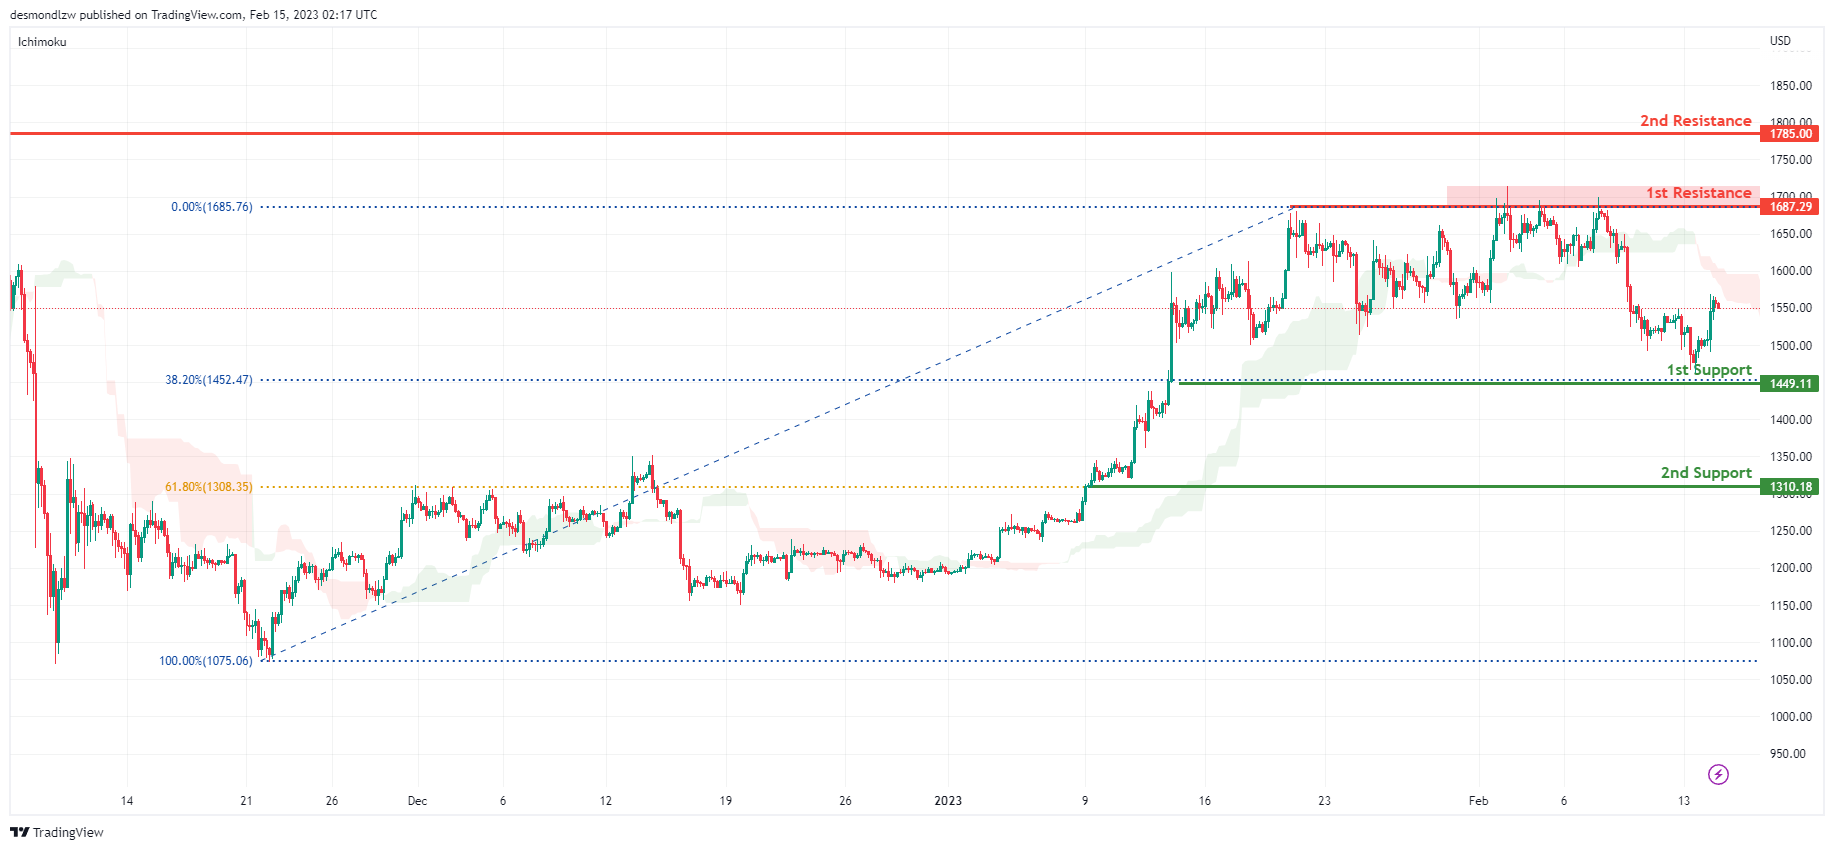
ETHUSD:
Looking at the H4 chart, my overall bias for ETHUSD is bearish, the strong ascending trend line has been broken. Expecting the price to go down to break the 1st support line at 1449.11 which is in line with 38.2% Fibonacci retracement, before it heads towards the 2nd support at 1310.18 which is in line with 61.8% Fibonacci retracement.
In an alternate scenario, the price may go up and break the 1st resistance line at 1685.76 before breaking the 2nd resistance line at 1785.00 which is the previous swing high.
Areas of consideration:
- H4 time frame, 2nd resistance of 1785.00
- H4 time frame, 1st resistance of 1685.76
- H4 time frame, 1st support at 1449.11
- H4 time frame, 2nd support at 1310.18
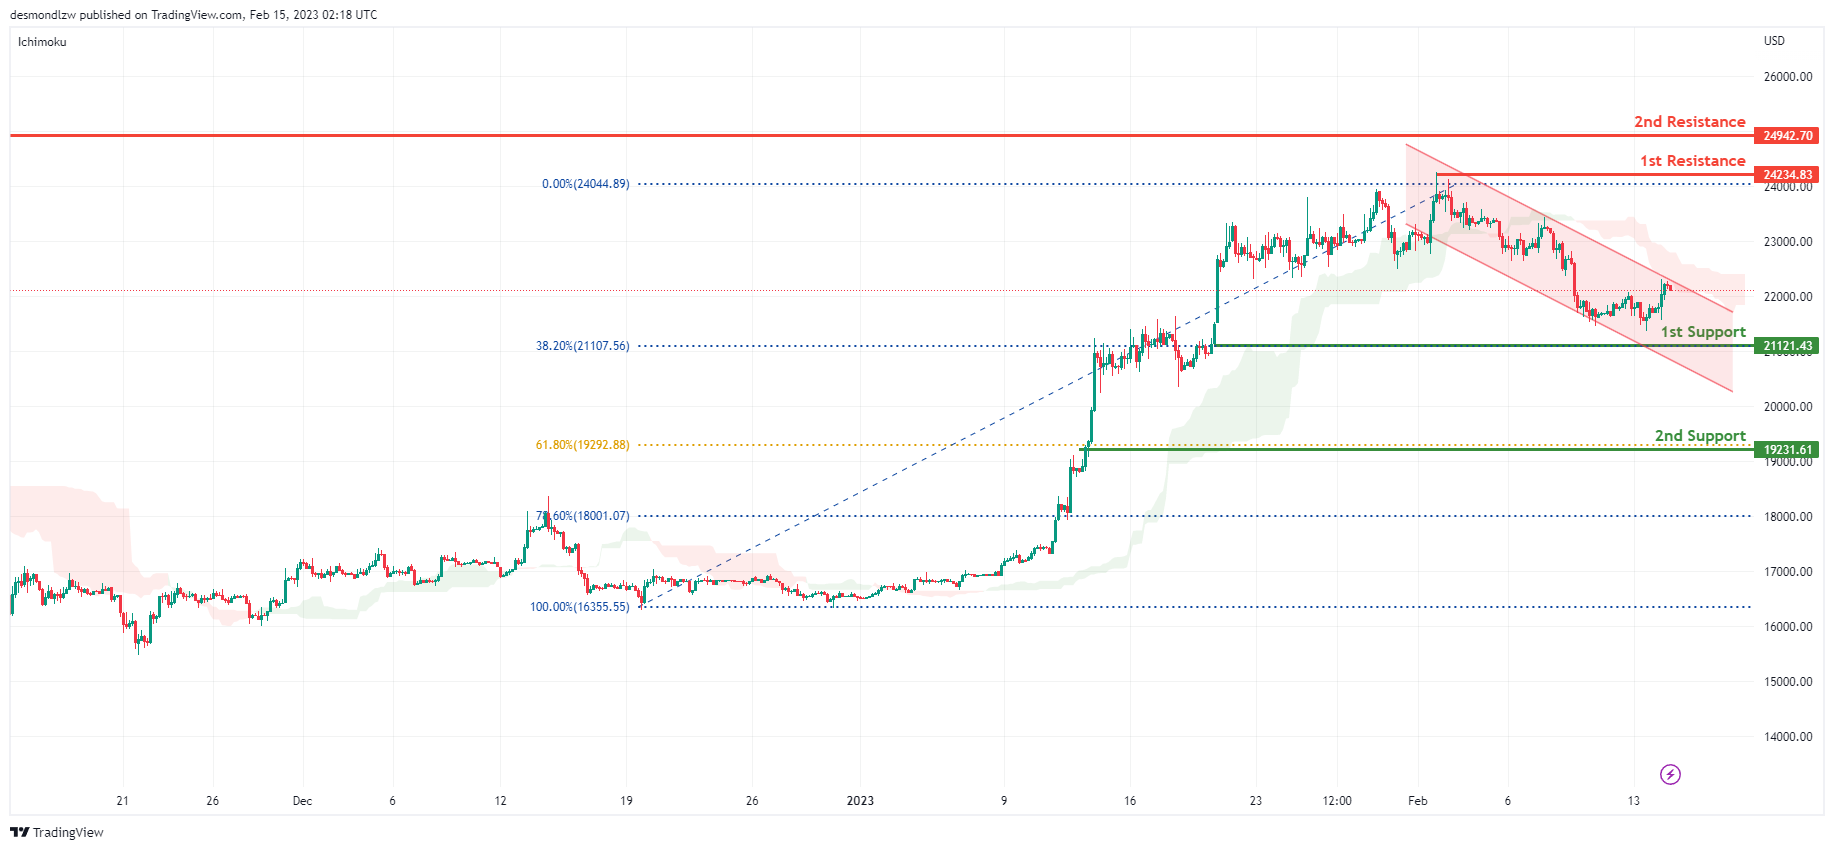
BTCUSD:
Looking at the H4 chart, my overall bias for BTCUSD is bearish. An ascending channel has broken, a descending channel was created, expecting the price to break the 1st support line at 21121.43 which is in line with 38.2% Fibonacci retracement, before heading down towards the 2nd support at 19231.61 which is in line with 61.8% Fibonacci retracement.
In an alternative scenario, the price could possibly head up to the 1st resistance at 24234.83 which is the recent swing high.
Areas of consideration:
- H4 time frame, 2nd resistance 24942.70
- H4 time frame, 1st resistance 24234.83
- H4 time frame, 1st support at 21121.43
- H4 time frame, 2nd support at 19231.61
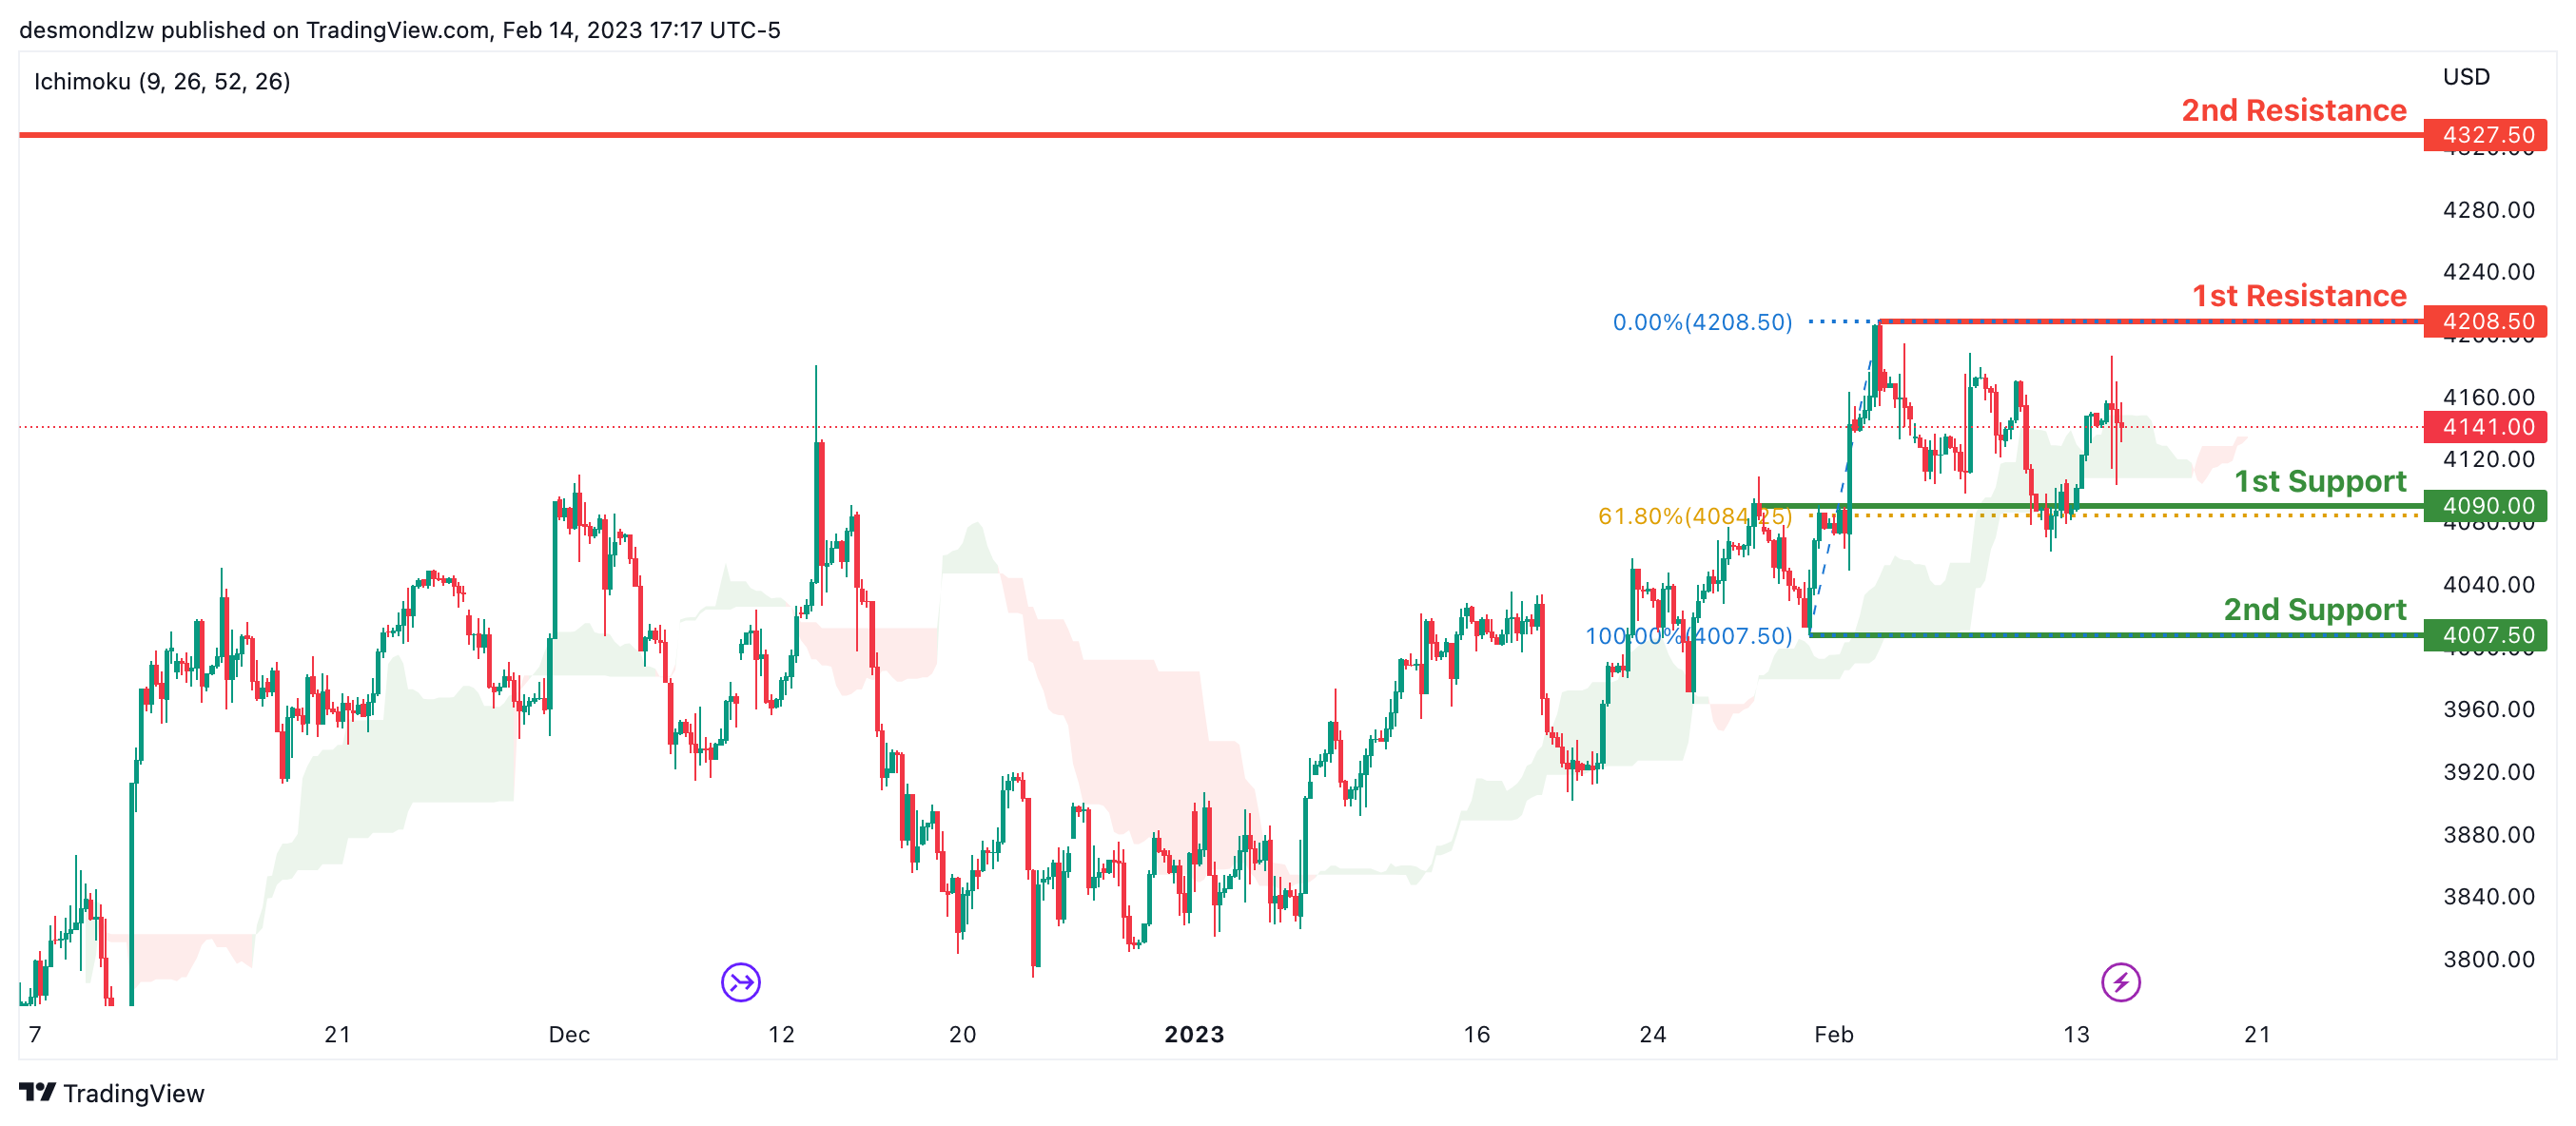
S&P 500:
Looking at the H4 chart, my overall bias for S&P500 is bullish due to the current price being above the Ichimoku cloud, indicating a bullish market. If this bullish momentum continues, expect the price to possibly break the 1st resistance at 4208.50, where the recent swing high is., before heading towards the 2nd resistance at 4327.50 where the previous swing high is, In an alternative scenario, price could possibly head back down to retest the 1st support at 4090.00, where the 50% Fibonacci line is.
Areas of consideration:
- H4 time frame, 1st support at 4090.00
- H4 time frame, 1st resistance at 4208.50
- H4 time frame, 2nd resistance at 4327.50


