
During tumultuous times like the current Credit Suisse-bailout period, the top-down technical analysis could be the compass for market investors/traders. Focusing on multiple timeframes can protect from decisions based purely on the very short-term periods examined. This process tends to be more time-consuming and ignored by most traders, but the benefits clearly outweigh the negatives. In this report, we analyse gold, which along with other financial instruments continue to feel the banking sector crisis aftershocks, starting from the longer-term and gradually moving to the lower time periods.
Starting point: Weekly timeframe
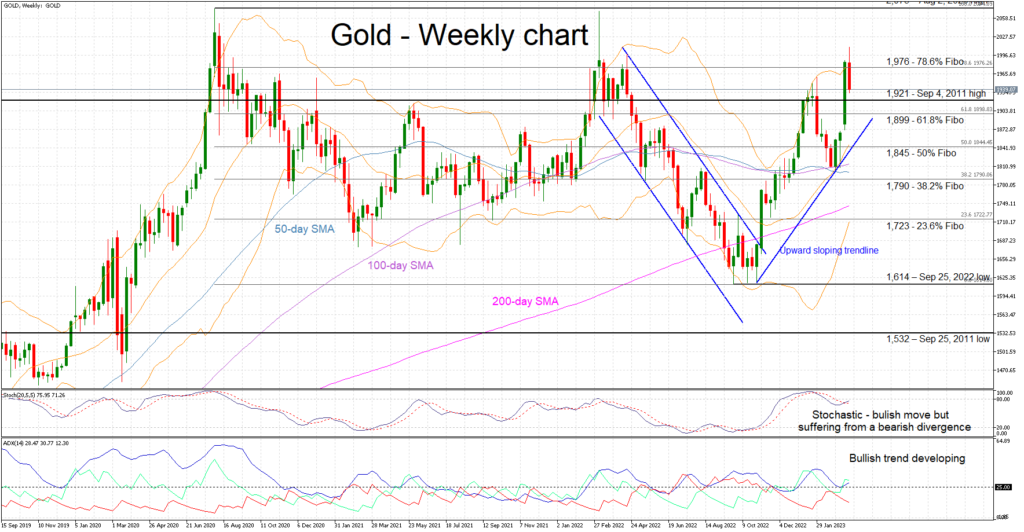
We start from the weekly chart and the aim is to find the long-term trend and key support/resistance levels. Gold has made an impressive rally since the September 2022 low of 1,614 and has traded again above the 2,000 threshold. This is the third time that gold has penetrated this key psychologically important area since August 2020. This is not unexpected considering the grave developments both economically and financially that the world has been going through since the Covid pandemic and more recently the soaring inflation phase.
The current price level remains above the various simple moving averages (SMAs) employed here and a key upward sloping trendline. In the meantime, the Average Directional Movement Index (ADX) is trading above the 25 level threshold, signaling a trending market. While the technical picture is still pointing to a bullish trend, the stochastic oscillator is trying to contradict it. The higher high in gold has been met with lower high by the stochastic oscillator. This bearish divergence could allow the bears to push the gold price lower, with the September 4, 2011 high of 1,921 being their first target.
Next step: Daily timeframe
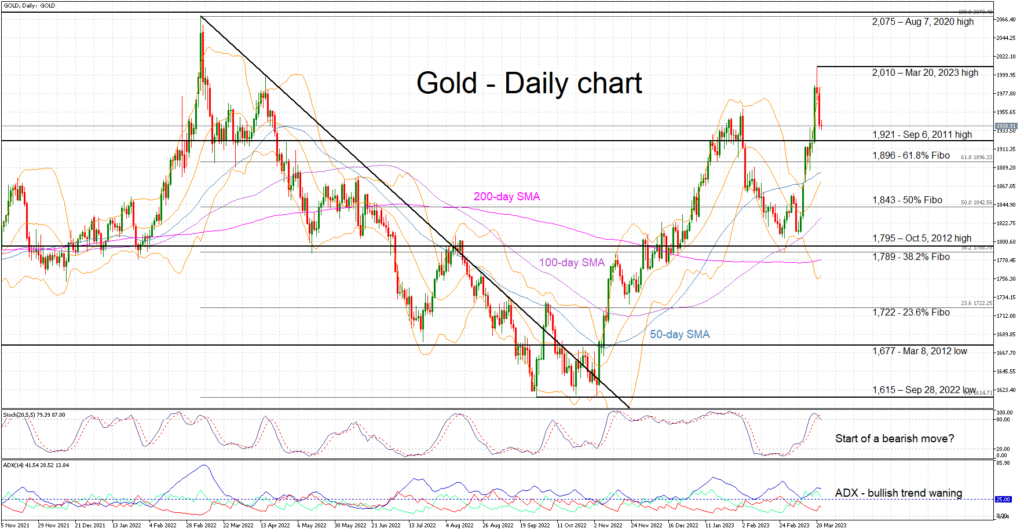
The daily chart is the favorite among traders and attracts the biggest interest. In addition to key levels, we focus on local peaks and troughs, and start to pay more attention to the SMAs and Fibonacci retracement levels.
The strong rally seen since March 8 has pushed to 2,010, the highest level since March 9, 2022. Gold has been dropping in the past three sessions, as the overall market sentiment appears to have improved somewhat from last week. This is depicted in the ADX where the bullish trend appears to top out. Similarly, the stochastic oscillator is trying to break below its overbought territory. Such a move could provoke a bearish reaction with the September 6, 2011 high of 1,921 standing nearby. This area appears to trouble the bears when examining gold’s performance during the March-April 2022 and January 2023 period respectively. Such a correction though could even suit the bulls considering the aggressive rally last week, provided that the next local trough is above the 1,800 area.
Third step: 4-hour timeframe
Long-term investors would be content with the weekly and daily analysis while very short-term trades would look at the 4-hour chart very briefly before delving into the 1-hour and 15-minute timeframes. For our purpose, the 4-hour seems sufficient to understand the shorter-term dynamics, identify the key levels for potential entry and exit in the market.
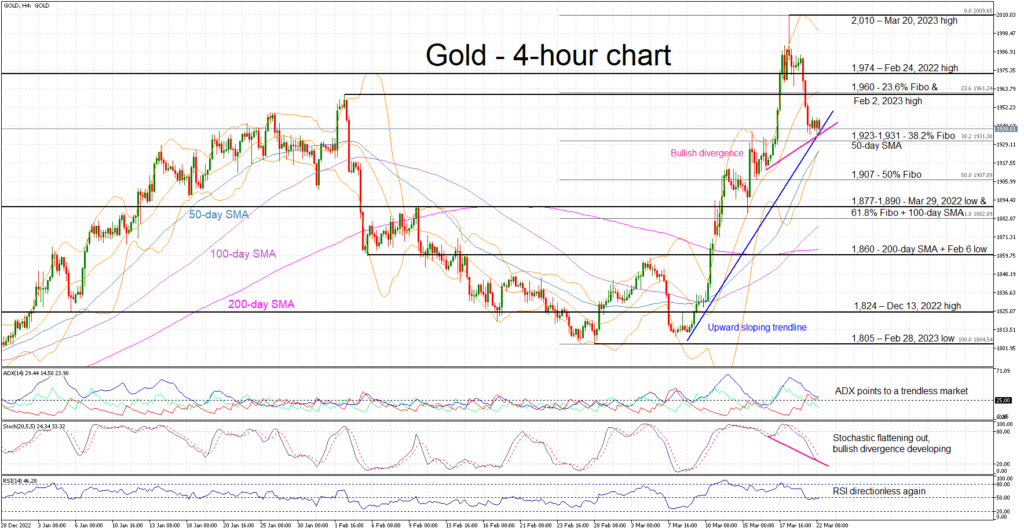
Gold has recorded an impressive move since the March 8 lows, pushing above the 2,000 psychological level. A correction has occurred in the three daily sessions as the market is trying to find a new balance around the 1,840 area. The overall technical picture is pointing to a more balanced market, potentially preparing for the next move. The ADX is just above its “trendless” territory and the RSI is hovering around its 50-midpoint. In addition, the stochastic oscillator appears to be flattening out just above its oversold area.
However, the bulls might be able to find courage from the courage for a developing bullish divergence (pink line at the 4-hour chart). The higher low in gold’s price action has been met by a lower low in the stochastic. The next resistance would come at 1,960, the 23.6% Fibonacci retracement of the February 28 – March 23 uptrend and the February 2 high. On the other hand, the bears would have to battle with the March 9 upward sloping trendline and eventually the combination of the 38.2% Fibonacci retracement and the 50-day SMA at the 1,923-1,931 range.
Putting everything together
The process of examining multiple timeframes tends to be time-consuming, but it remains a better way of analyzing the market. The timeframes examined can be adjusted to the profile of each trader, but we believe that the above top-down process should feature in every traders’ armory. Regarding gold analysed here:
- In the weekly chart, the bullish trend remains in place. Bears need a break below the 1,850 to change the market’s fate.
- The correction appears to have legs considering the current momentum indicators and provided that the bears manage to break the 1,920 area.
- The overall picture points to balanced market although a bullish divergence and a weakening bullish trend could reignite the bulls’ appetite.


