
DXY:
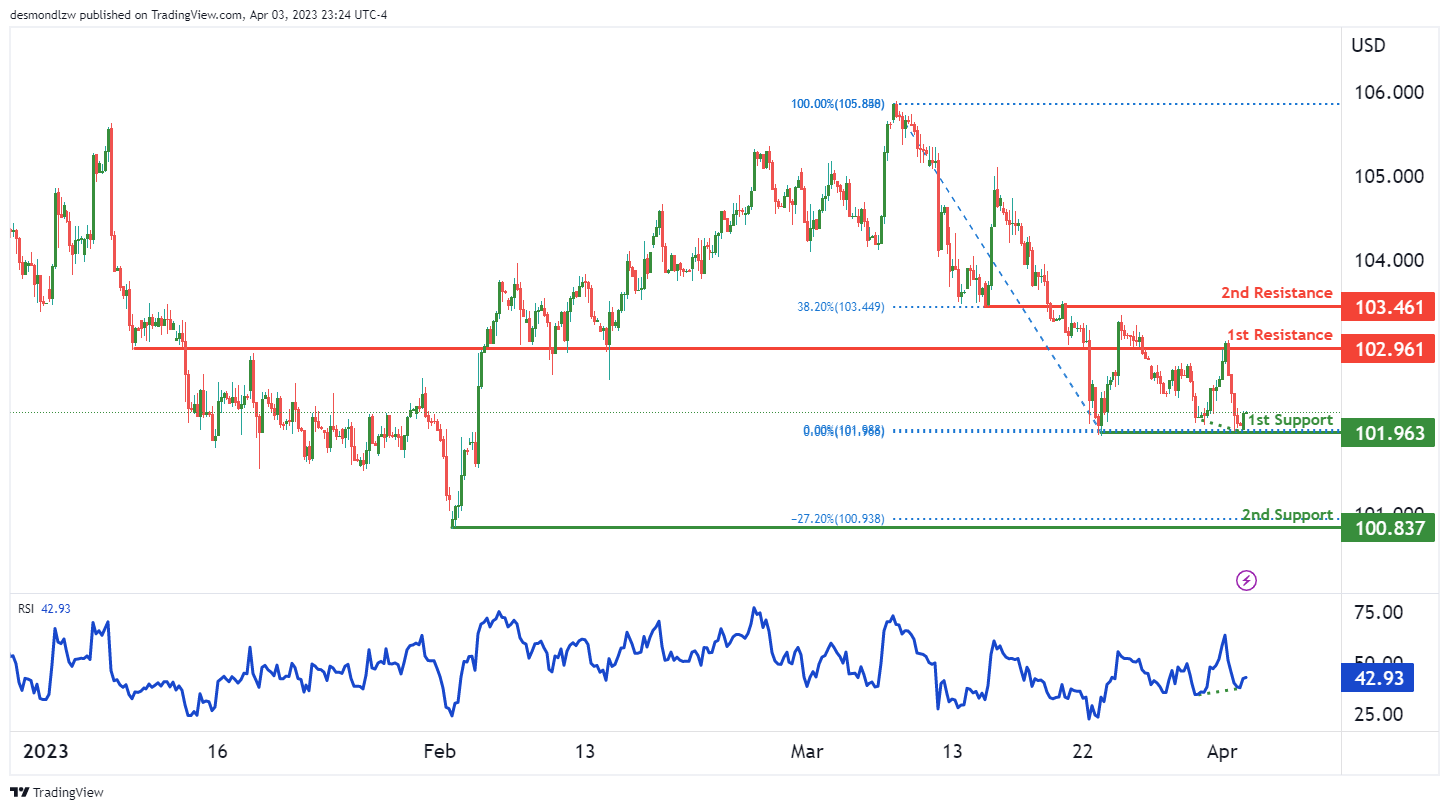
Looking at the DXY chart, the overall momentum is bullish, which suggests that prices may continue to rise. The current price could potentially make a bullish bounce off the first support level of 101.96, which is a multi-swing low support level. If the price bounces off this level, it could head towards the first resistance level at 102.96, which is an overlap resistance level.
In case the price breaks above the first resistance level, it could potentially reach the second resistance level at 103.46, which is also an overlap resistance level. On the other hand, if the price breaks below the first support level, the next support level is at the second support level of 100.83, which is a swing low support level.
It’s worth noting that the RSI is also displaying bullish divergence versus the price, which suggests that a bounce might occur soon.
EUR/USD:
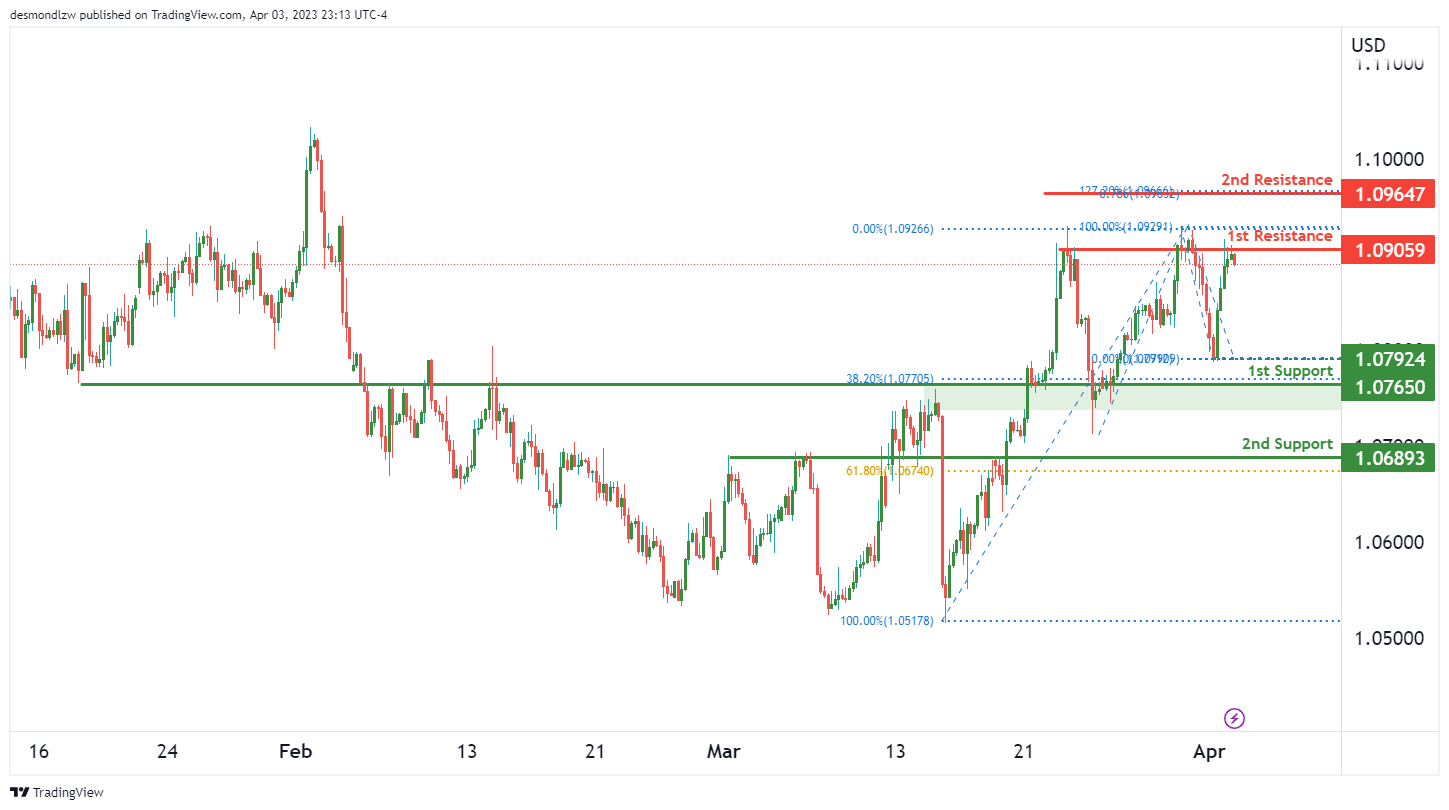
On the EUR/USD chart, the overall momentum is bearish, indicating a potential for a bearish reaction from the 1st resistance level. The 1st resistance level is at 1.0905, which is a multi-swing high resistance level. If price were to drop from this level, it could potentially reach the 1st support level at 1.0765. This level is a strong overlap support that also coincides with a 38.20% Fibonacci retracement.
The 2nd support level is at 1.0689, which is another overlap support level that coincides with a 61.80% Fibonacci retracement.
On the resistance side, the 2nd resistance level is at 1.0964, which is a swing high resistance level that coincides with a 127.20% Fibonacci extension. The 1st support level is at 1.0792, which is a swing low support level.
GBP/USD:
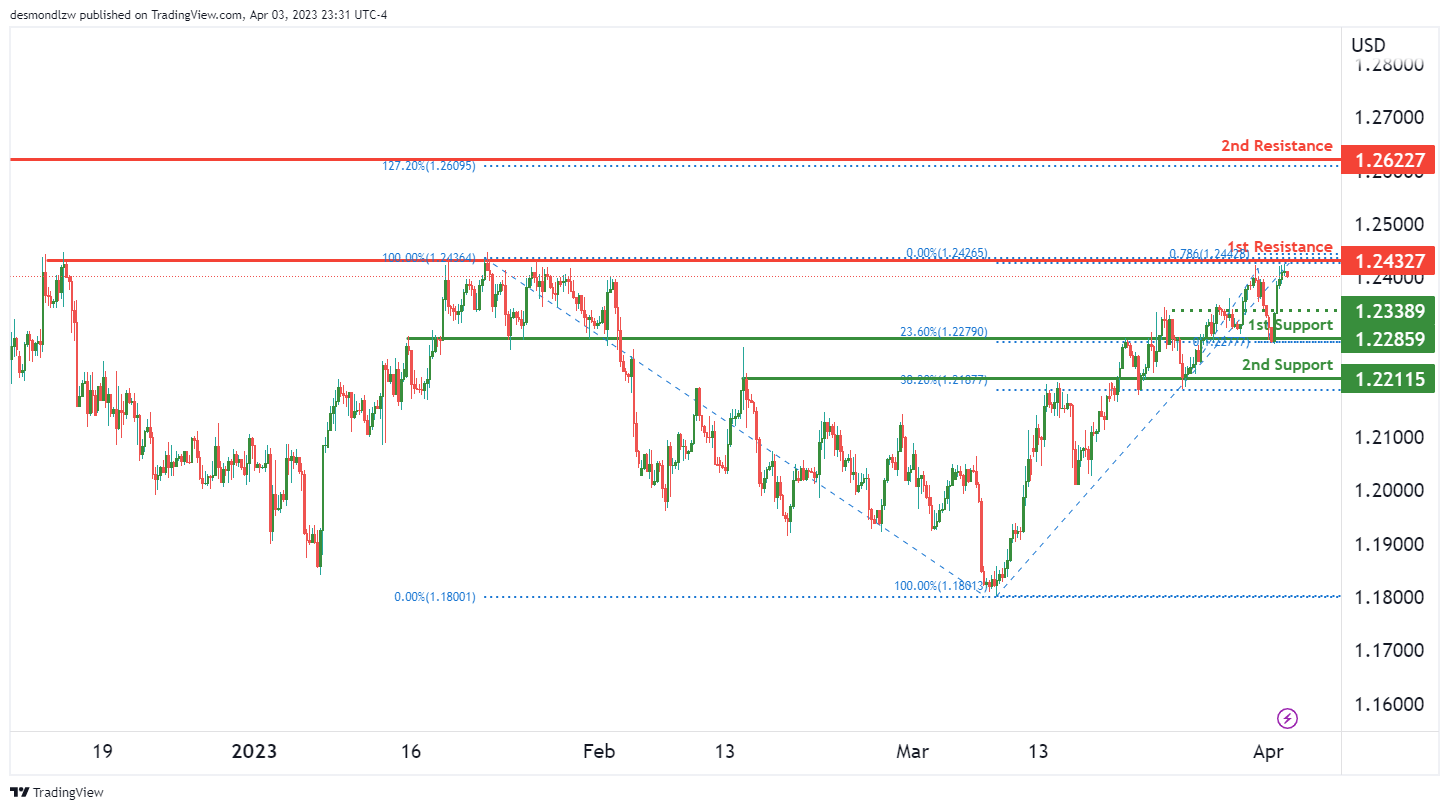
The overall momentum of the GBP/USD chart is bearish. Price could potentially make a bearish reaction off the 1st resistance and drop to the 1st support. The 1st support is at 1.2285, which is an overlap support level and has a 23.60% Fibonacci retracement lining up with it. Additionally, the 2nd support at 1.2211 is another overlap support level with a 38.20% Fibonacci retracement.
On the resistance side, the 1st resistance level is at 1.2432, which is a multi-swing high resistance level. This level coincides with a 78.60% Fibonacci projection. The 2nd resistance level is at 1.2622, which is a swing high resistance level that coincides with a 127.20% Fibonacci extension.
There is also an intermediate support level at 1.2338, which is an overlap support level. If price were to break below the 1st support level, the next level it could drop to is the 2nd support level. Conversely, if price were to break above the 1st resistance level, it could potentially rise towards the 2nd resistance level.
USD/CHF:
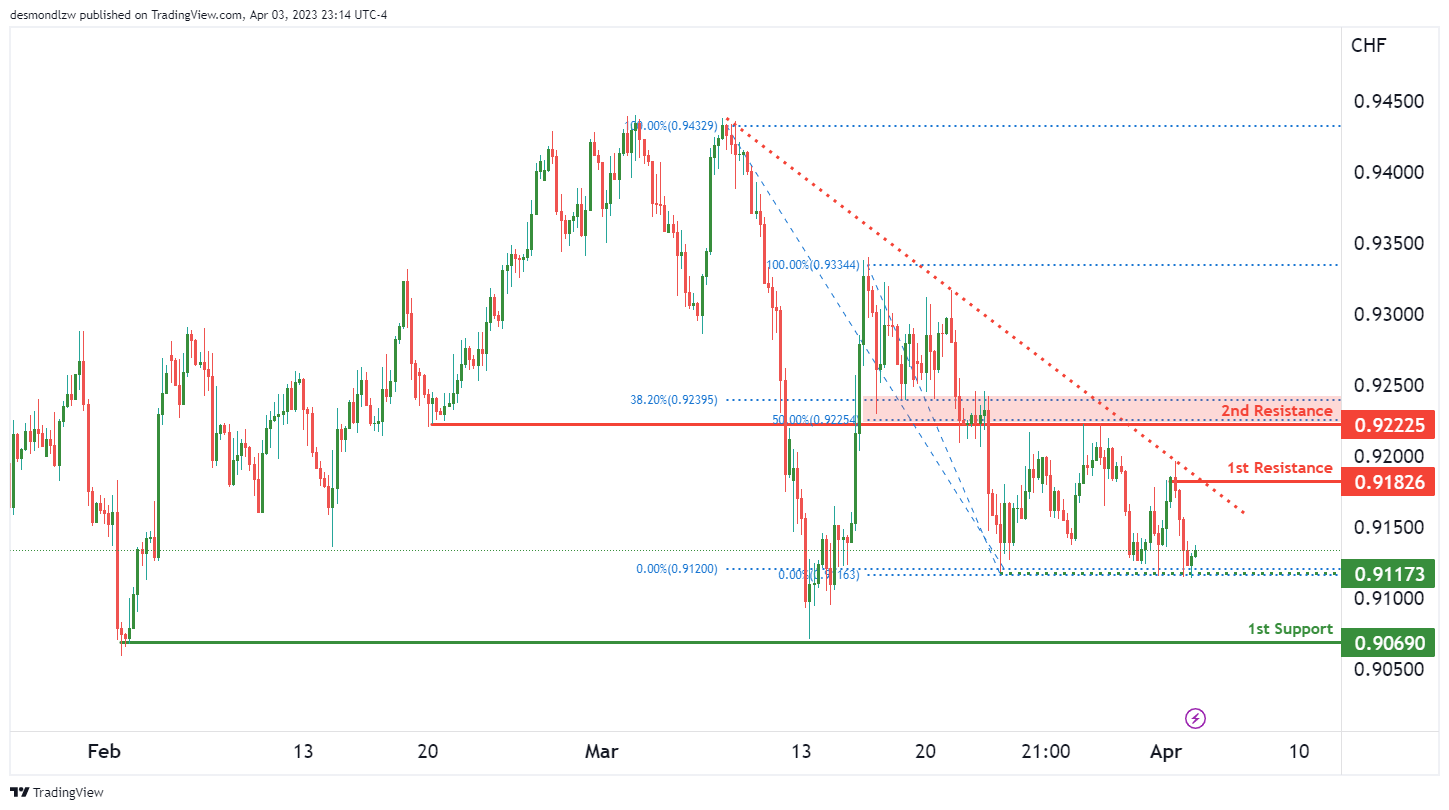
The USD/CHF chart is currently showing a bearish momentum as it is below a major descending trend line. However, there is potential for a bullish bounce off the 1st support level towards the 1st resistance level.
The 1st support level is at 0.9069, which is a swing low support. This level provides a good potential for a bullish bounce if price were to reach this level.
Additionally, there is an intermediate support level at 0.9117, which is a multi-swing low support. This level also adds further confluence to the potential bullish bounce.
On the upside, the 1st resistance level is at 0.9182, which is a swing high resistance. This level could potentially act as a barrier for price to push higher, but if it were to break above this level, price could continue to rise towards the next resistance level.
The 2nd resistance level is at 0.9222, which is an overlap resistance level. This level coincides with the 50% Fibonacci retracement, adding further confluence to this level.
It’s worth noting that there is also an intermediate support level at 1.2338, which is an overlap support level.
USD/JPY:
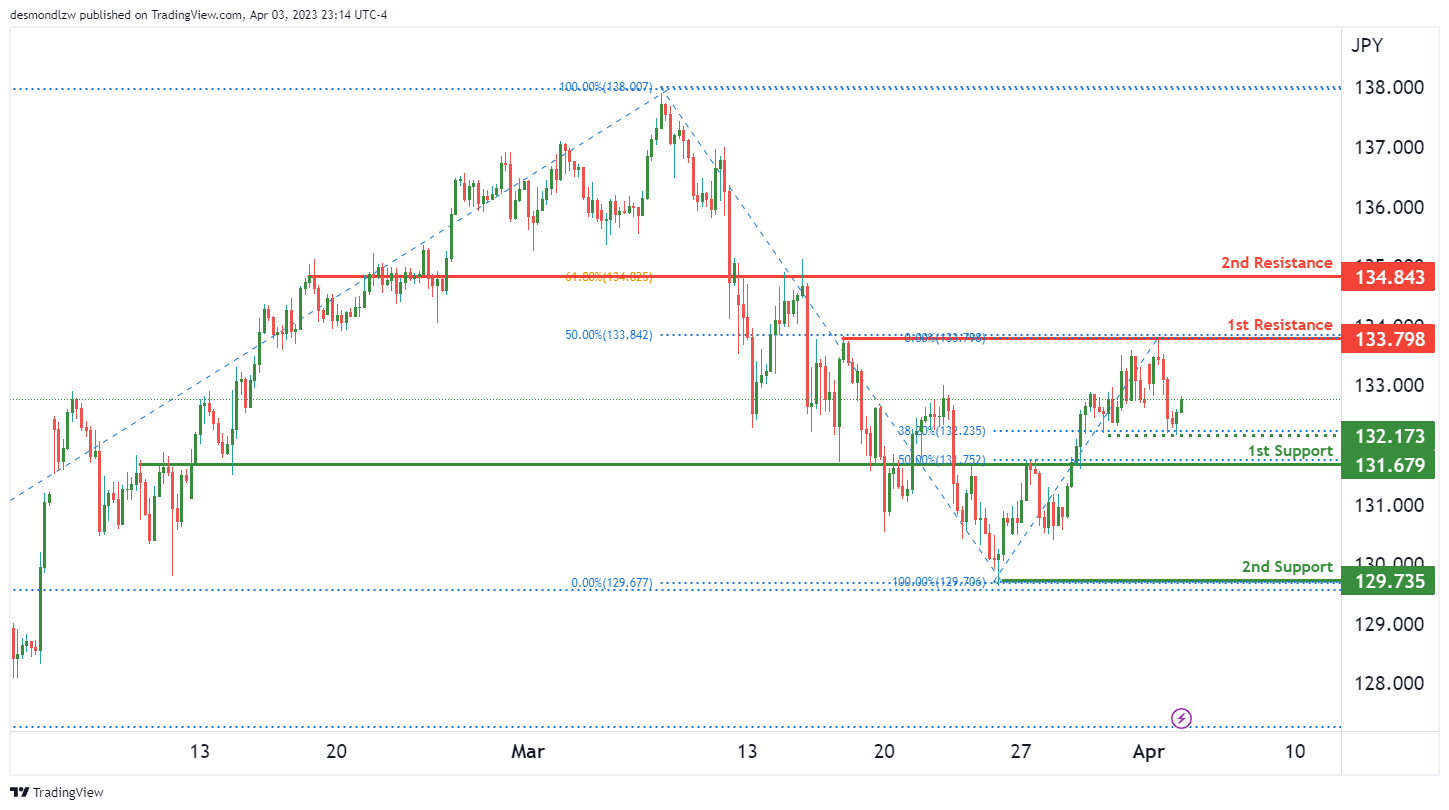
The USD/JPY chart, the overall momentum is bullish. There is a potential for a bullish continuation towards the first resistance level. The first support level is at 131.67, which is an overlap support level with a 50% Fibonacci retracement lining up with it. Additionally, the second support level is at 129.73, which is a swing low support level.
On the upside, the first resistance level is at 133.79, which is a multi-swing high resistance and coincides with a 50% Fibonacci retracement. The second resistance level is at 134.84, which is an overlap resistance and has a 61.80% Fibonacci retracement lining up with it.
There is also an intermediate support level at 132.17, which is a multi-swing low support. This level may also provide additional support for the potential bullish continuation.
AUD/USD:
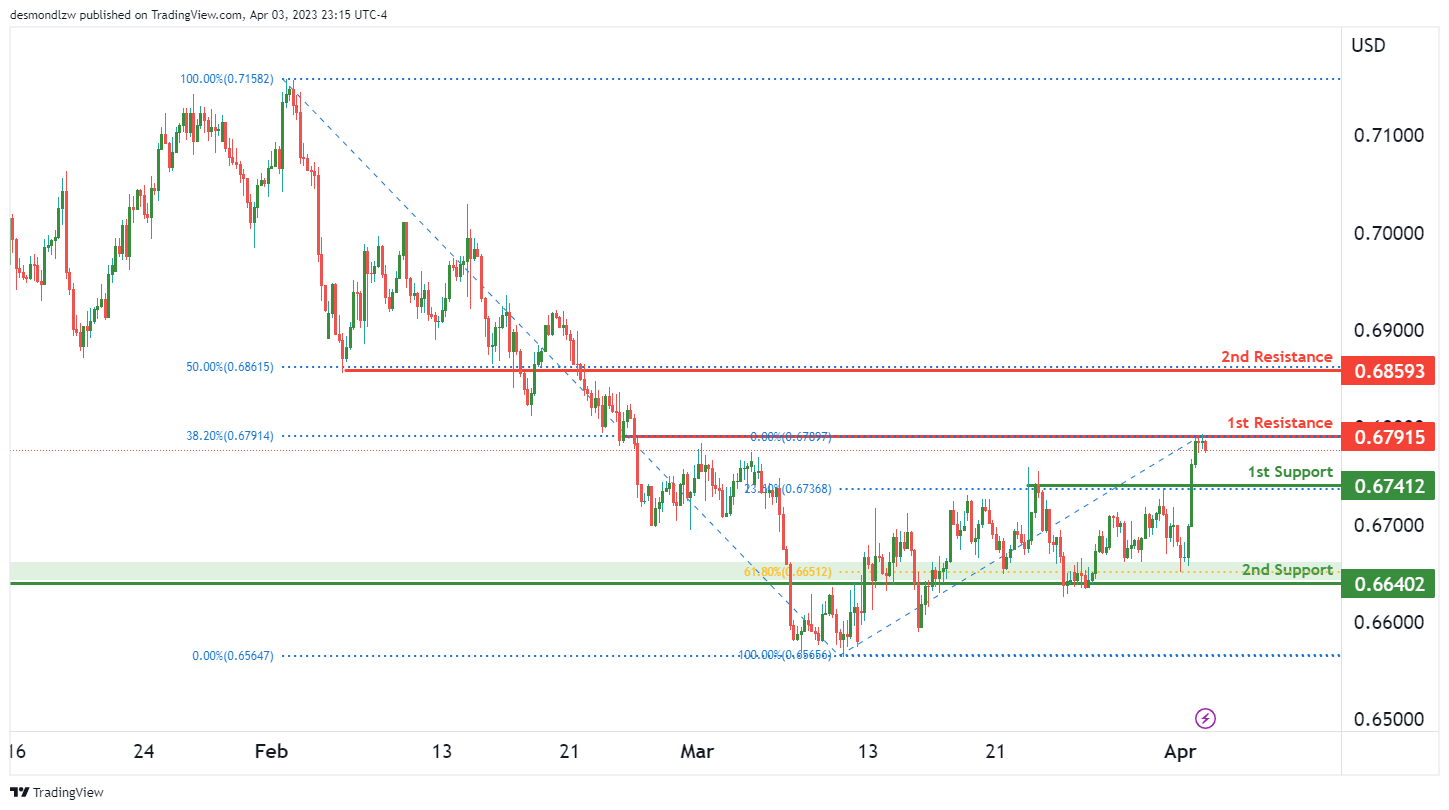
The AUD/USD chart shows a bearish momentum, with price potentially reacting bearishly towards the 1st support after reaching the 1st resistance. The 1st support level is at 0.6741, which is a pullback support level and also has a 23.60% Fibonacci retracement lining up with it. The 2nd support level is at 0.6640, an overlap support level that has a 61.80% Fibonacci retracement.
On the other hand, the 1st resistance level is at 0.6791, which is a multi-swing high resistance level that also has a 38.20% Fibonacci retracement. The 2nd resistance level is at 0.6859, an overlap resistance level with a 50% Fibonacci retracement.
It’s worth noting that the overall momentum of the chart is bearish, which could result in a bearish reaction towards the 1st support level after reaching the 1st resistance level.
NZD/USD:
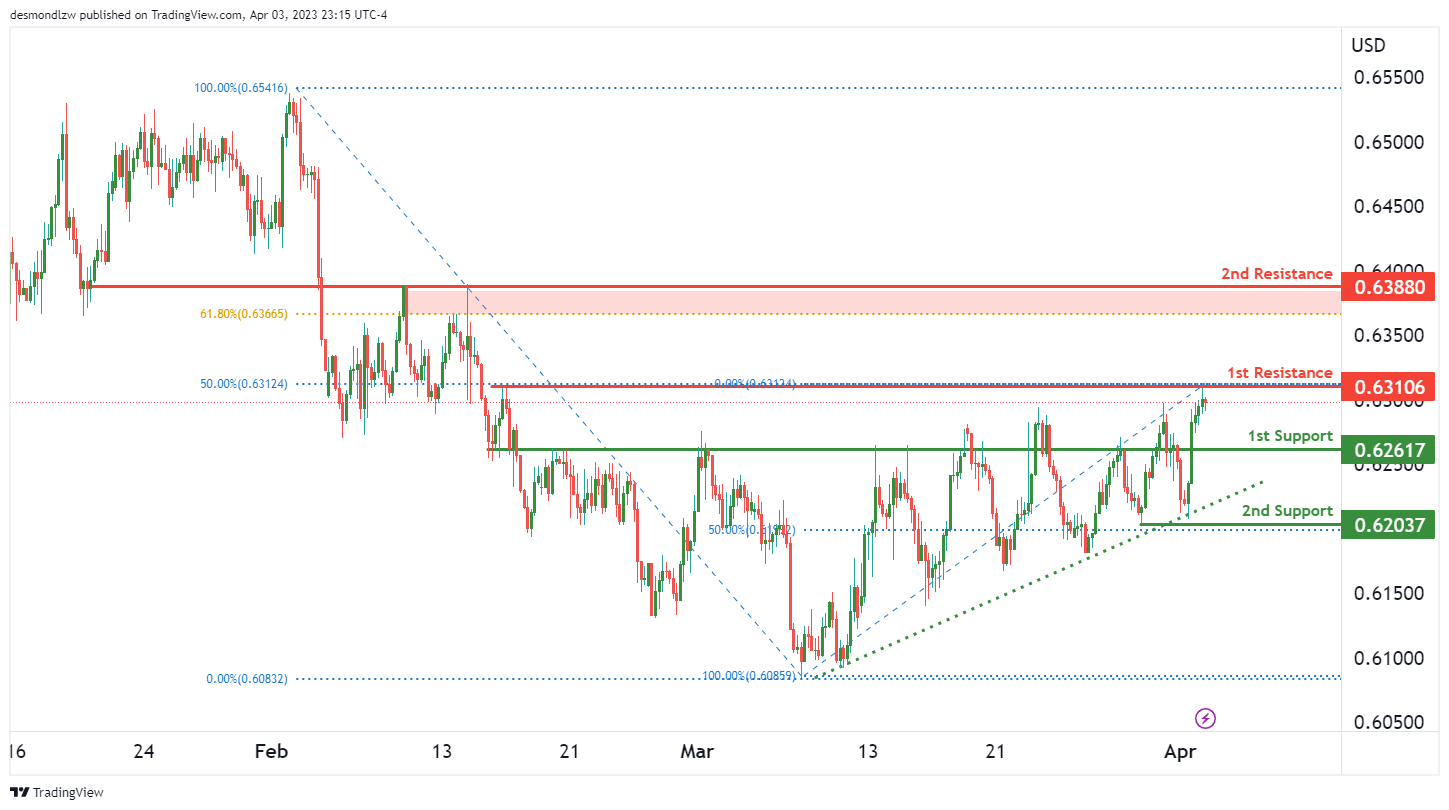
NZD/USD chart shows bullish momentum as it’s above a major ascending trend line, suggesting further bullish potential. However, price could potentially make a bearish reaction off the 1st resistance and drop to the 1st support.
The 1st support is at 0.6261, which is a strong overlap support level. If price were to drop from the 1st resistance, it could head towards this level. The 2nd support is at 0.6203, which is a multi-swing low support level that could provide additional support for price.
On the other hand, the 1st resistance is at 0.6310, which is a multi-swing high resistance level that coincides with the 50% Fibonacci retracement level. If price were to bounce from the 1st support, it could potentially rise towards this level. The 2nd resistance is at 0.6388, which is an overlap resistance level that coincides with the 61.80% Fibonacci retracement level.
It’s important to note that the bullish momentum is supported by the major ascending trend line, but a bearish reaction off the 1st resistance could lead to a drop towards the support levels.
USD/CAD:
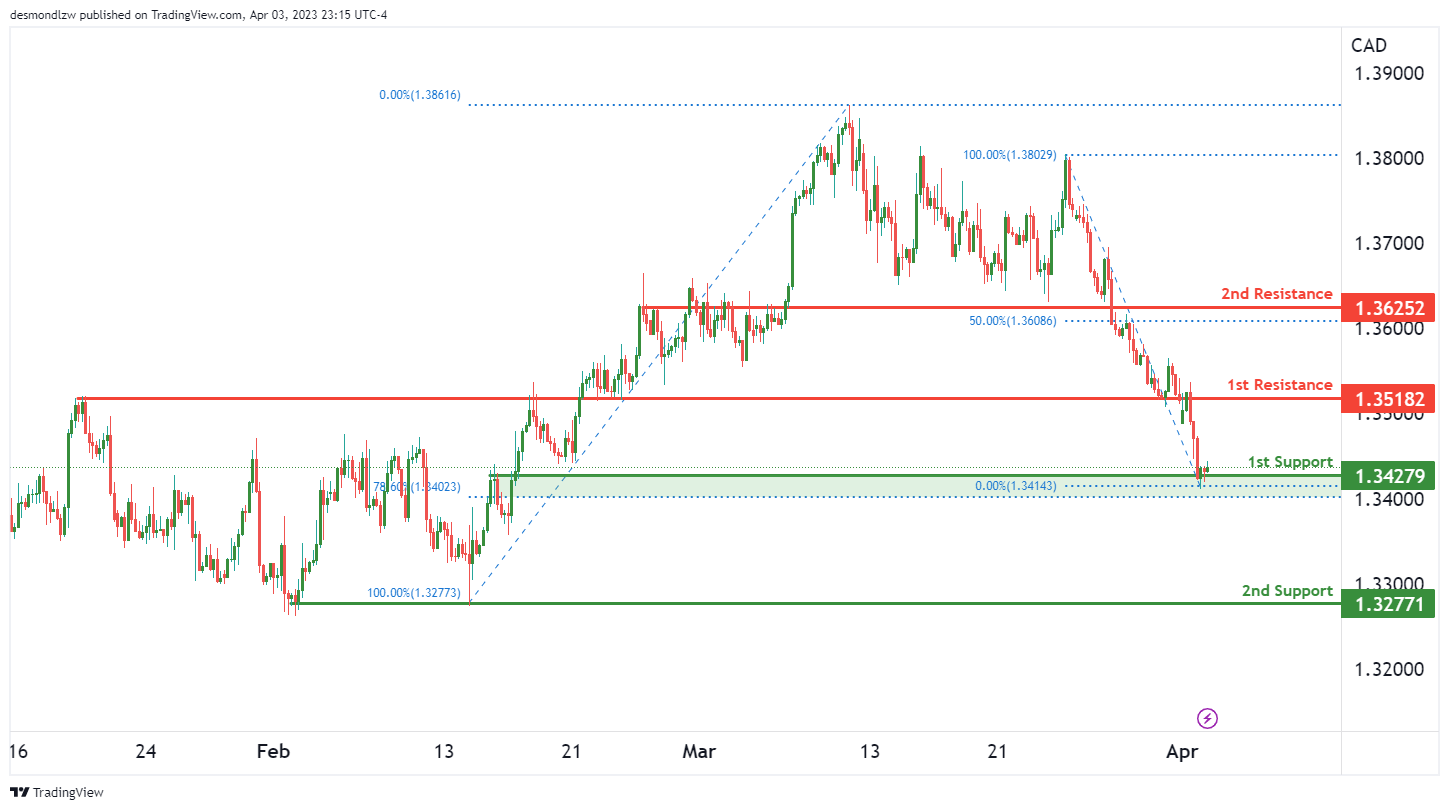
The USD/CAD chart is showing bullish momentum with the price potentially making a bullish bounce off the 1st support level towards the 1st resistance level. The 1st support level is located at 1.3427 and is a strong overlap support level that coincides with a 78.60% Fibonacci retracement. Additionally, there is a 2nd support level located at 1.3277 which is a multi-swing low support level. On the other hand, the 1st resistance level is located at 1.3518 and is another strong overlap resistance level. Furthermore, there is a 2nd resistance level at 1.3625 which is also an overlap resistance level that coincides with a 50% Fibonacci retracement.
It’s worth noting that the overall bias of the chart is bullish, and there is a potential for the price to rise from the 1st support level to the 1st resistance level. However, if the price breaks the 1st support level, the next support level it could drop to is the 2nd support level at 1.3277.
Additionally, it’s important to consider the chart’s momentum. The chart is currently showing bullish momentum and this could support a bullish bounce off the 1st support level.
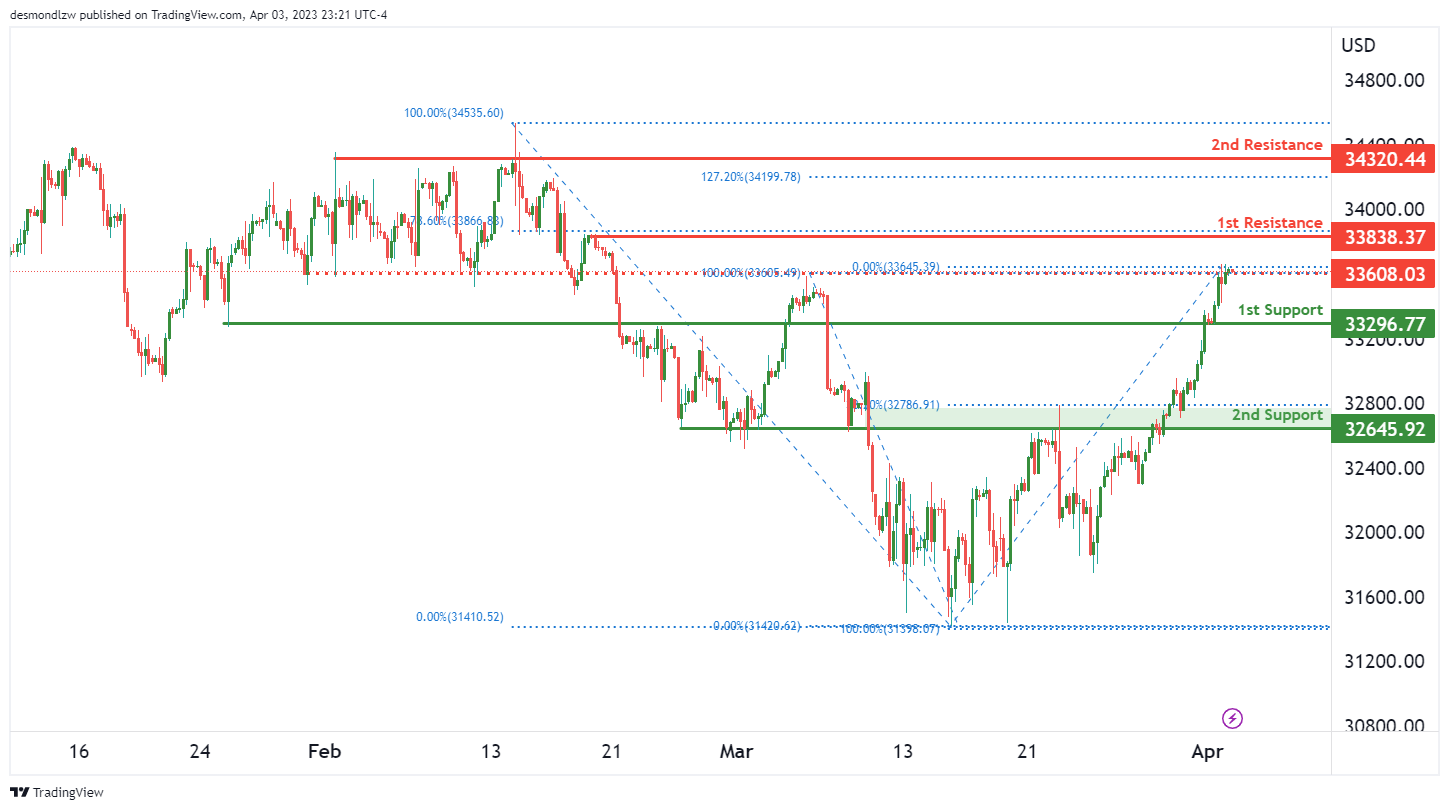
DJ30:
The DJ30 chart is showing bearish momentum with potential for a bearish reaction off the 1st resistance level. The 1st support level at 33296 is a strong overlap support, which could potentially provide a bounce if price were to drop to this level. If the 1st support level is broken, price could potentially drop to the 2nd support level at 32645, which is also an overlap support.
On the resistance side, the 1st resistance level at 33838 is a swing high resistance, and is also supported by a 78.60% Fibonacci retracement level. If price were to break above this level, it could potentially rise towards the 2nd resistance level at 34320, which is a multi-swing high resistance and is also supported by a 127.20% Fibonacci extension level. There is an intermediate resistance level at 33608, which is an overlap resistance and could potentially act as a barrier to price movement towards the 1st resistance level.
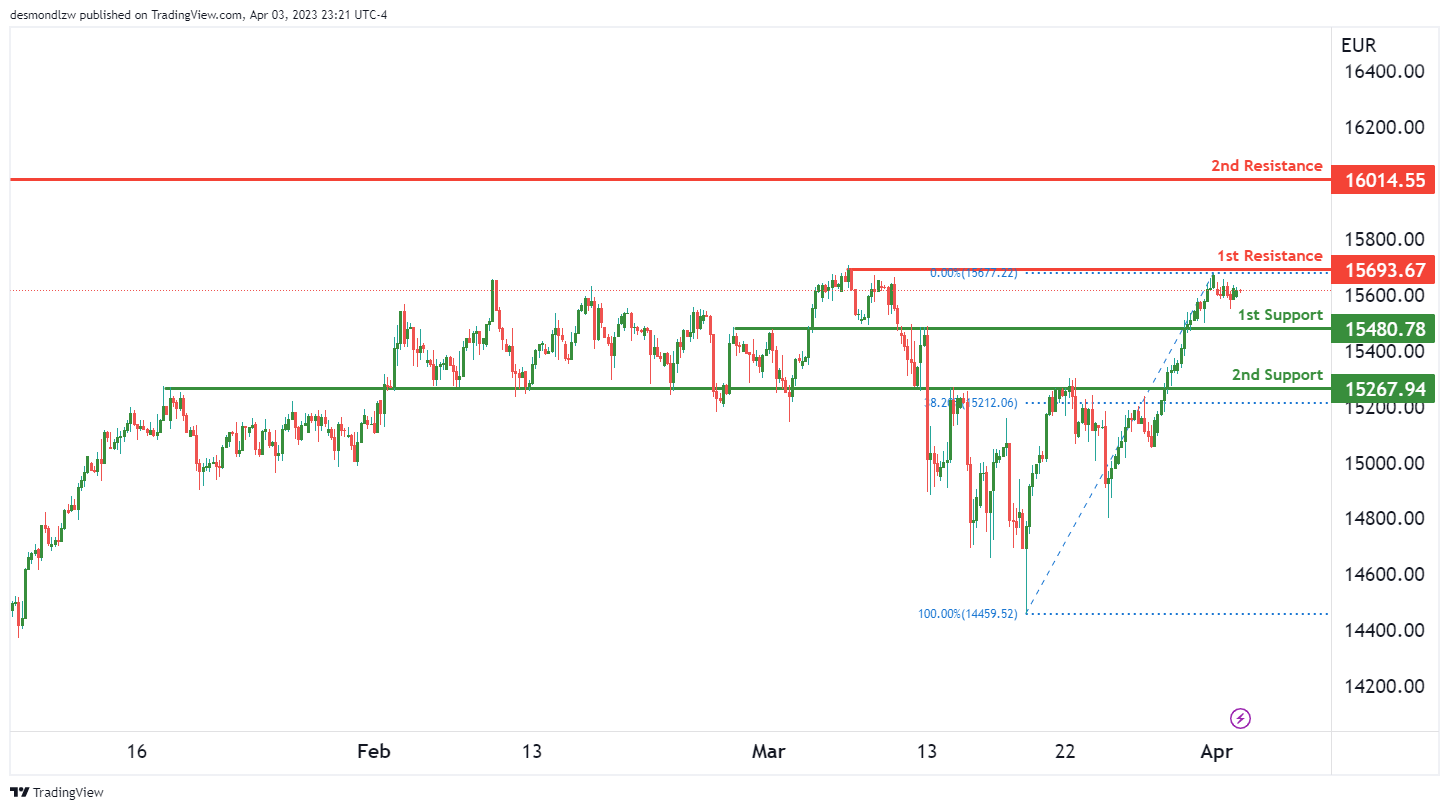
GER30:
The German DAX 30 index (GER30) has been experiencing a bearish momentum, with prices potentially continuing to fall towards the 1st support level.
Currently, the overall momentum of the chart is bearish, and the price is potentially making a bearish continuation towards the 1st support level at 15480.78. This support level is an overlap support, providing a strong reason to believe it will hold. In addition, there is a 38.20% Fibonacci retracement lining up with the 2nd support level at 15267.94, making it another good support level to watch.
On the resistance side, the 1st resistance level is at 15693.67, which is a multi-swing high resistance level that could prevent price from rising. If the price breaks above this level, the next resistance level is at 16014.55, which is a swing high resistance level.
Based on the current bearish momentum and the strong support levels, it is likely that prices will continue to drop towards the 1st support level. However, if the price breaks above the 1st resistance level, it could potentially rise towards the 2nd resistance level.
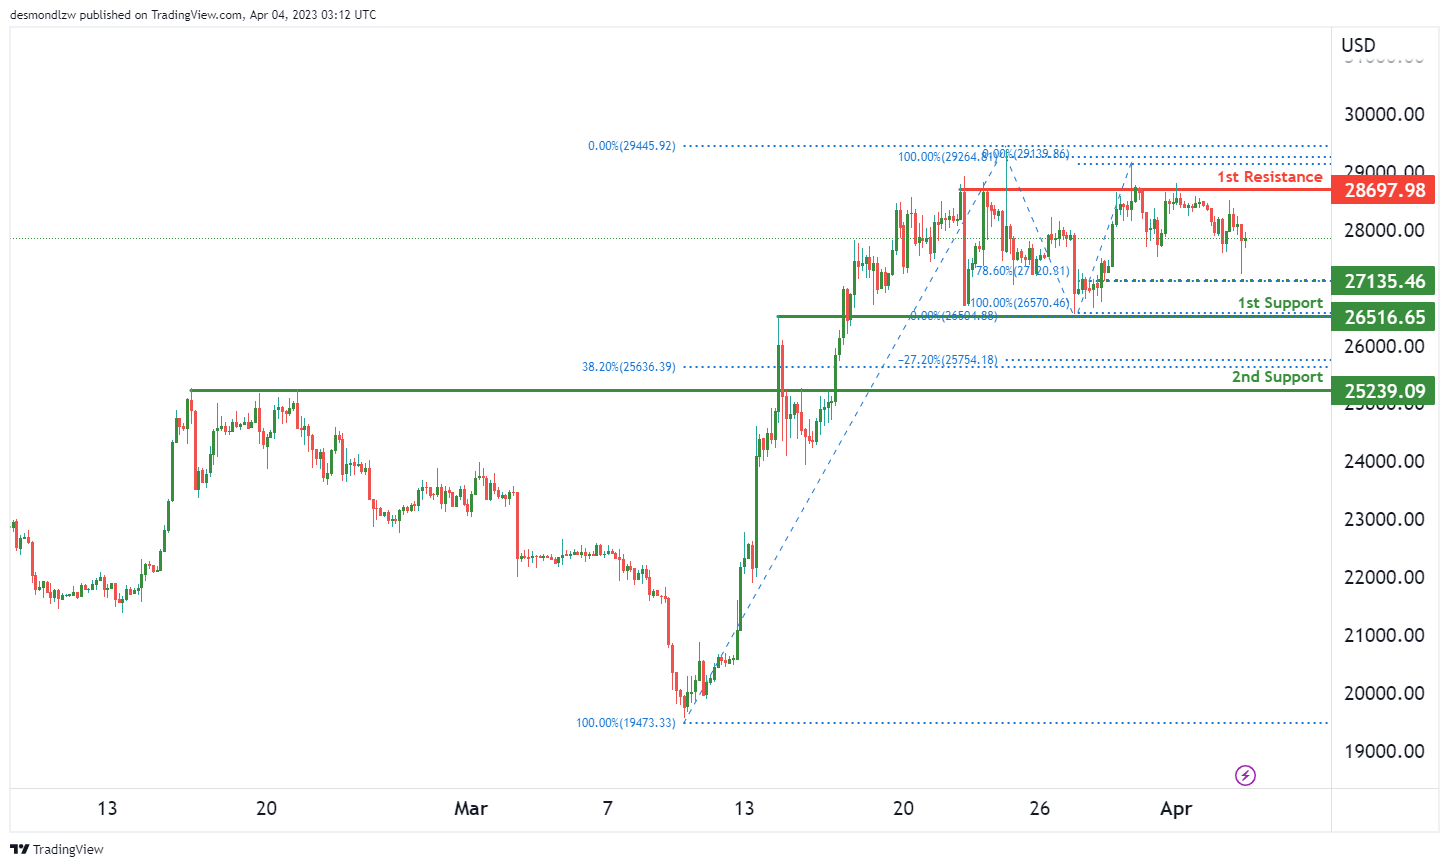
BTC/USD:
The BTC/USD chart is bearish, which suggests that the cryptocurrency might continue to experience downward pressure in the near term.
Looking at the support and resistance levels, price could potentially make a bearish continuation towards the first support level at 26516.65, which is an overlap support. If price were to break below that level, it could drop further to the second support level at 25239.09, which is also an overlap support and lines up with the 38.20% Fibonacci retracement.
On the other hand, if price were to rebound from the current levels, it may face resistance at the first resistance level of 28697.98, which is a multi-swing high resistance.
It’s worth noting that there is an intermediate support at 27135.46, which is a swing low support. If price were to drop below this level, it could potentially trigger a stronger bearish acceleration towards the support levels mentioned earlier.
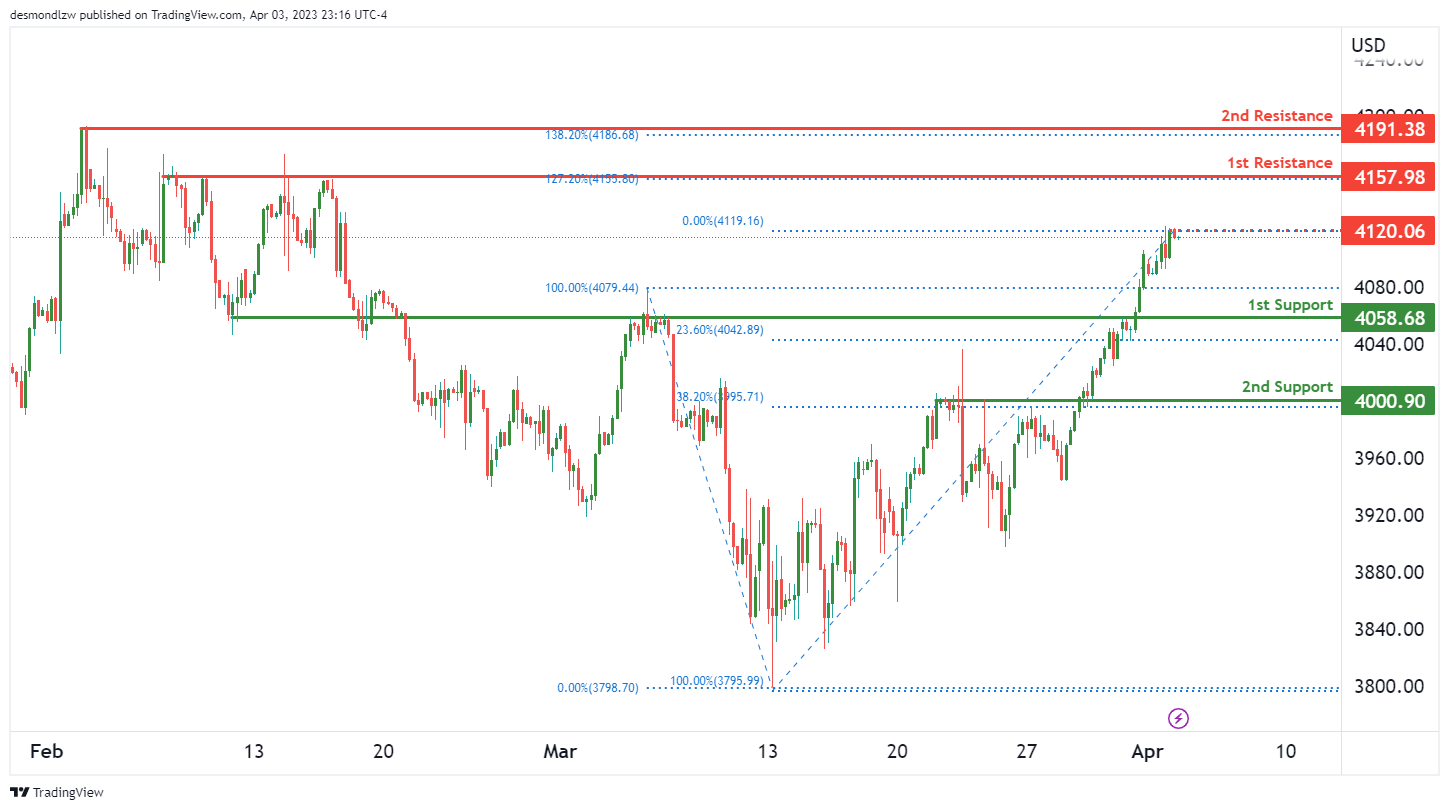
US500
The overall momentum of the US500 chart is bullish. There is potential for the price to continue its bullish momentum towards the 1st resistance level of 4157.98.
The 1st support level at 4058.68 is a good level as it is a pullback support and coincides with the 23.60% Fibonacci retracement. The 2nd support level at 4000.90 is also a good level as it is a pullback support and coincides with the 38.20% Fibonacci retracement.
The 1st resistance level at 4157.98 is a strong multi-swing high resistance and coincides with the 127.20% Fibonacci extension. The 2nd resistance level at 4191.38 is also a good level as it is a swing high resistance and coincides with the 138.20% Fibonacci extension.
In addition, there is an intermediate resistance level at 4120.06, which can act as a potential barrier for the price.
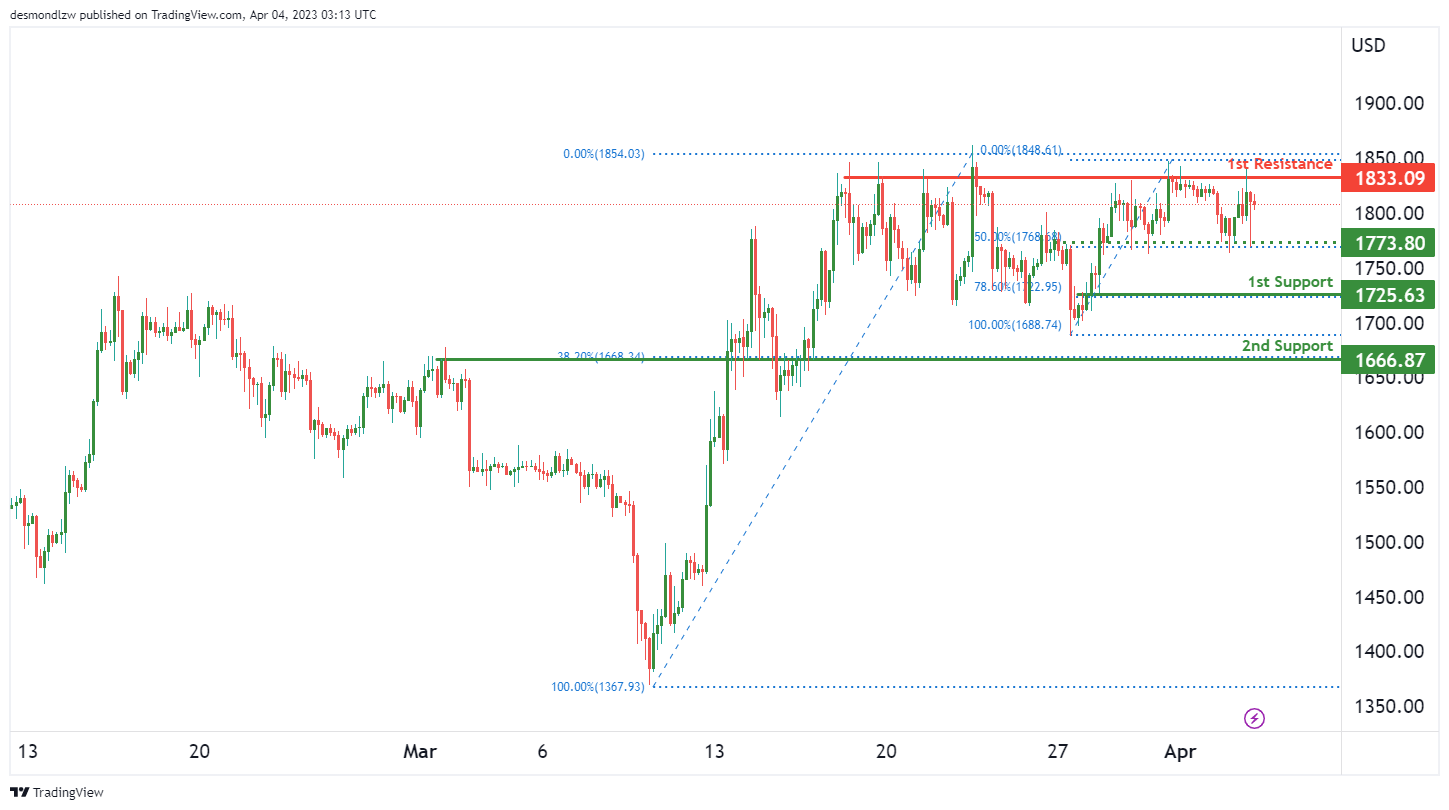
ETH/USD:
The overall momentum of the ETH/USD chart appears to be bearish at the moment, as the price is showing signs of a potential continuation towards the first support level. Let’s take a closer look at the support and resistance levels to get a better idea of where the price may be headed next.
The first support level is located at 1725.63, which is a strong overlap support level and coincides with a 78.60% Fibonacci retracement. This level could potentially provide a bounce for the price and act as a support level in case of a further downtrend.
If the price were to break below the first support level, the next support level to watch for is at 1666.87, which is another overlap support level and lines up with a 38.20% Fibonacci retracement. This level has acted as a support level multiple times in the past and could potentially do so again in the future.
On the resistance side, the first level to watch for is at 1833.09, which is a multi-swing high resistance level. If the price were to break above this level, it could potentially indicate a bullish reversal and lead to further upside.
An intermediate support level to watch for is at 1773.80, which is another overlap support level and lines up with a 50% Fibonacci retracement. This level could potentially act as a support level in case of a minor pullback.
WTI/USD:
The overall momentum of the WTI chart is currently bearish, suggesting that prices could continue to move lower. Looking at the chart, we can see that the price could potentially make a bearish continuation towards the first support level.
The first support level is at 77.05, which is a swing low support that lines up with a 23.60% Fibonacci retracement. This level could potentially act as a support for the price and prevent it from falling further. The second support level is at 73.88, which is a pullback support.
On the upside, the first resistance level is at 82.35, which is a multi-swing high resistance. If the price were to break above this level, it could potentially rise towards the second resistance level at 86.86, which is a swing high resistance that lines up with a 127.20% Fibonacci extension.
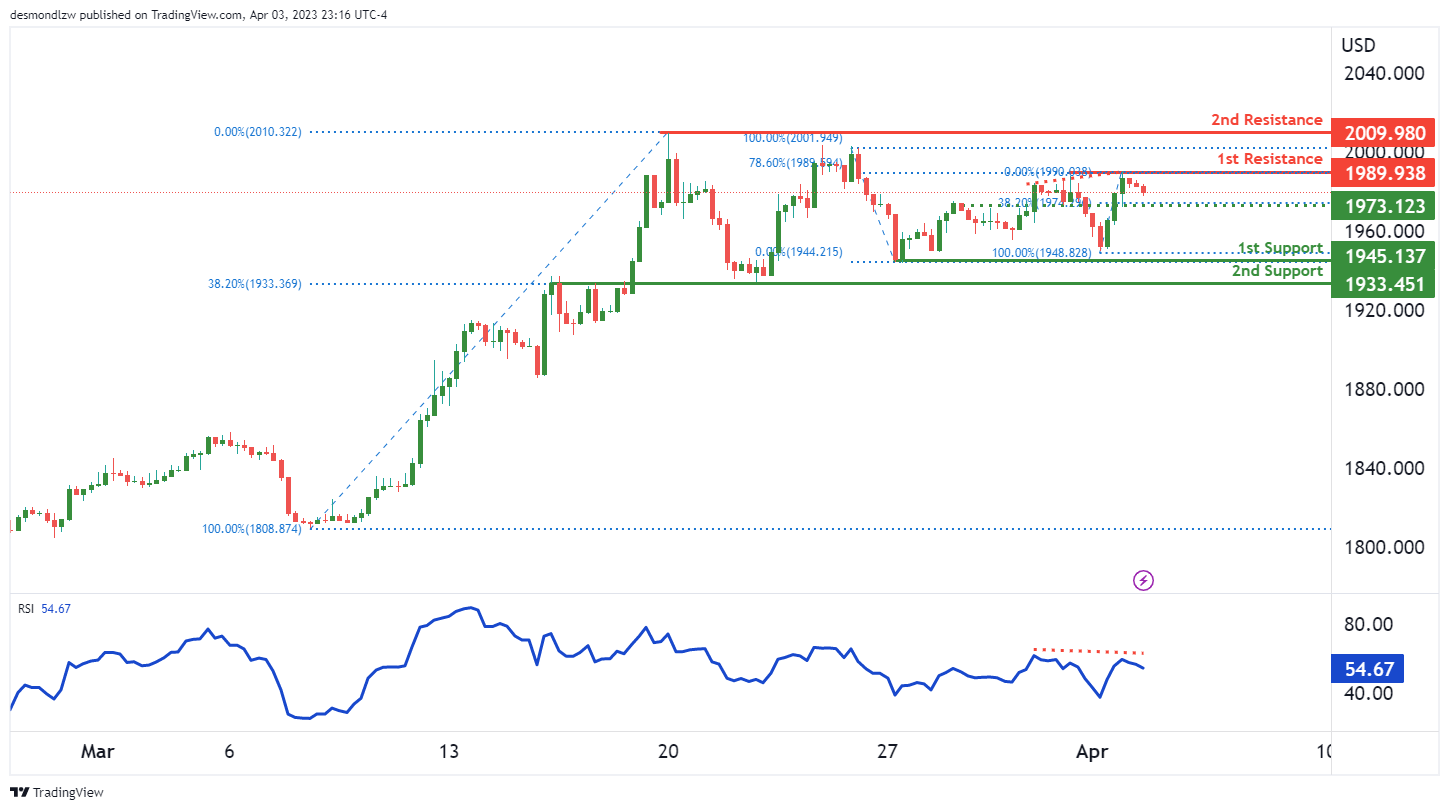
XAU/USD (GOLD):
XAU/USD’s Bearish Momentum Could Push Prices Towards First Support
Gold has been facing bearish momentum on the chart against the US Dollar, as reflected by the multi-swing high resistance at 1789.00. The overall bias is bearish, and the precious metal could continue to fall towards the first support at 1945.00.
The first support level is a multi-swing low support, which could provide some strength to the price action. If the price fails to hold this support, it may drop further to the second support at 1933.00. This level is an overlap support and coincides with the 38.20% Fibonacci retracement.
On the upside, the first resistance level is a multi-swing high resistance at 1789.00. A bullish breakout above this level could indicate a trend reversal, but until then, the momentum remains bearish. The second resistance level is a swing high resistance at 2009.00.
An intermediate support level at 1973.00 may offer some relief to the bearish trend. This level is an overlap support and coincides with the 38.20% Fibonacci retracement.
It’s worth noting that the RSI is displaying bearish divergence versus price, which could suggest that a reversal might occur soon.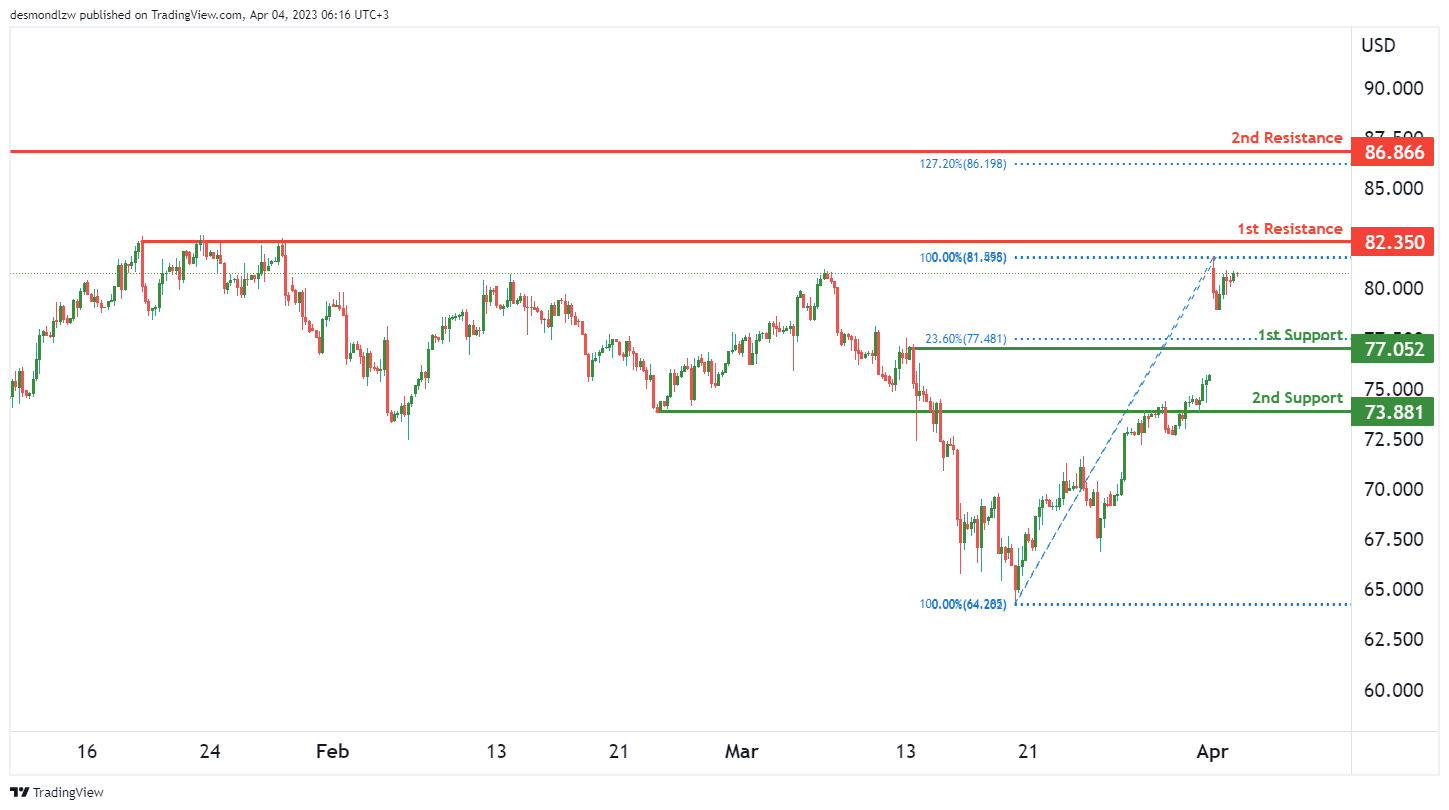


