
BTCUSD – Hammer Pattern Is Above $26,529
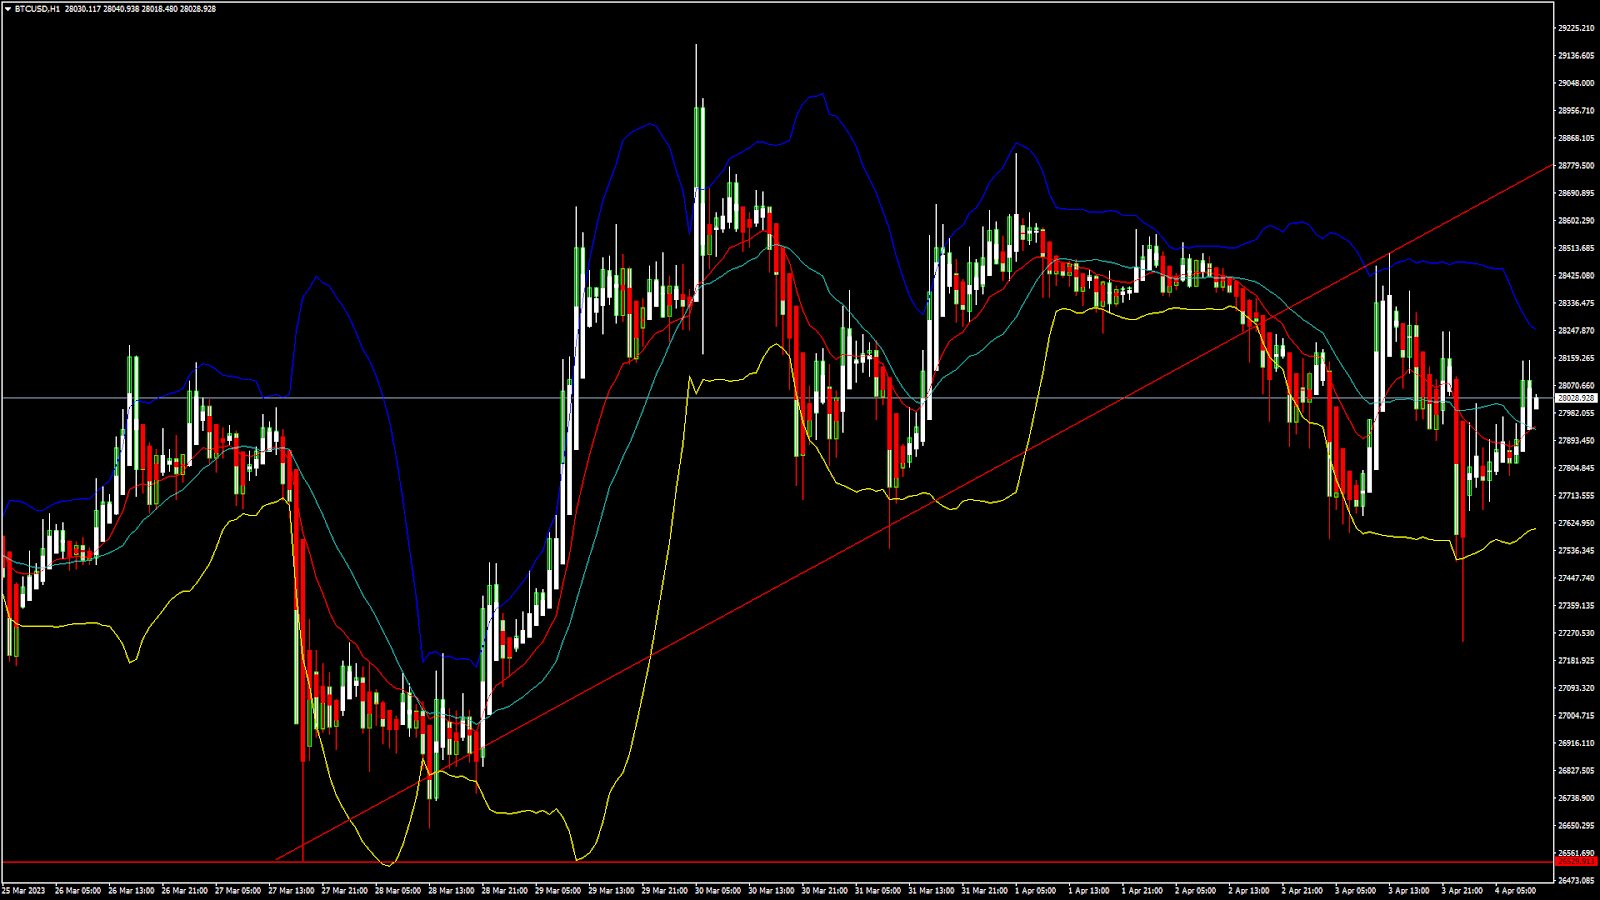
Last week, the bearish momentum in Bitcoin price didn’t sustain, and after touching the low of $26,529 on 27th March, the prices started to correct upwards against the US Dollar and touched the high of $29,171 on 30th March.
At the beginning of the week, Bitcoin is ranging near a NEW record 1-month high. We can clearly see a hammer pattern above $26,529, which signals a downtrend reversal.
Bitcoin touched an intraday low of $27,244 in the Asian trading session and an intraday high of $28,144 in the European trading session today.
The Williams percent range indicator is back over -50 in the daily timeframe, indicating a bullish trend.
Both the STOCH and STOCHRSI are reflecting overbought conditions, which means that in the immediate short term, a decline in the prices is expected.
The price is back over the pivot point in the daily timeframe, which stands for the bullish nature of the markets.
The relative strength index is near 53, which is a sign of a NEUTRAL demand for Bitcoin and a shift towards the consolidation phase in the markets.
Bitcoin is above a 200-hour simple moving average and above a 200-hour exponential moving average.
The average true range is indicating lower market volatility with a bullish momentum.
- Bitcoin bullish reversal is seen above $26,529.
- The RSI remains above 50, indicating a bullish market.
- The price is now trading above its pivot level of $28,028.
- Short-term range is moderate BULLISH.
- Some major technical indicators signal that the price may move to $28,500 and $29,000 soon.
Bitcoin Bullish Reversal Seen Above $26,529
The prices of Bitcoin have been successful in crossing the $29,000 resistance, and now we are looking for fresh upsides in the range of $30,000 and $32,000.
With the continued support seen at lower levels, we can see the formation of an ascending channel which may push the prices of Bitcoin above $30,000.
There is also a bullish crossover pattern with the 20-period and 50-period adaptive moving averages in the 4-hour timeframe.
A support zone is located at $26,547, where the price crosses the 18-day moving average, and at $27,144, which is the first support of the pivot point indicator.
BTCUSD is now facing its classic resistance level of $28,188 and Fibonacci resistance level of $28,286, breaking which the price will be able to move to $29,000.
There is an increase of 31.90% in the daily trading volume, which is normal. The short-term outlook for Bitcoin is bullish, the medium-term outlook has turned bullish, and the long-term outlook remains neutral under present market conditions.
The Week Ahead
We can see that Bitcoin has now resumed its long-term uptrend with the current support at $16,538 formed on 1st January 2023, which marked the end of the crypto winter.
Now the price of Bitcoin is ranging near the triangle’s support in the 1-hour chart, reflecting bullish sentiment.
The immediate expected target is $30,000, after which we may see some consolidation in the zone of the $29,500 level.
Daily RSI is at 59.72, which indicates a NEUTRAL demand for Bitcoin and the shift towards the consolidation phase in the medium-term range.
We can see the formation of a bullish trendline from $26,529 to $28,771.
The BTCUSD is now facing resistance at $29,147, which is a 13-week high, and at $30,471, which corresponds to a 14-day RSI at 70.
XRPUSD – Double Bottom Pattern Is Above $0.4548
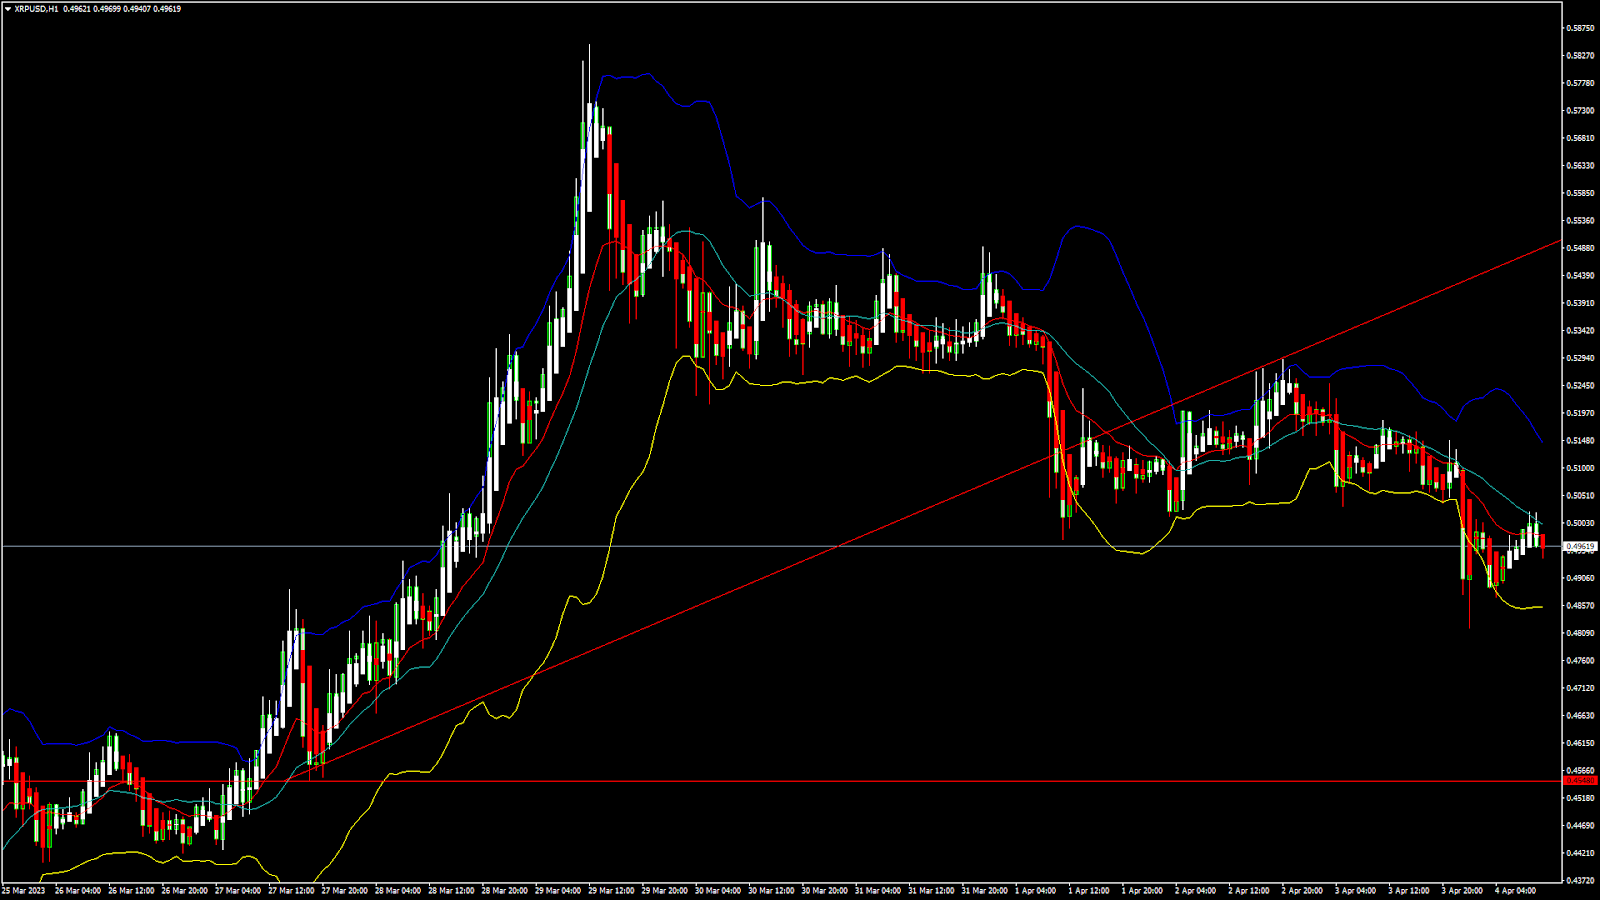
Last week, the market sentiment turned bullish after Ripple touched a low of $0.4548 on 27th March and started to correct. On 29th March, it touched a high of $0.5846.
The market opened bearish this week. There is a double bottom pattern above the $0.4548 handle.
Ripple touched an intraday low of 0.4817 in the Asian trading session and an intraday high of 0.5020 in the European trading session today.
The MACD indicator is giving a bullish divergence signal in the 2-hour timeframe, which stands for the bullish nature of the market.
The relative strength index is at 61.43, which signifies a STRONG demand for Ripple at the current market prices and the continuation of the bullish phase in the market.
Moving averages signal an upward price movement at the current market level of 0.4955.
Both the STOCHRSI and CCI are in the overbought zones, which means the price may decline in the short-term phase.
Ripple is now trading just below its pivot level of 0.5109 and is now facing its classic resistance at 0.5813 and Fibonacci resistance at 0.5652, after which it will be able to move towards 0.6000.
Some of the major technical indicators are bullish.
- Ripple bullish reversal is seen above 0.4548.
- The price is below its pivot level.
- Average true range indicates HIGH volatility.
Ripple Bullish Reversal Seen Above $0.4548
We can see that Ripple continues to move bullish, and further resistance levels are at 0.5500 and 0.6000.
The previous candle closed over Bollinger bands signalling a neutral sentiment in the weekly timeframe.
We can see the formation of the bullish trend reversal pattern with the 50-week Adaptive Moving Average in the weekly timeframe.
We have also detected a bullish price crossover with a 50-period moving average MA50 in the 15-minute timeframe.
The short-term outlook for Ripple has turned bullish, the medium-term outlook is bullish, and the long-term outlook is neutral.
We can see a decrease of 1.27% in the daily trading volumes of Ripple, which is an average value.
This Week Ahead
Ripple continues to move in a strong bullish momentum above the 0.4500 level. We are now looking for fresh upsides in the range of 0.5500 and 0.6000.
We saw a pullback after the price touched a high of $0.5846, which is expected to be short-term, and after the current phase of market consolidation gets over, we are looking for a fresh rally.
The resistance level is located at $0.5289, which is the first resistance pivot and at $0.5343.
We can see a continuous progression of a bullish trendline formation from $0.4548 to $0.5498.
The support level is located at $0.4866, which is a 38.2% retracement from the 13-week high, and at $0.4941, which is a 38.2% retracement from 4-week high.
The weekly outlook for Ripple is $0.6000 with a consolidation zone of $0.5500.


