
DXY:
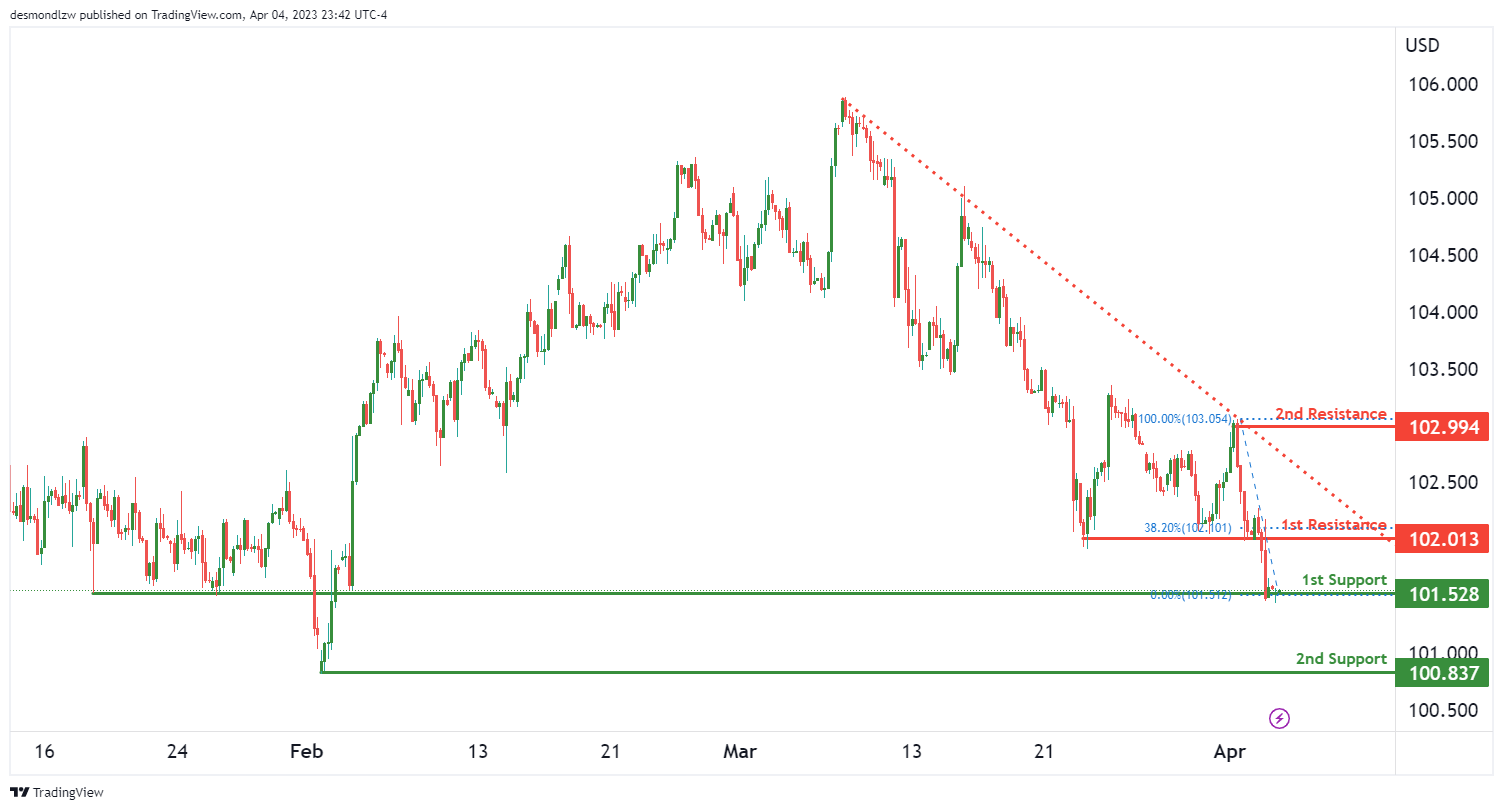
The DXY chart is currently showing a bearish momentum, with several factors contributing to the downward pressure. Firstly, price is below a major descending trend line, which suggests that bearish momentum is likely to continue in the near future.
Looking at the support and resistance levels, we can see that price could potentially make a bearish break off the 1st support and drop towards the 2nd support. The 1st support level is at 101.52, and it is a good level of support as it is an overlap support. On the other hand, the 2nd support level is at 100.83, and it is a swing low support, making it another strong level of support.
In terms of resistance levels, the 1st resistance level is at 102.01. This level is a pullback resistance and also has a 38.20% Fibonacci retracement lining up with it, which makes it a strong level of resistance. The 2nd resistance level is at 102.99, and it is a swing high resistance.
It is worth noting that the overall momentum of the chart is bearish, which suggests that prices are likely to continue to decline. Furthermore, the fact that price is below a major descending trend line reinforces this bearish bias.
EUR/USD:
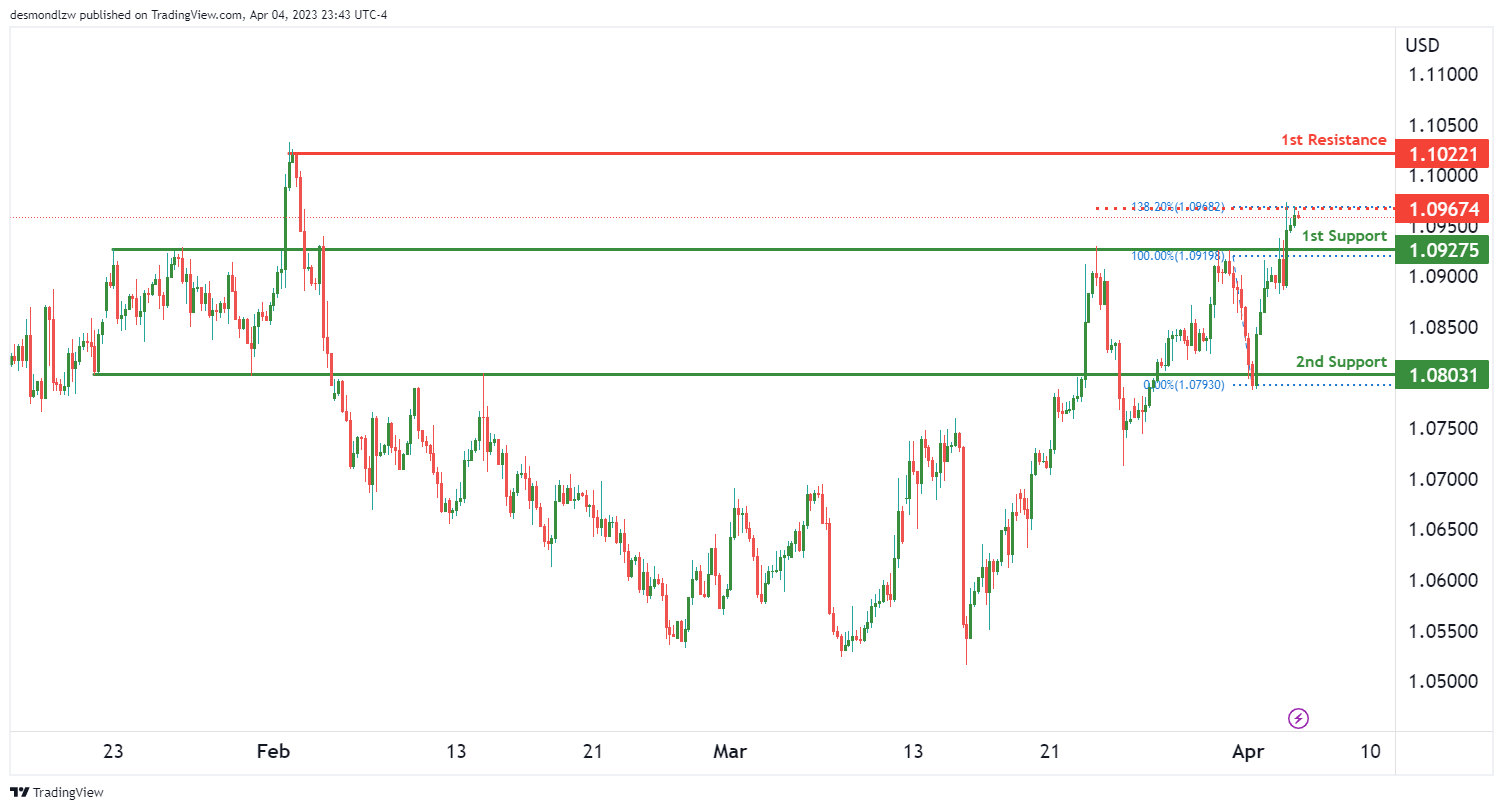
The EUR/USD chart is currently showing a bullish momentum, with potential for a bullish continuation towards the 1st resistance level.
Looking at the support levels, we can see that the 1st support level is at 1.0927, which is an overlap support and a good level of support. The 2nd support level is at 1.0803, and it is also an overlap support, making it another strong level of support.
In terms of resistance levels, the 1st resistance level is at 1.1022, which is a swing high resistance and a good level of resistance. Additionally, there is an intermediate resistance level at 1.0967, which is a swing high resistance and has a 138.20% Fibonacci extension lining up with it, making it another strong level of resistance.
The overall momentum of the chart is bullish, which suggests that prices are likely to continue to rise. Given the potential for a bullish continuation towards the 1st resistance level, it is possible that prices could reach this level soon.
GBP/USD:
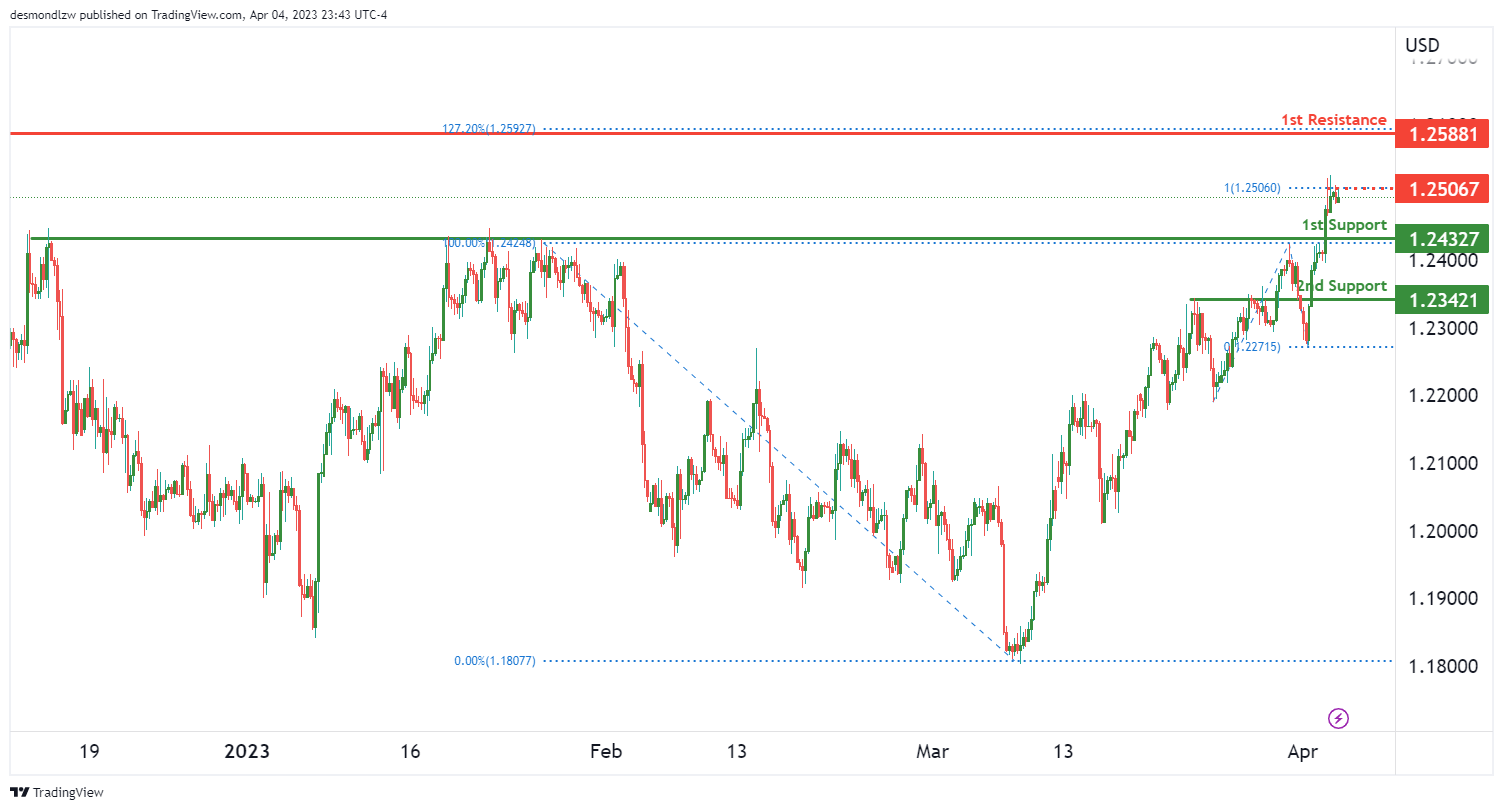
The GBP/USD chart is currently showing a bullish momentum, with potential for a bullish continuation towards the 1st resistance level.
Looking at the support levels, we can see that the 1st support level is at 1.2432, which is a pullback support and a good level of support. The 2nd support level is at 1.2342, and it is also an overlap support, making it another strong level of support.
In terms of resistance levels, the 1st resistance level is at 1.2588, which is a swing high resistance and a good level of resistance. Additionally, there is an intermediate resistance level at 1.2506, which is also a swing high resistance and another strong level of resistance.
USD/CHF:
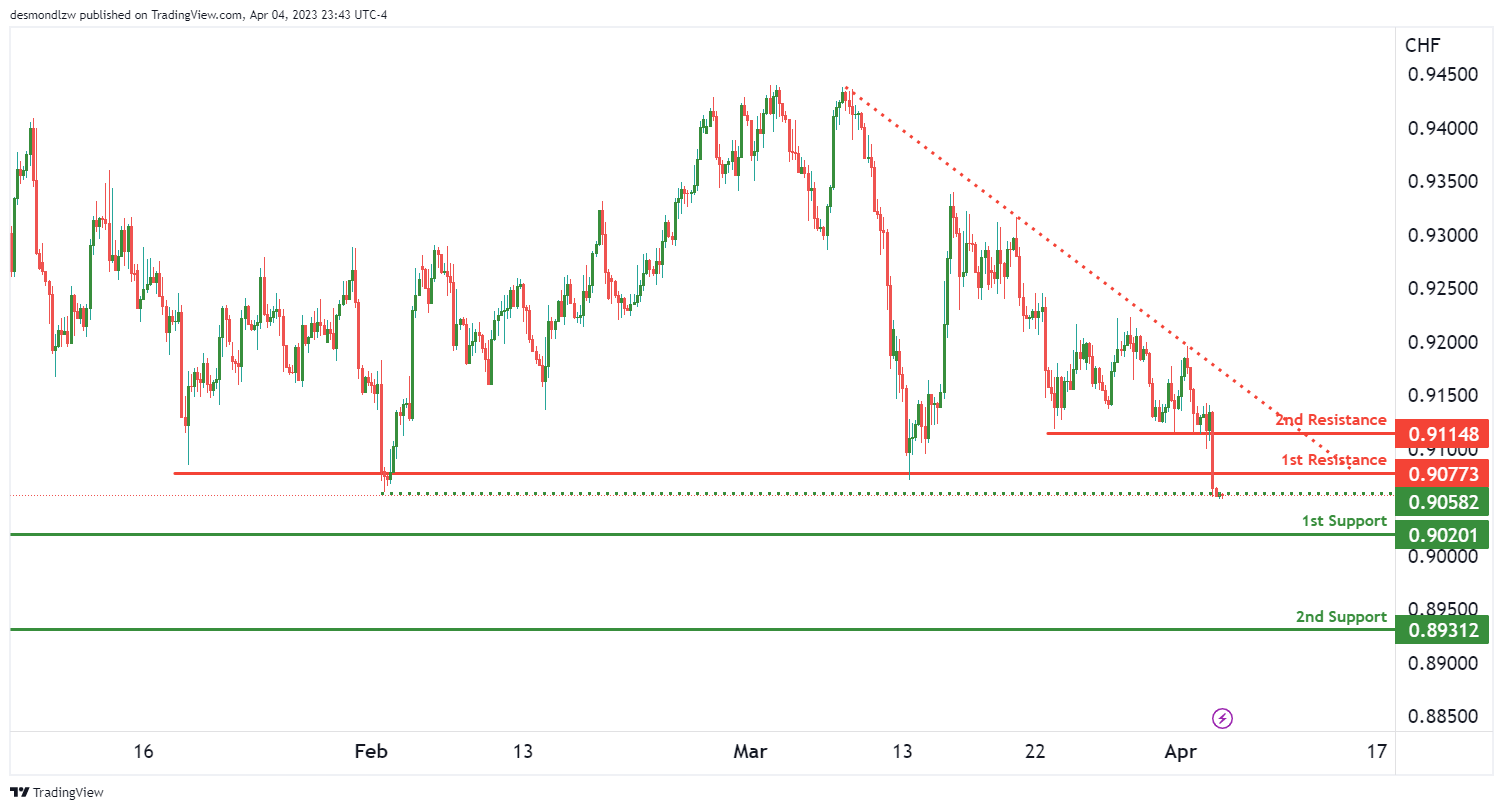
The USD/CHF chart shows bearish momentum as prices are below a major descending trend line, indicating that a continuation of the bearish trend is likely. The first support is at 0.9020, which is a swing low support level. Additionally, the second support at 0.8931 is also a swing low support level. On the other hand, the first resistance at 0.9077 is a pullback resistance level, and there is an intermediate resistance at 0.9114 that is also a pullback resistance level. There is an intermediate support at 0.9058, which is a multi-swing low support level.
Given the bearish momentum, price could potentially continue to drop towards the first support at 0.9020. If price were to break through this level, it could potentially reach the second support at 0.8931. On the other hand, if there is a reversal, price could potentially rise towards the first resistance at 0.9077. It’s important to keep an eye on the intermediate levels at 0.9114 and 0.9058 as they could potentially act as resistance and support respectively.
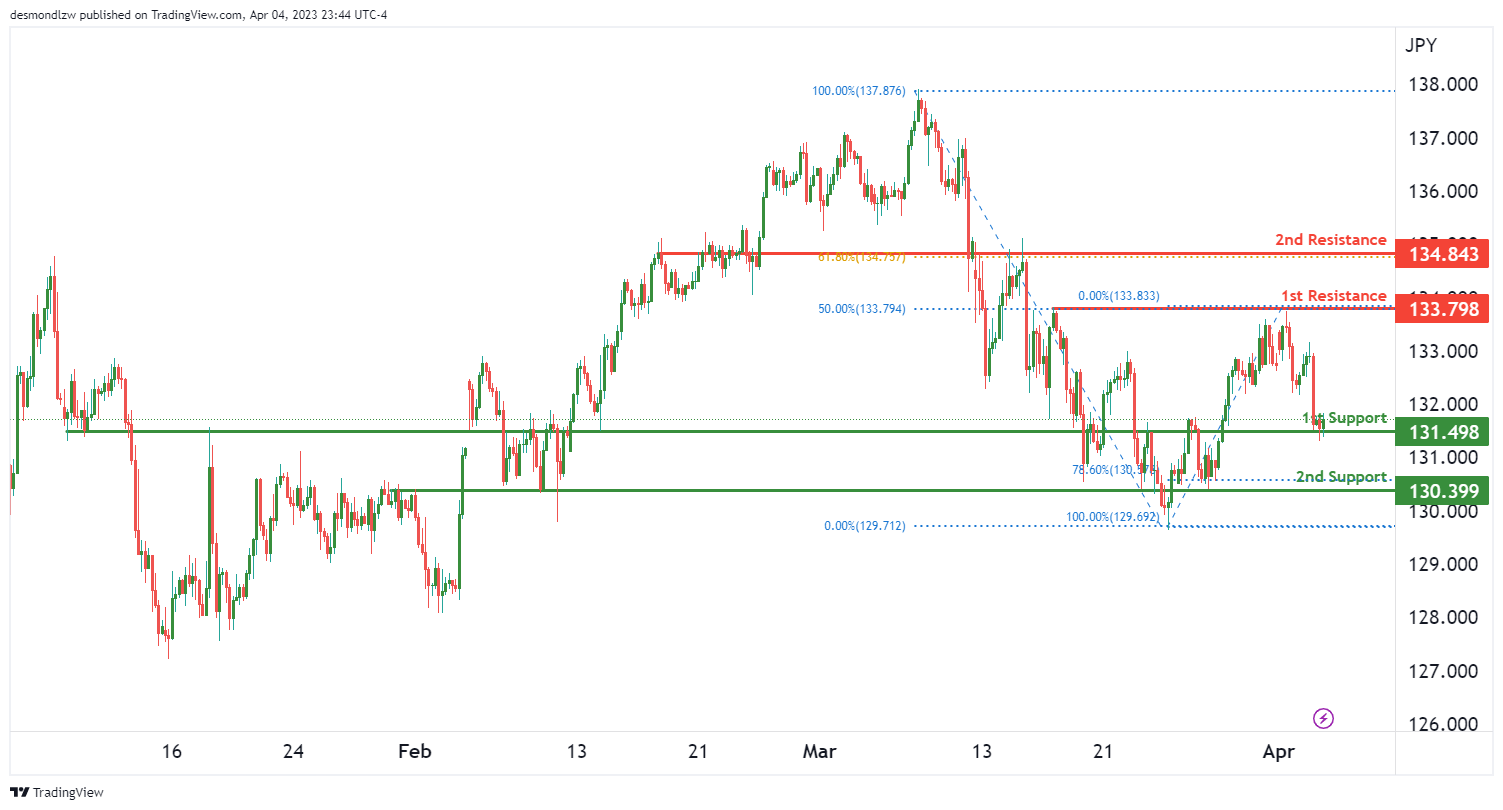
USD/JPY:
The overall momentum of the USD/JPY chart is bullish, supported by the fact that price is currently above the Ichimoku cloud. Looking at the chart, there are multiple factors contributing to the bullish momentum, including an ascending trend line and multiple overlap supports.
If the bullish momentum were to continue, the price could potentially reach the 1st resistance level at 133.79, which is a multi-swing high resistance level that also coincides with a 50% Fibonacci retracement.
In terms of support levels, the 1st support level is at 131.49, which is an overlap support level and a good potential area for prices to bounce back up. The 2nd support level is at 130.39, which is another overlap support level that also coincides with the 78.60% Fibonacci retracement level, making it a strong level to watch.
There is also a 2nd resistance level at 134.84, which is an overlap resistance level and coincides with the 61.80% Fibonacci retracement level. This level could potentially act as a barrier for prices to rise further towards the upside.
It’s worth noting that if price were to break the 1st support level, the next support level to watch for would be the 2nd support level at 130.39. However, if price were to break the 1st resistance level, it could potentially rise towards the 2nd resistance level at 134.84.
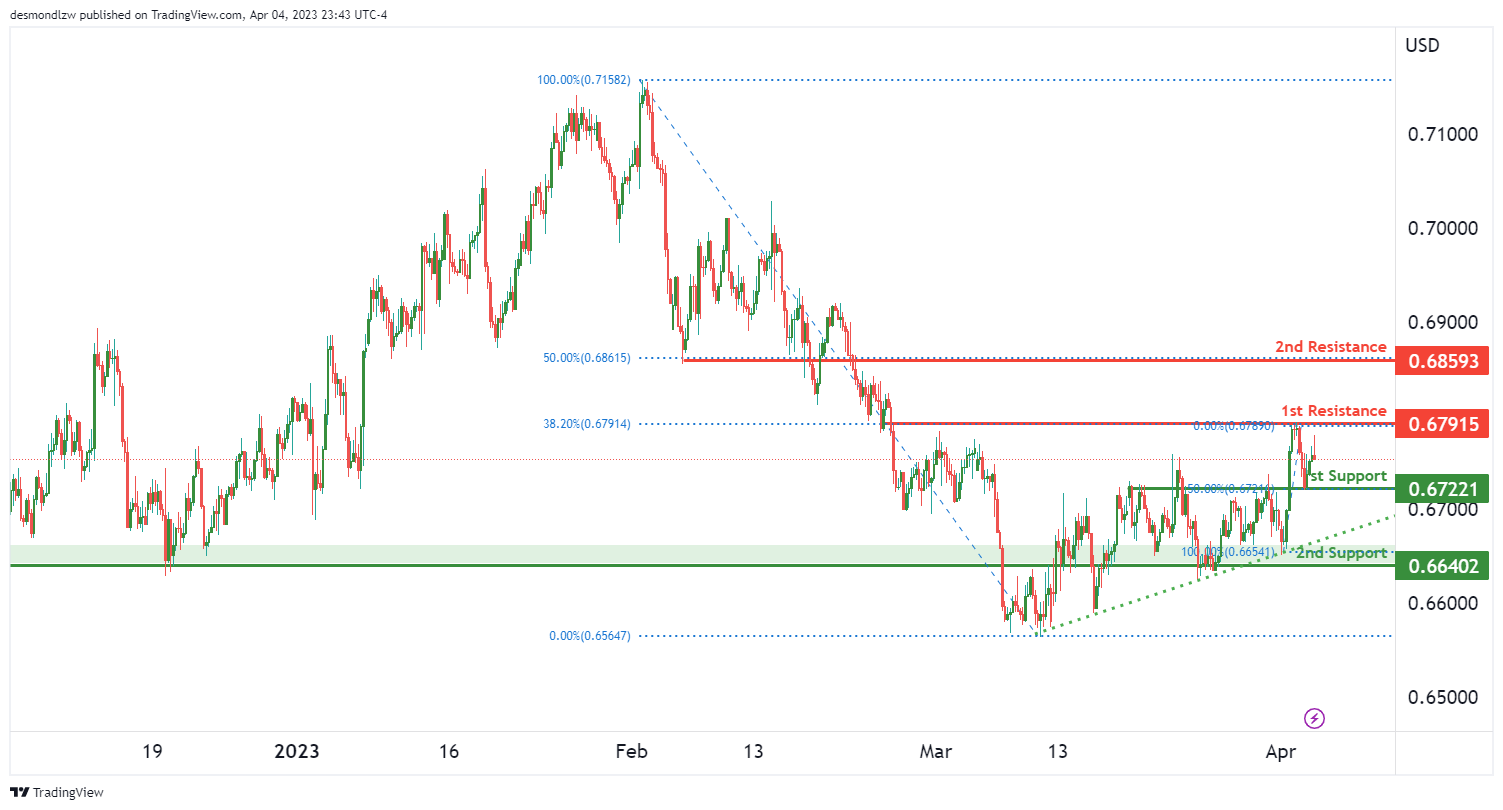
AUD/USD:
The AUD/USD chart is showing strong bullish momentum, with prices potentially continuing to rise towards the 1st resistance. The overall bias is bullish, with the price above the Ichimoku cloud and no significant resistance in the way of a potential uptrend.
Currently, the 1st support level is at 0.6722, which is an overlap support level and also lines up with a 50% Fibonacci retracement. This level has been tested multiple times in the past and could provide strong support if the price were to drop.
If the price were to bounce from the 1st support, it could rise towards the 1st resistance at 0.6791. This level is also an overlap level, but this time it coincides with a 38.20% Fibonacci retracement. A breakthrough of this resistance could potentially lead to a bullish acceleration towards the 2nd resistance level at 0.6859, which is also an overlap resistance and a 50% Fibonacci retracement level.
The 2nd support level at 0.6640 is another overlap support level and could potentially provide additional support if the price were to drop further.
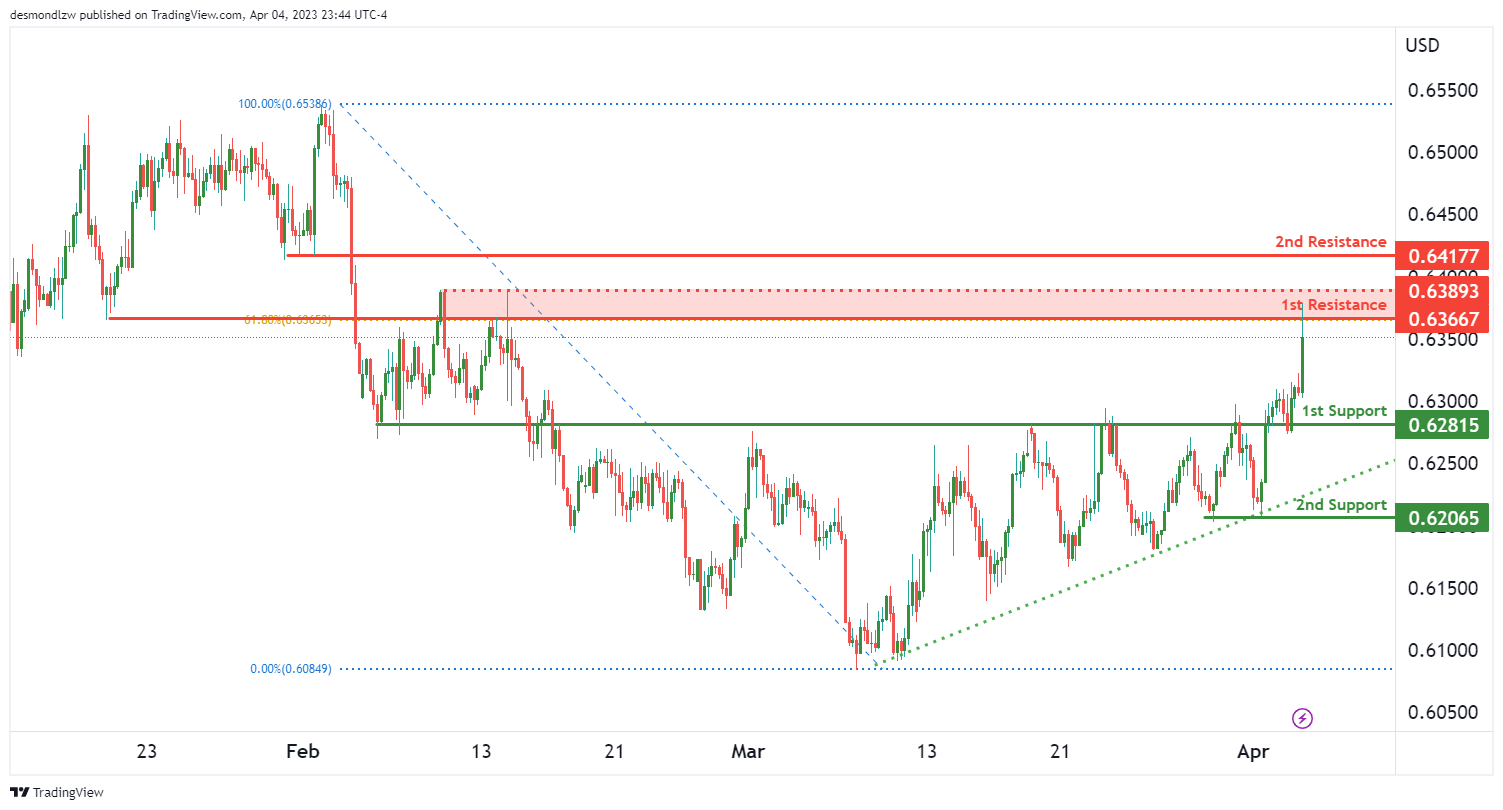
NZD/USD:
The NZD/USD pair continues to show bullish momentum as it remains above a major ascending trend line, suggesting further bullish momentum is on the cards. If price continues to move higher, it could potentially make a bullish continuation towards the 1st resistance level at 0.6366.
On the downside, the 1st support level is located at 0.6281, which is a strong overlap support and could provide a level of buying interest if prices were to drop. The 2nd support level is located at 0.6206, which is a multi-swing low support that could also attract buyers if the pair were to experience a pullback.
On the upside, the 1st resistance level is at 0.6366, which coincides with a 61.8% Fibonacci retracement level and is a strong overlap resistance. If price were to break through this level, it could trigger a move towards the 2nd resistance level at 0.6417, which is a pullback resistance.
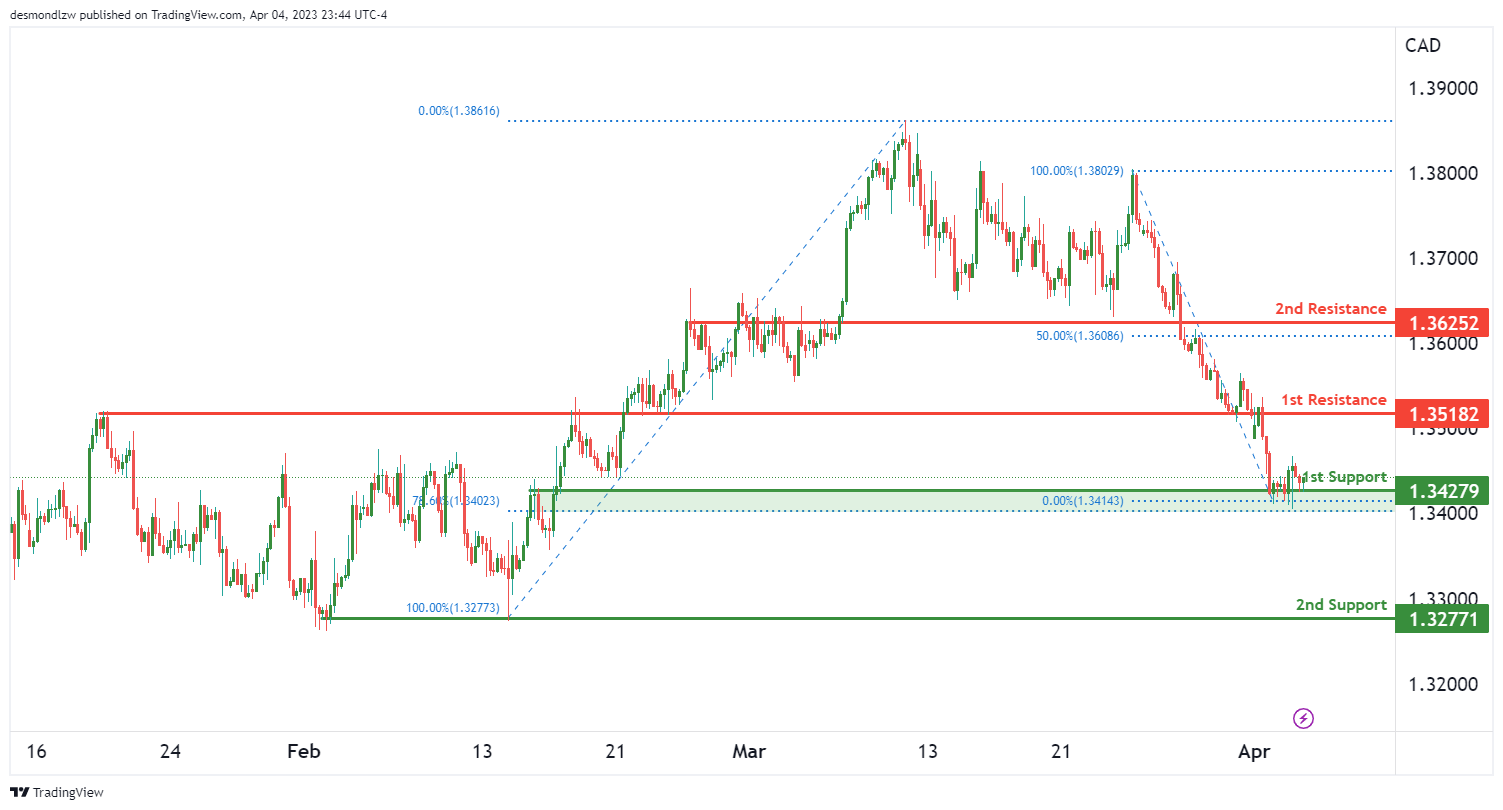
USD/CAD:
USD/CAD is showing bullish momentum with potential for further upward movement, supported by an overall bullish bias. Price is currently above a major ascending trend line, adding to the potential for continued bullishness.
The first support level for USD/CAD is at 1.3427, which is an overlap support and also lines up with a 78.60% Fibonacci retracement. If price were to bounce from this level, it could potentially rise towards the first resistance level at 1.3518, which is another overlap resistance.
However, if price were to break below the first support level, it could potentially drop to the second support at 1.3277, which is a multi-swing low support.
Looking at resistance levels, the first resistance level at 1.3518 is a good one as it coincides with an overlap resistance. Meanwhile, the second resistance level at 1.3625 is another good one as it is also an overlap resistance and lines up with a 50% Fibonacci retracement.
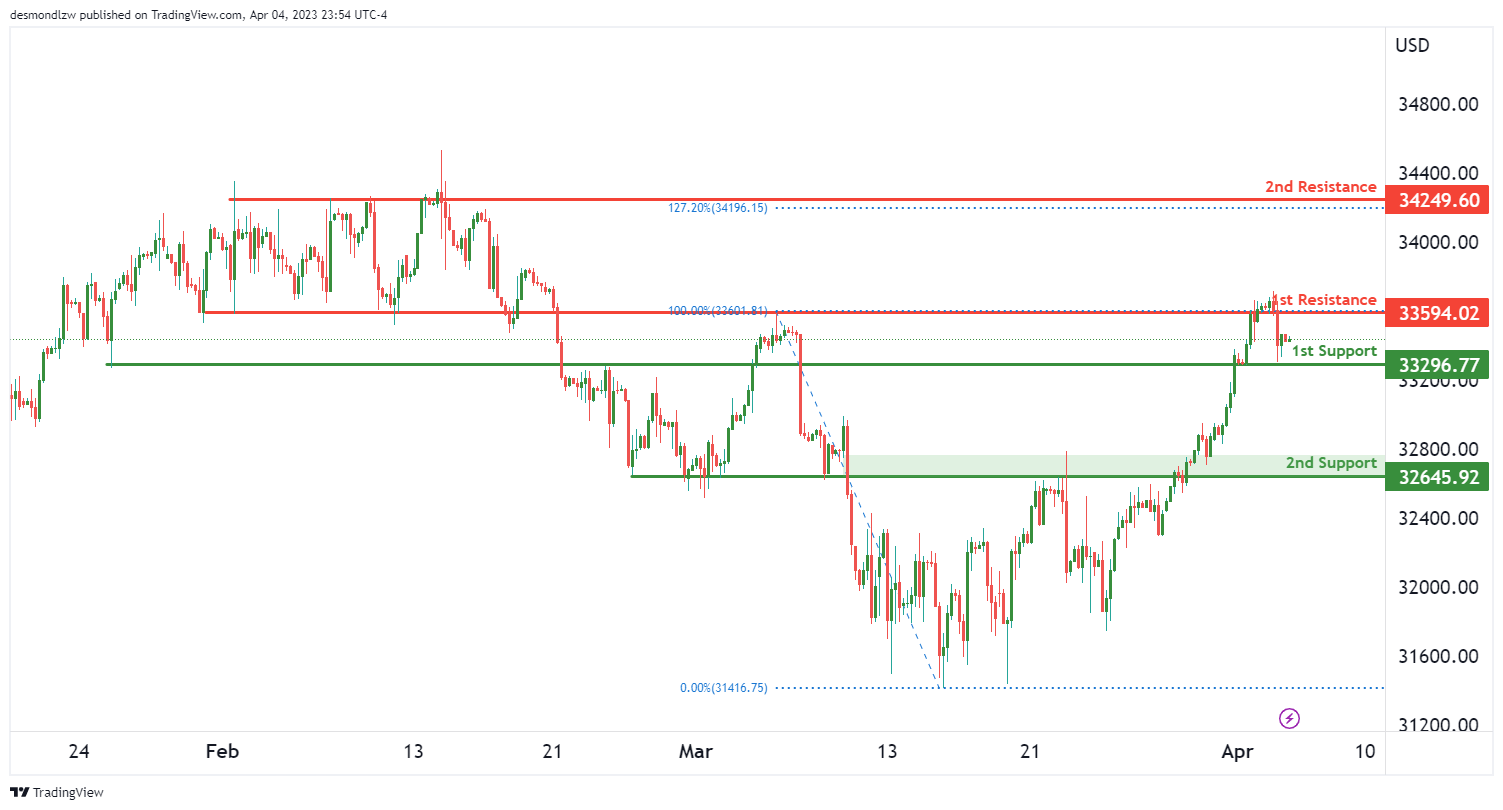
DJ30:
The DJ30 chart is currently showing strong bullish momentum with potential for a bullish bounce off the 1st support level towards the 1st resistance level.
The 1st support level is located at 33296.77 and is a strong overlap support. Additionally, the 2nd support level at 32645.92 is a multi-swing low support, further bolstering its potential as a strong support level.
On the other hand, the 1st resistance level is located at 33594.02 and is a strong overlap resistance. Moving higher, the 2nd resistance level is located at 34249.60 and is a multi-swing high resistance. This level coincides with the 127.20% Fibonacci extension, adding further significance to its potential as a resistance level.
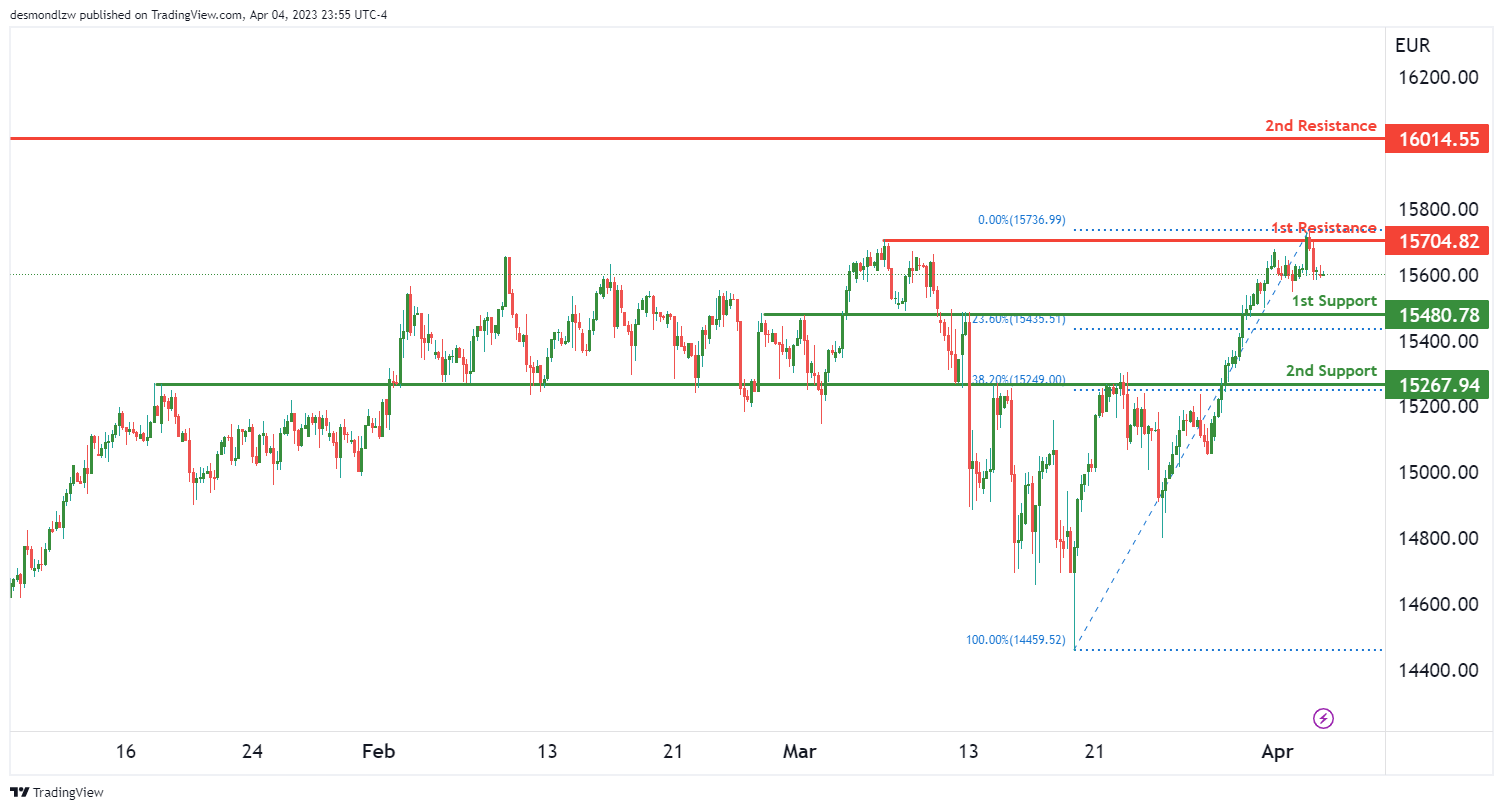
GER30:
The GER30 chart is currently showing strong bearish momentum with potential for a bearish continuation towards the 1st support level.
The 1st support level is located at 15480.78 and is a strong overlap support. Additionally, the 2nd support level at 15267.94 is an overlap support that coincides with the 38.20% Fibonacci retracement, further bolstering its potential as a strong support level.
On the other hand, the 1st resistance level is located at 15704.82 and is a multi-swing high resistance. Moving higher, the 2nd resistance level is located at 16014.55 and is a swing high resistance. These resistance levels indicate potential areas where the bearish momentum could potentially stall.
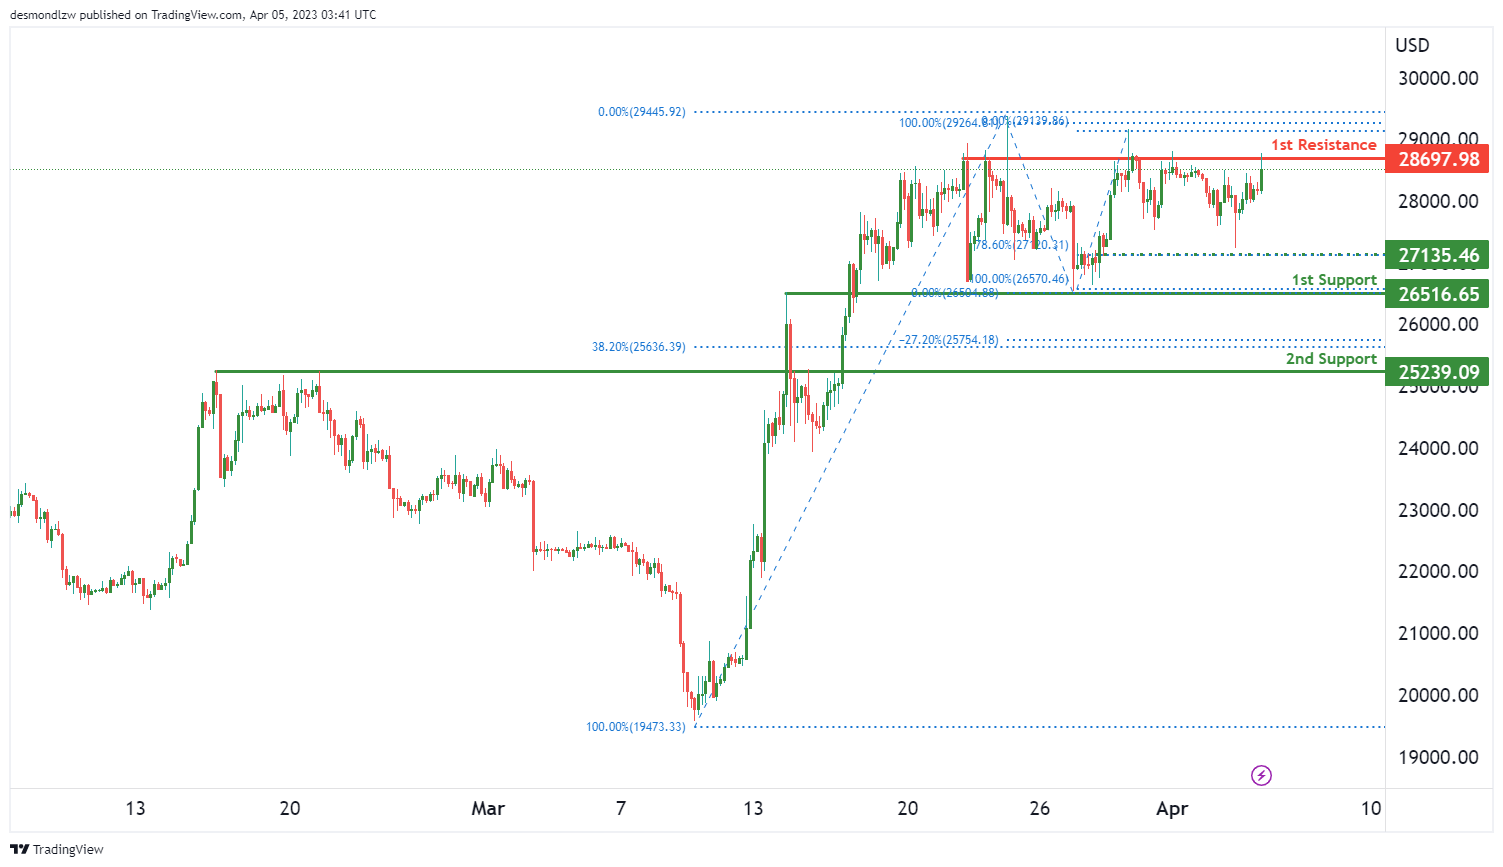
BTC/USD:
The BTC/USD chart currently indicates a strong bearish momentum with potential for a bearish break off the 1st support level towards the 2nd support level.
The 1st support level is located at 26516.65 and is a strong overlap support, however, if it were to break, the price could drop towards the 2nd support level at 25239.09 which is also an overlap support and coincides with the 38.20% Fibonacci retracement, further strengthening its potential as a support level.
On the other hand, the 1st resistance level is located at 28697.98 and is a multi-swing high resistance. There is also an intermediate support level at 27135.46 which is a swing low support, providing additional support for the price in case of any pullback.
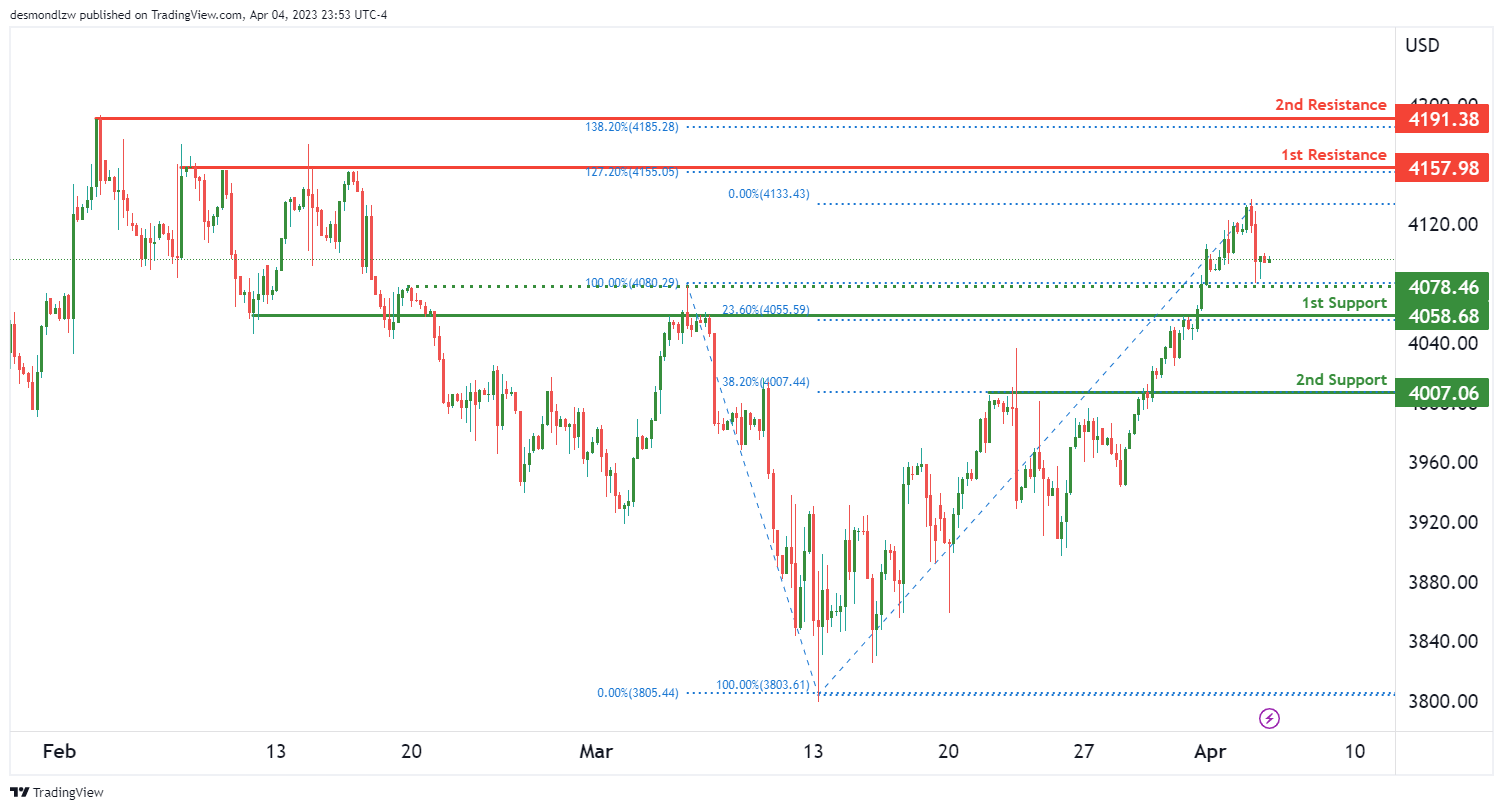
US500
The US500 chart currently shows strong bearish momentum with the potential for a bearish continuation towards the 1st support level.
The 1st support level is located at 4058.06 and is a strong overlap support. Additionally, the 2nd support level at 4007.06 is a pullback support and coincides with the 38.20% Fibonacci retracement, further strengthening its potential as a strong support level.
On the other hand, the 1st resistance level is located at 4157.98 and is a multi-swing high resistance. Moving higher, the 2nd resistance level is located at 4191.38 and is a swing high resistance. These levels coincide with the 127.20% and 138.20% Fibonacci extensions, respectively, adding further significance to their potential as resistance levels.
In between the support and resistance levels, there is an intermediate support level located at 4078.46, which is a swing low support. This level could potentially act as a support if price were to drop further.
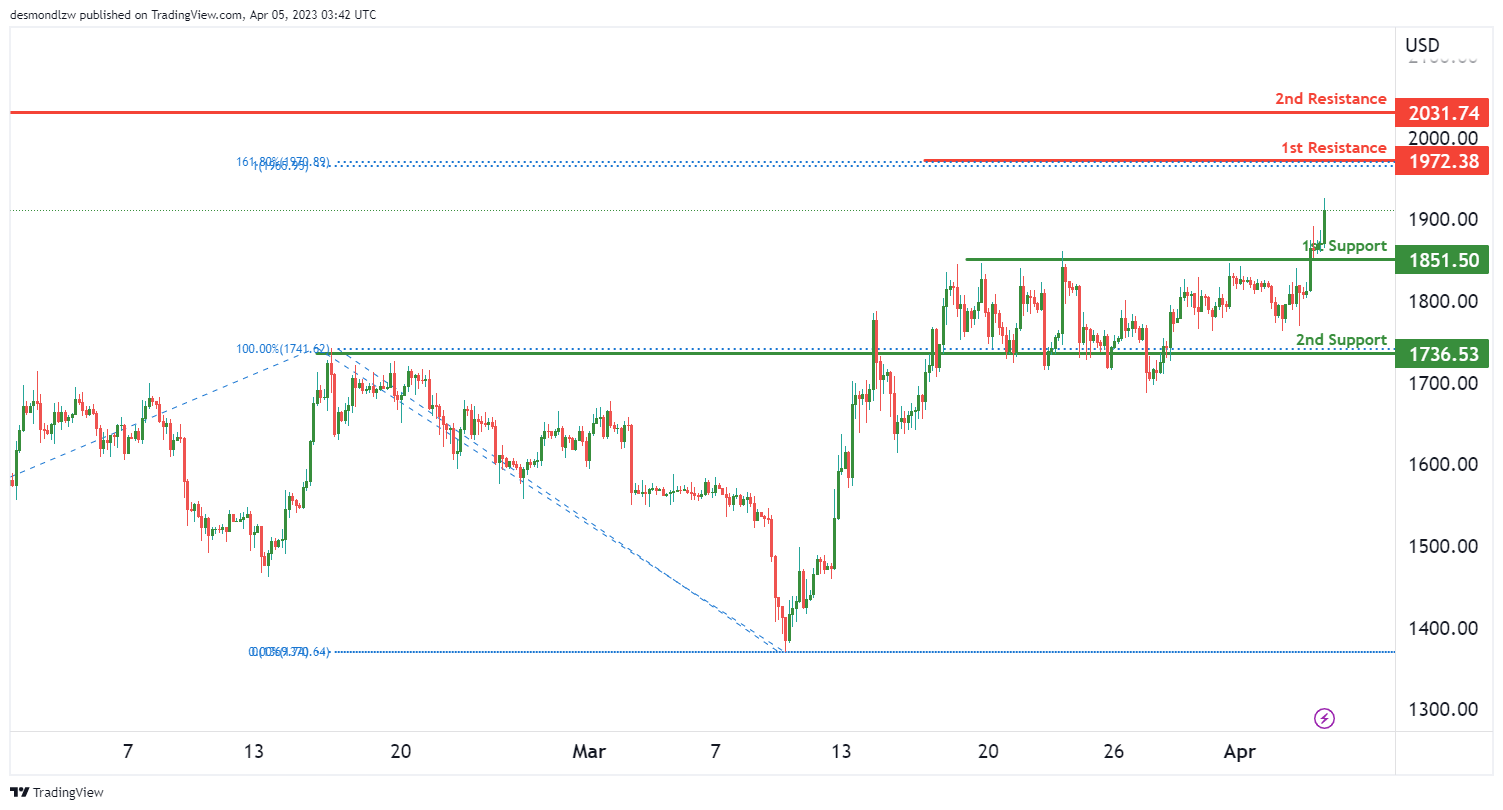
ETH/USD:
The ETH/USD chart is currently showing strong bullish momentum, with the potential for a continuation towards the 1st resistance level.
The 1st support level is located at 1851.50 and is a pullback support, which adds significance to its potential as a strong support level. Additionally, the 2nd support level at 1736.53 is an overlap support, which further confirms its potential as a support level.
On the other hand, the 1st resistance level is located at 1972.38 and is a swing high resistance. Moving higher, the 2nd resistance level is located at 2031.74 and is a swing high resistance. These levels suggest that there may be some selling pressure at these levels, which could limit price appreciation.
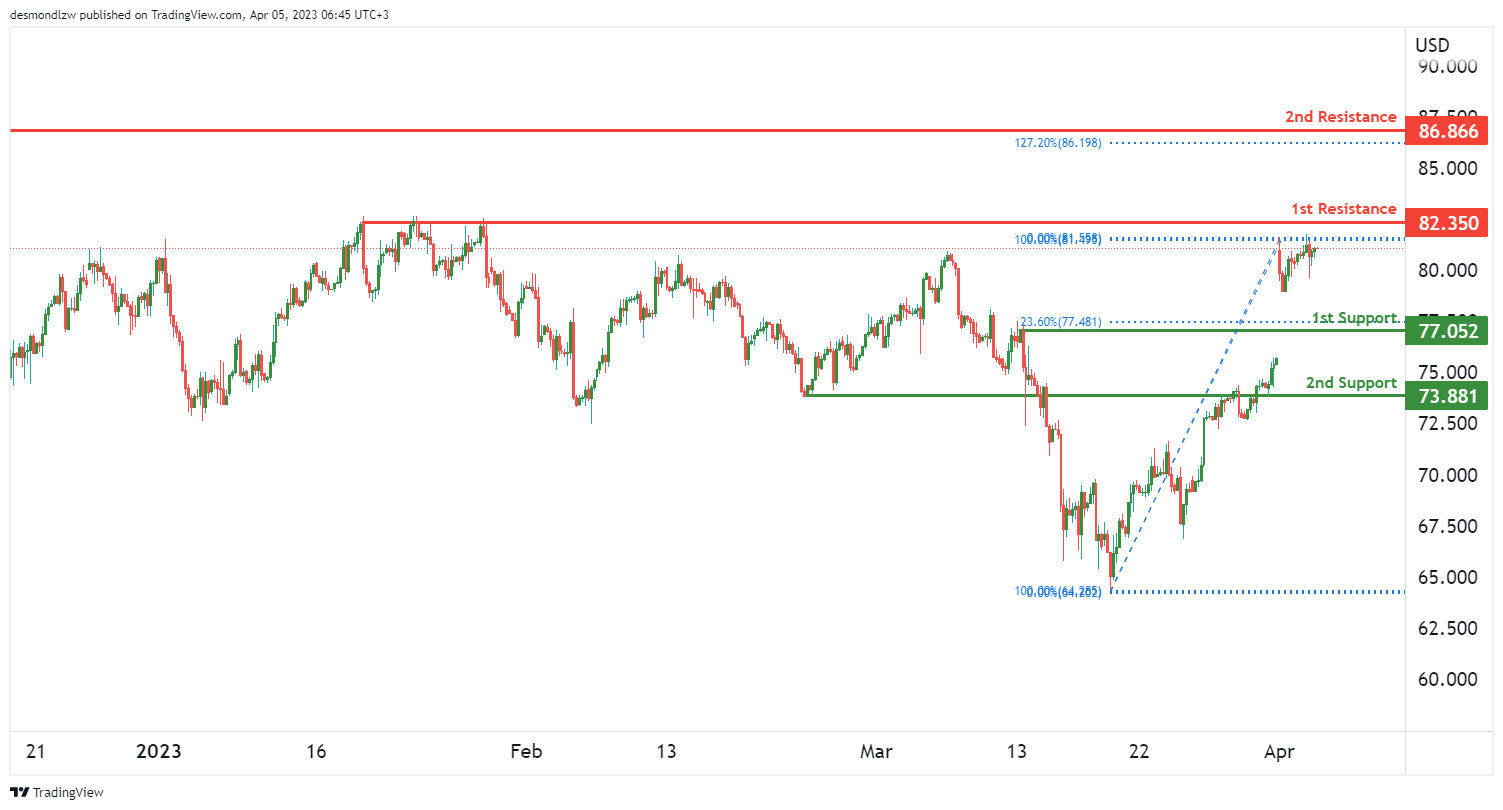
WTI/USD:
WTI’s chart shows strong bullish momentum with a potential for a break through the 1st resistance level and rise towards the 2nd resistance level.
The 1st support level is located at 77.05 and coincides with the 23.60% Fibonacci retracement. Additionally, the 2nd support level at 73.88 is a pullback support, further reinforcing its potential as a strong support level.
On the other hand, the 1st resistance level is located at 82.35 and is a multi-swing high resistance. Moving higher, the 2nd resistance level is located at 86.86 and is a swing high resistance. These levels are significant because they can act as barriers to further price increases.
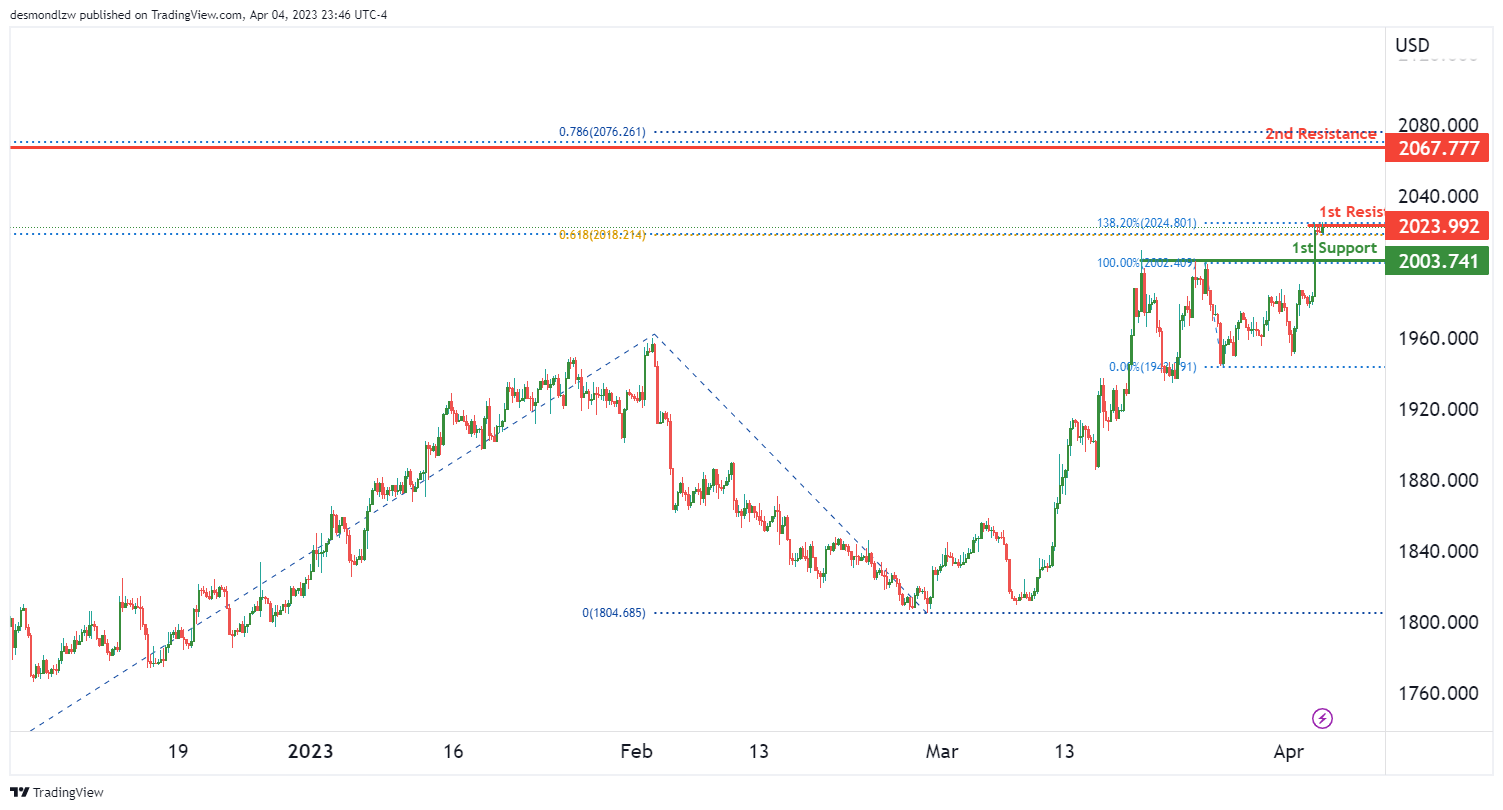
XAU/USD (GOLD):
Gold has been showing strong bullish momentum with potential for a bullish break through of the 1st resistance level and rise towards the 2nd resistance level. The overall bias is bullish, with price above an ascending trend line indicating further bullish momentum is on the cards.
The 1st support level is located at 2003.00 and is a pullback support. This level is significant as it has provided support in the past and is likely to do so again.
Moving higher, the 1st resistance level is located at 2023.00 and is a swing high resistance. This level coincides with the 138.20% Fibonacci extension, adding further significance to its potential as a resistance level. A break through this level could trigger a rise towards the 2nd resistance level located at 2067.00.
The 2nd resistance level is a swing high resistance and coincides with the 78.60% Fibonacci expansion. This level has been significant in the past and is likely to provide resistance once again.


