
ETHUSD – Hammer Pattern Is Above $1,763
Bears couldn’t keep control of the market, and after touching a low of $1,763 on 03rd April, the ETH/USD pair started to correct upwards, touching a high of $1,939 on 05th April.
ETHUSD is now moving under bearish pressure after touching a high of $1,939 on 05th April. The immediate bearish pressure suggests we will enter a consolidation phase above the $1,850 level.
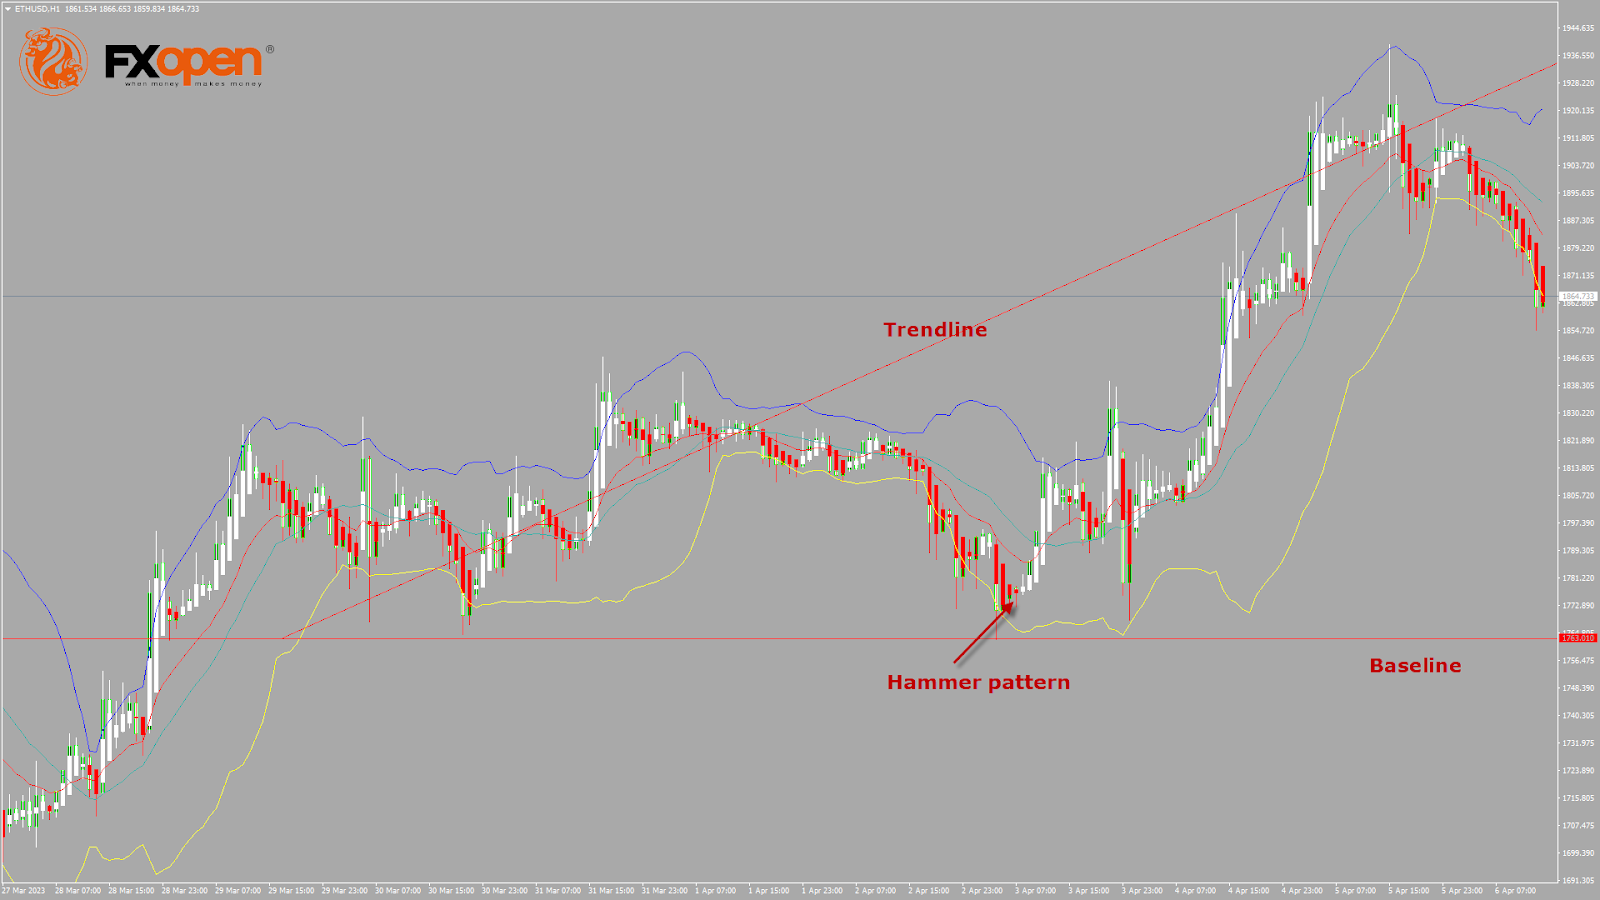
A hammer pattern is above the $1,763 handle. It’s a bullish pattern, which signifies the end of a bearish phase. Also, we can see the formation of the morning star pattern.
The price is above the Ichimoku cloud, indicating a bullish nature of the market. Moreover, Ethereum is near the support of the channel.
The relative strength index is at 56.91, indicating a strong demand for Ether and a continuation of the buying pressure in the markets.
The average directional index and commodity channel index give a neutral signal, meaning that the price is expected to enter into a consolidation phase in the short-term range.
Some of the technical indicators are giving a bullish market signal. Most moving averages are giving a bullish signal at the current market level of $1,866.
ETH is now trading above the 200-hour simple and 200-hour exponential moving averages.
- Ether bullish reversal is seen above the $1,763 mark.
- The short-term range is expected to be mildly bullish.
- The average true range indicates high market volatility.
Ether Bullish Reversal Seen Above $1,763
On the daily chart, ETH is trading just below its pivot level of $1,885 but is moving into a mild bullish channel and testing its classic resistance level of $1,893 and Fibonacci resistance level of $1,907, after which the path towards $1,950 will get cleared.
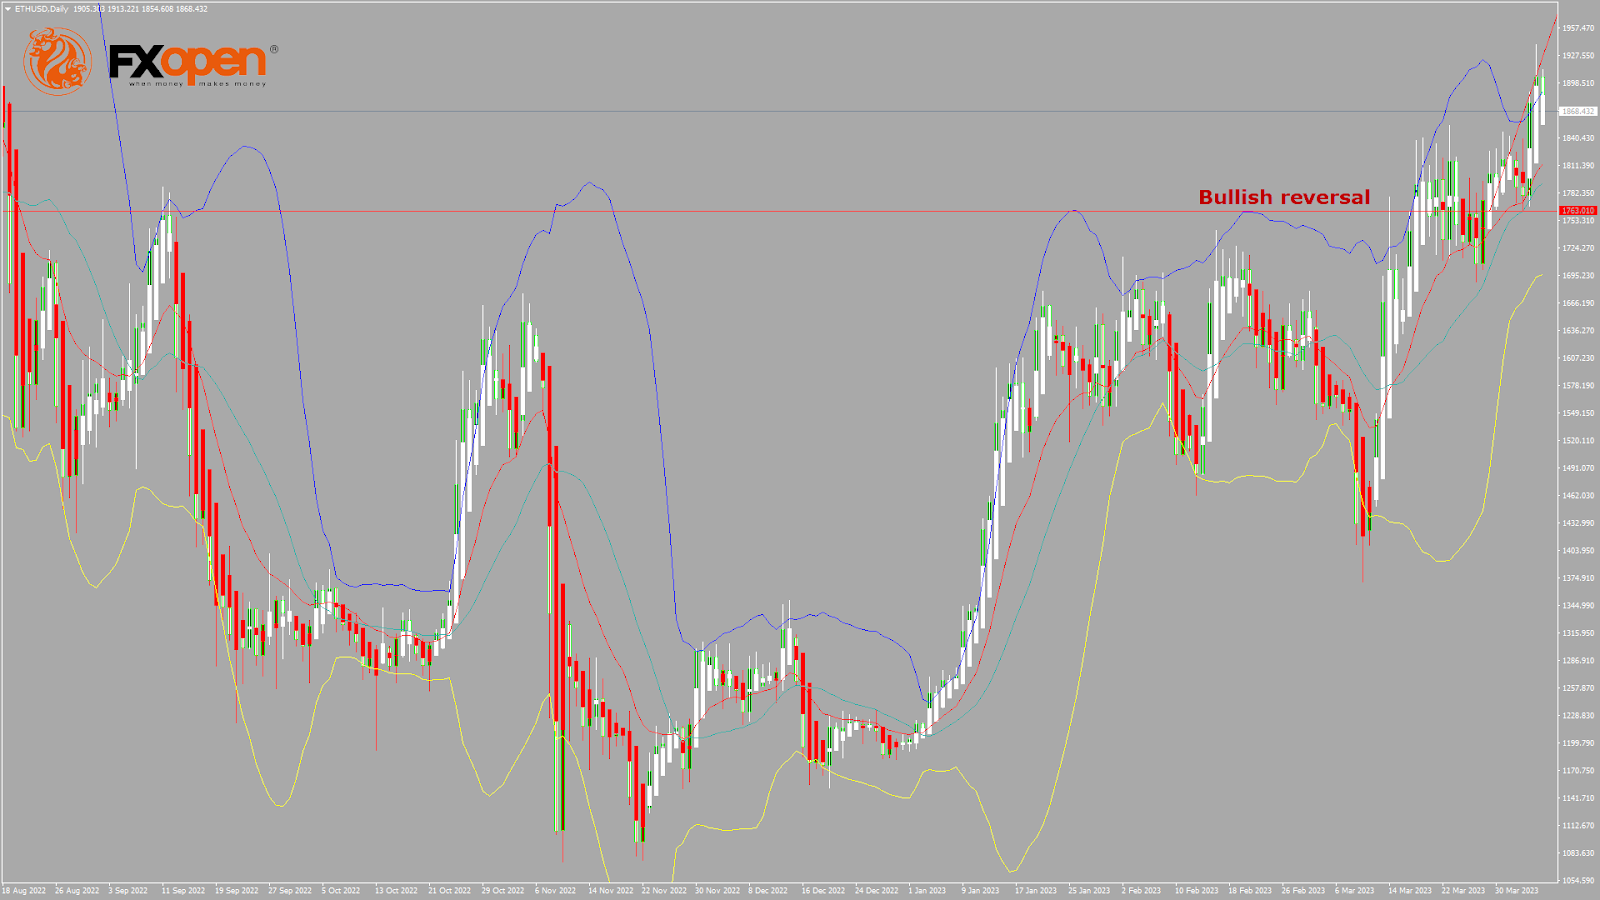
We can see the formation of a bullish price crossover with the 50-week adaptive moving average. The key support levels to watch are $1,808, at which the price crosses the 9-day moving average, and at $1,810, which is a 38.2% retracement from the 52-week low.
The Week Ahead
ETH has crossed the $1,900 barrier, and now we are heading towards the $2,000 level in the medium-term range in the H1 timeframe.
We can see a bullish ascending channel forming from $1,763 towards the $1,935 level.
We can see the formation of a major bullish trendline with the support located at $1,727, which is a 14-day RSI at 50.
The immediate short-term outlook for Ether has turned as mildly bullish, the medium-term outlook has turned bullish, and the long-term outlook for Ether is neutral in present market conditions.
The resistance zone is located at $1,899, which is a pivot point, and at $1,932, which is a 13-week high.
The weekly outlook is $2,000 with a consolidation zone of $1,950.


