
DXY:
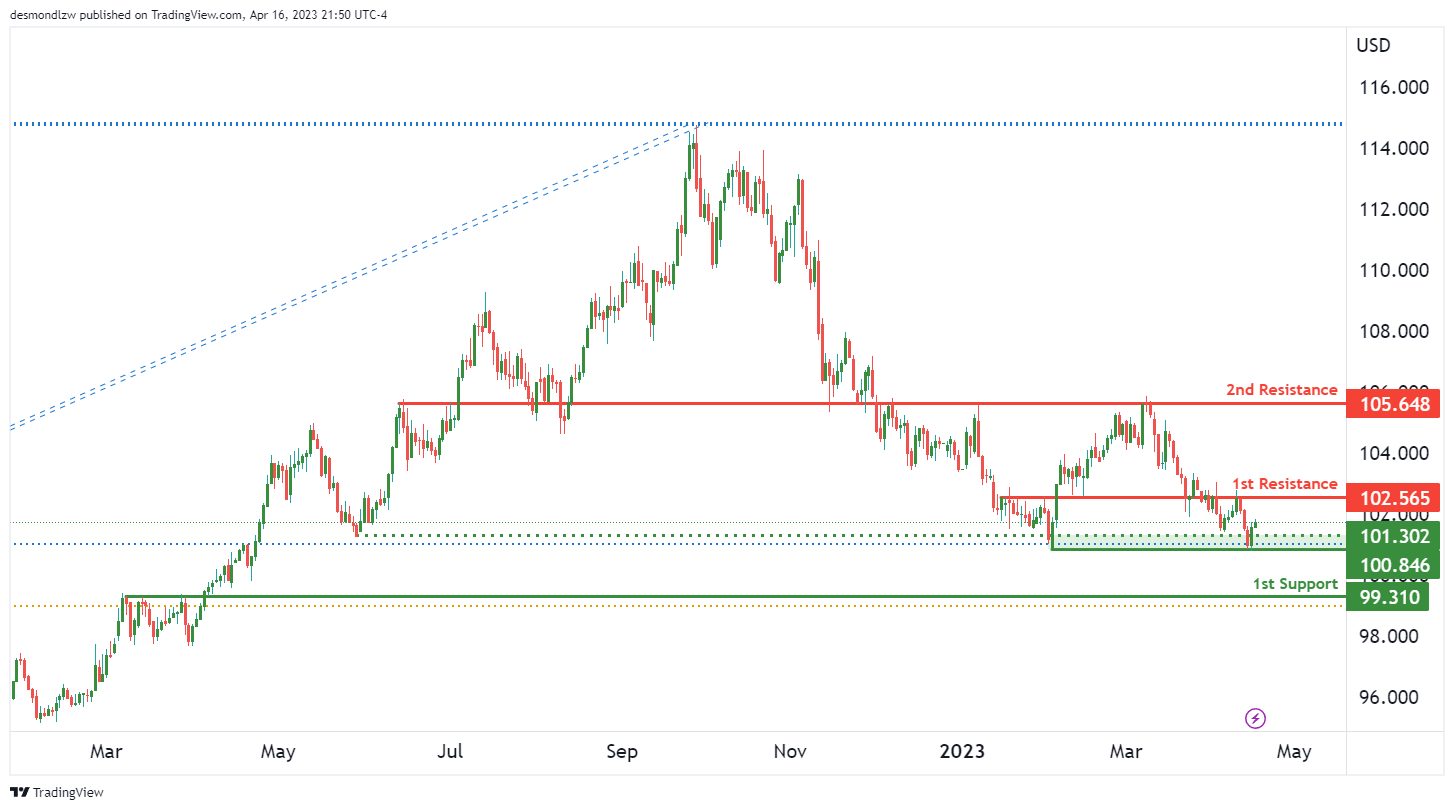
The overall momentum of theDXY, which currently shows a bullish momentum overall. This suggests that the price could potentially continue to rise further, with the potential to make a bullish continuation towards the 1st resistance level.
The first support level for DXY is at 100.85, which is a multi-swing low support. This level has proven to be a strong support in the past, and if the price were to bounce from this level, it could rise towards the 1st resistance at 102.56. The 1st resistance level is an overlap resistance, making it a key level to watch for potential bullish movements.
If the price were to break through the 1st resistance, it could potentially rise towards the 2nd resistance at 105.64, which is also an overlap resistance. However, if the price were to drop instead, the 2nd support level is at 99.31, which is a pullback support.
It’s worth noting that there is an intermediate support level between the current price and the 1st support, although it hasn’t been specified in the information provided. This intermediate support level could potentially trigger a strong bullish acceleration towards the 1st resistance if the price were to break through it.
EUR/USD:
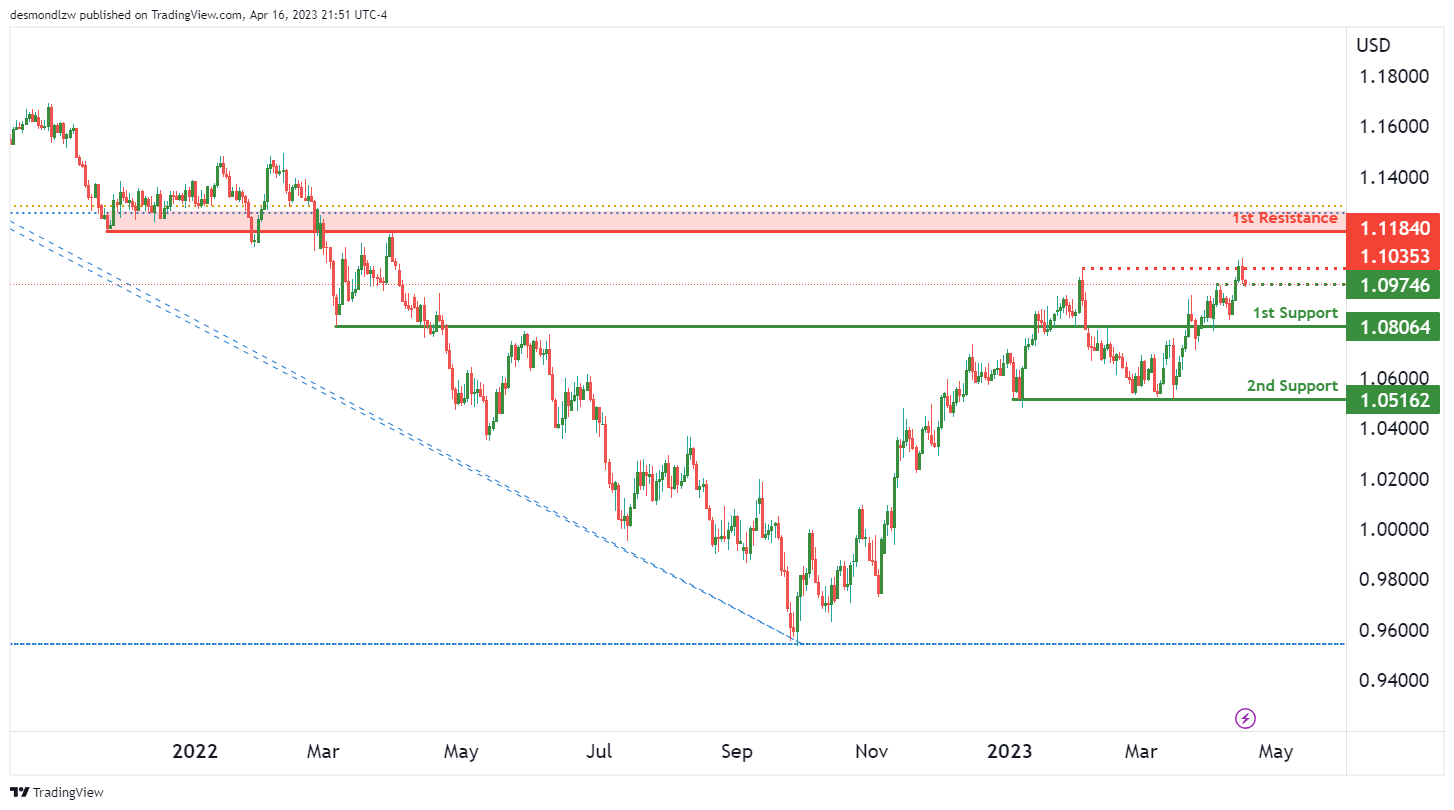
The chart of EUR/USD is currently showing bearish momentum overall, which suggests that the price could potentially make a bearish continuation towards the 1st support level.
The 1st support level for EUR/USD is at 1.0806, which is an overlap support. This level has proven to be a strong support in the past, and if the price were to break through this level, it could potentially drop towards the 2nd support at 1.0516, which is a multi-swing low support.
On the resistance side, the 1st resistance level is at 1.1184, which is an overlap resistance. This level is key to watch for potential bearish movements. Additionally, there is an intermediate resistance level at 1.1035, which is a multi-swing high resistance. If the price were to break through this intermediate resistance level, it could trigger a stronger bearish acceleration towards the 1st support.
It’s worth noting that there is also an intermediate support level at 1.0974, which is a pullback support. If the price were to bounce from this level, it could potentially rise towards the intermediate resistance at 1.1035.
GBP/USD:
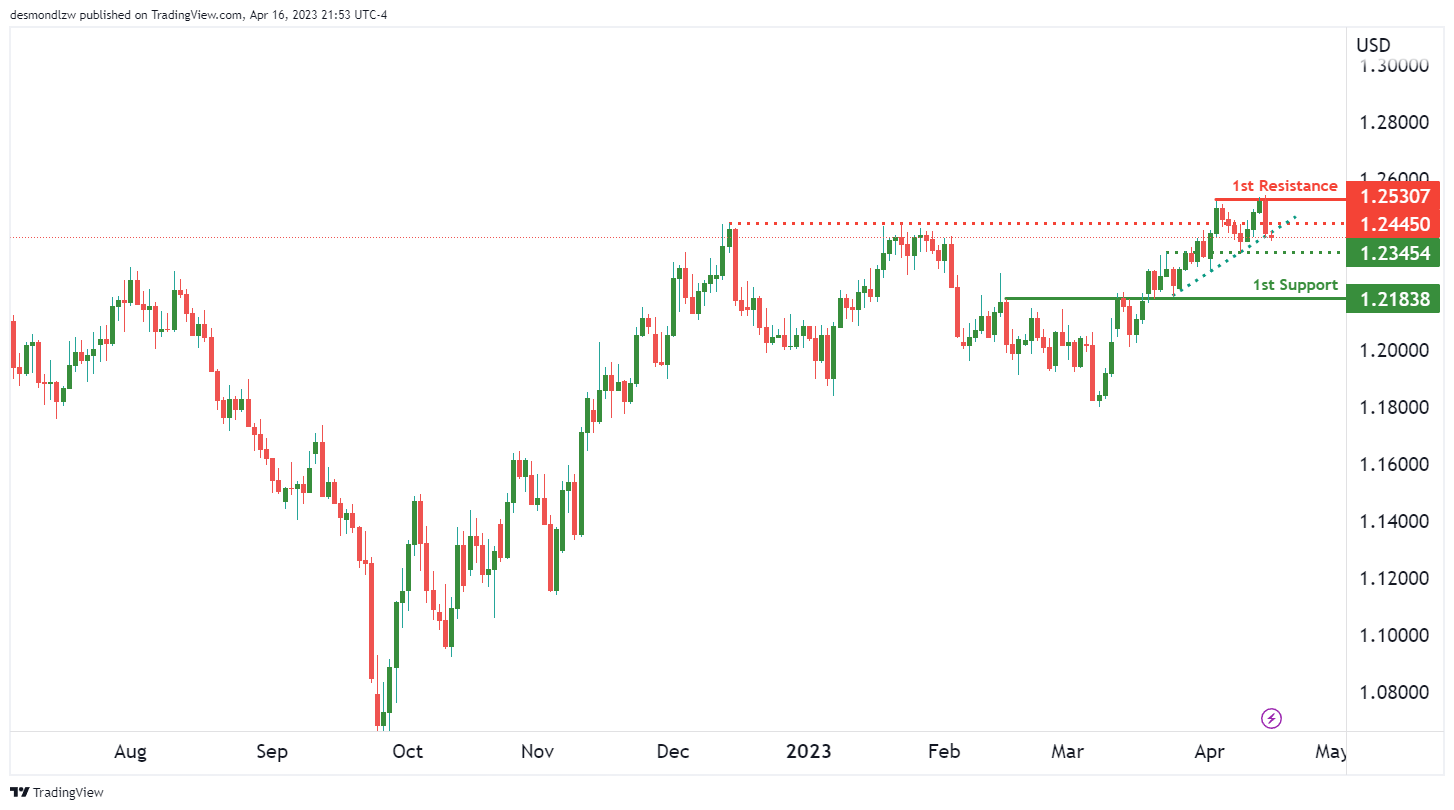
The GBP/USD, which currently shows a bearish momentum overall. This is due to the fact that the price is currently below a major descending trend line, which suggests that further bearish momentum is on the cards. Additionally, if the price were to break below the ascending trend line, it could potentially drop towards the 1st support level.
The 1st support level for GBP/USD is at 1.2183, which is an overlap support and is on an ascending trend line that acts as a support. This level has proven to be a strong support in the past, and if the price were to break through this level, it could potentially drop towards the intermediate support at 1.2345, which is also an overlap support.
On the resistance side, the 1st resistance level is at 1.2530, which is a multi-swing high resistance. This level is key to watch for potential bearish movements. Additionally, there is an intermediate resistance level at 1.2445, which is an overlap resistance. If the price were to break through this intermediate resistance level, it could trigger a stronger bullish acceleration towards the 1st resistance.
USD/CHF:
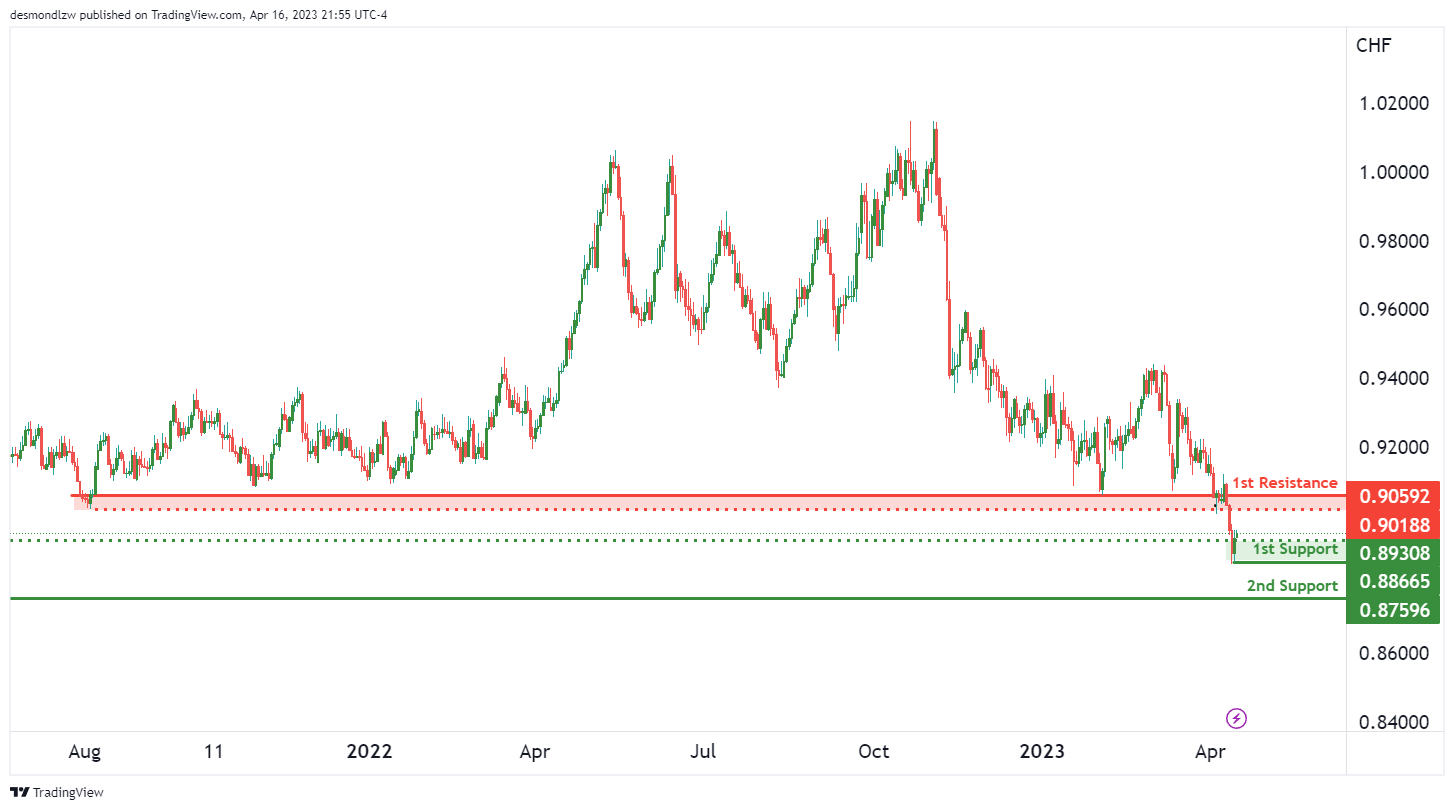
The chart of USD/CHF, which currently shows a bullish momentum overall. This suggests that the price could potentially continue to rise further, with the potential to make a bullish continuation towards the 1st resistance level.
The first support level for USD/CHF is at 0.8866, which is a multi-swing low support. This level has proven to be a strong support in the past, and if the price were to bounce from this level, it could rise towards the 1st resistance at 0.9059. The 1st resistance level is an overlap resistance, making it a key level to watch for potential bullish movements.
If the price were to break through the 1st resistance, it could potentially rise towards the intermediate resistance at 0.9018, which is a pullback resistance. However, if the price were to drop instead, the 2nd support level is at 0.8759, which is a swing low support.
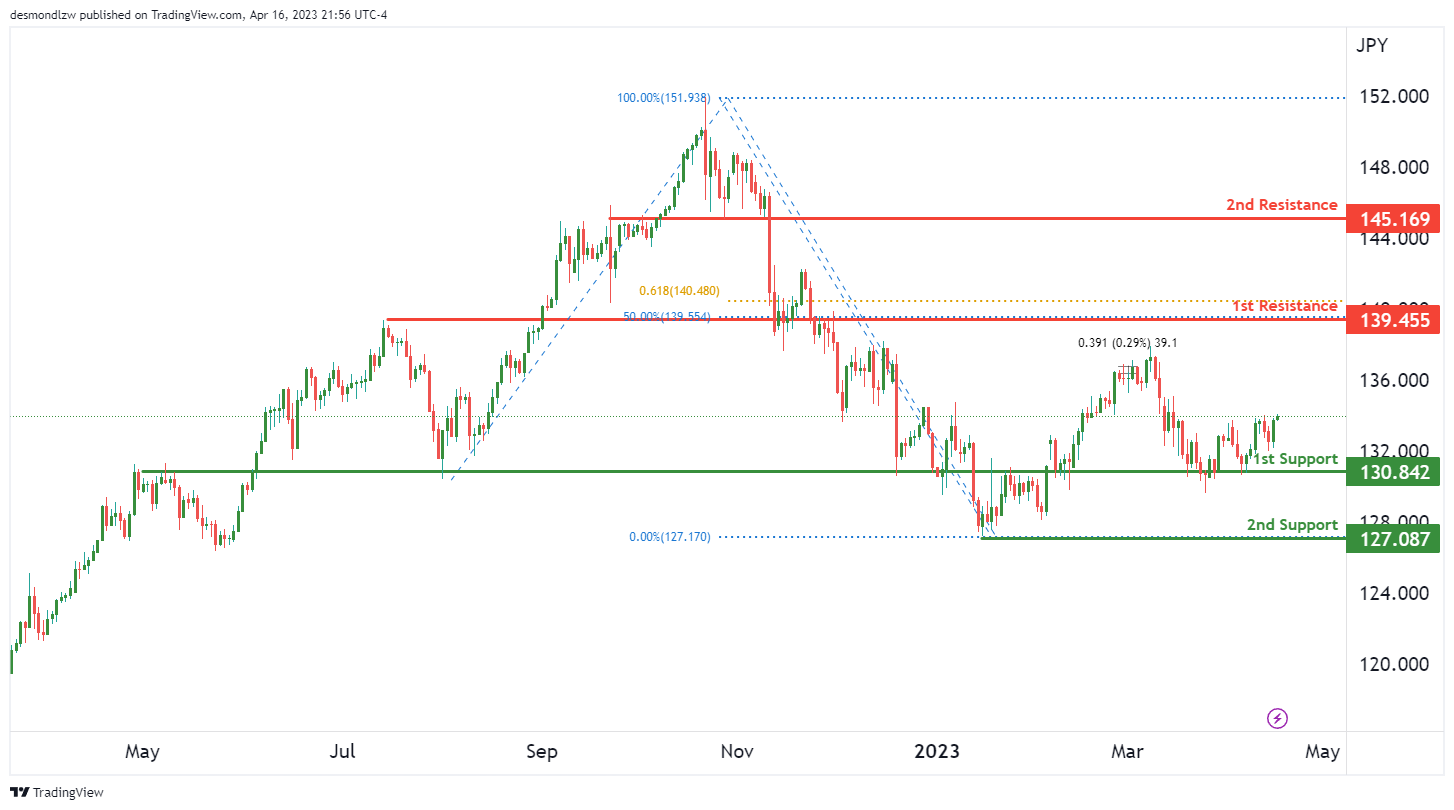
USD/JPY:
The chart of USD/JPY, which currently shows a bullish momentum overall. This suggests that the price could potentially continue to rise further, with the potential to make a bullish continuation towards the 1st resistance level.
The first support level for USD/JPY is at 130.84, which is an overlap support. This level has proven to be a strong support in the past, and if the price were to bounce from this level, it could rise towards the 1st resistance at 139.45. The 1st resistance level is an overlap resistance and also coincides with a 50% Fibonacci retracement, making it a key level to watch for potential bullish movements.
If the price were to break through the 1st resistance, it could potentially rise towards the 2nd resistance at 145.16, which is a pullback resistance. However, if the price were to drop instead, the 2nd support level is at 127.08, which is a swing low support.
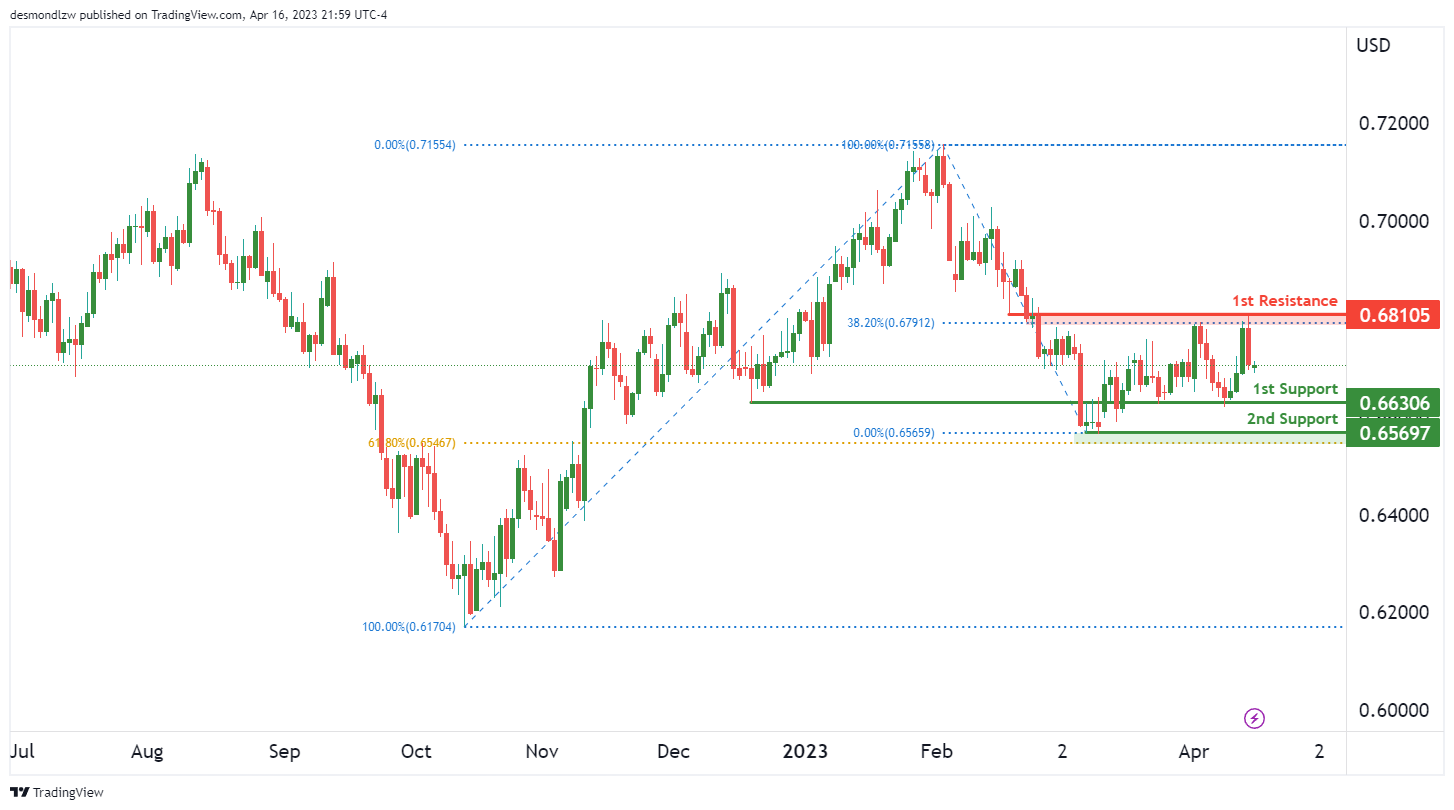
AUD/USD:
The chart of AUD/USD, which currently shows a bearish momentum overall. This suggests that the price could potentially continue to drop further, with the potential to make a bearish continuation towards the 1st support level.
The 1st support level for AUD/USD is at 0.66, which is an overlap support. This level has proven to be a strong support in the past and is currently at a 61.80% Fibonacci retracement. If the price were to break through this support level, it could potentially drop towards the 2nd support at 0.66, which is a multi-swing low support.
On the resistance side, the 1st resistance level is at 0.68, which is a pullback resistance and also coincides with a 38.20% Fibonacci retracement. If the price were to break through this resistance level, it could potentially rise towards the next resistance level. However, with the current bearish momentum in the chart of AUD/USD, a drop towards the support levels is more likely.
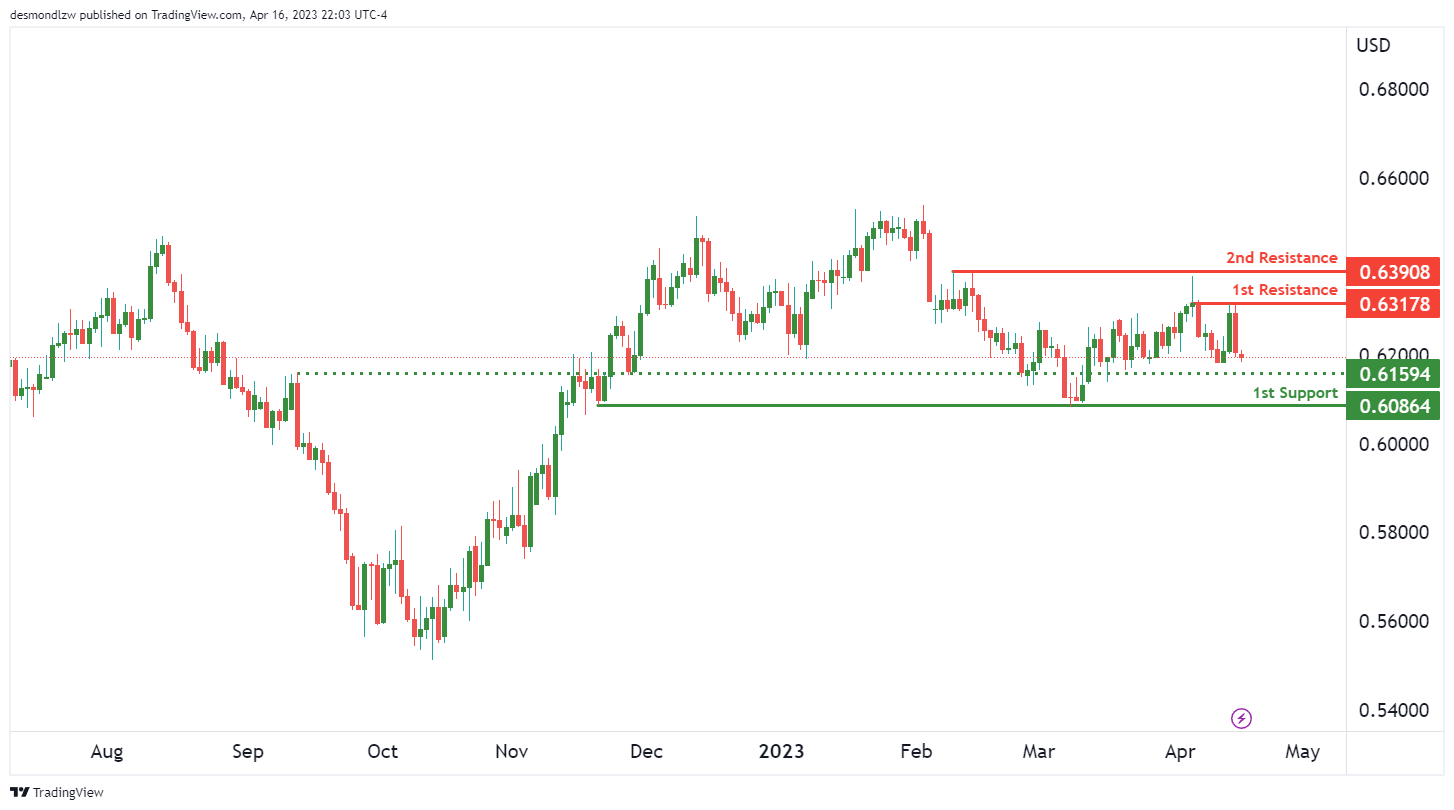
NZD/USD:
the chart of NZD/USD, which currently shows a bearish momentum overall. This suggests that the price could potentially continue to drop further, with the potential to make a bearish continuation towards the 1st support level.
The first support level for NZD/USD is at 0.6086, which is a multi-swing low support. This level has proven to be a strong support in the past and is currently an attractive entry point for investors looking to invest in this particular asset. If the price were to bounce from this level, it could potentially rise towards the intermediate support level at 0.6159, which is an overlap support.
On the resistance side, the 1st resistance level is at 0.6317, which is a multi-swing high resistance. If the price were to break through this resistance level, it could potentially rise towards the 2nd resistance level at 0.6390, which is another multi-swing high resistance.
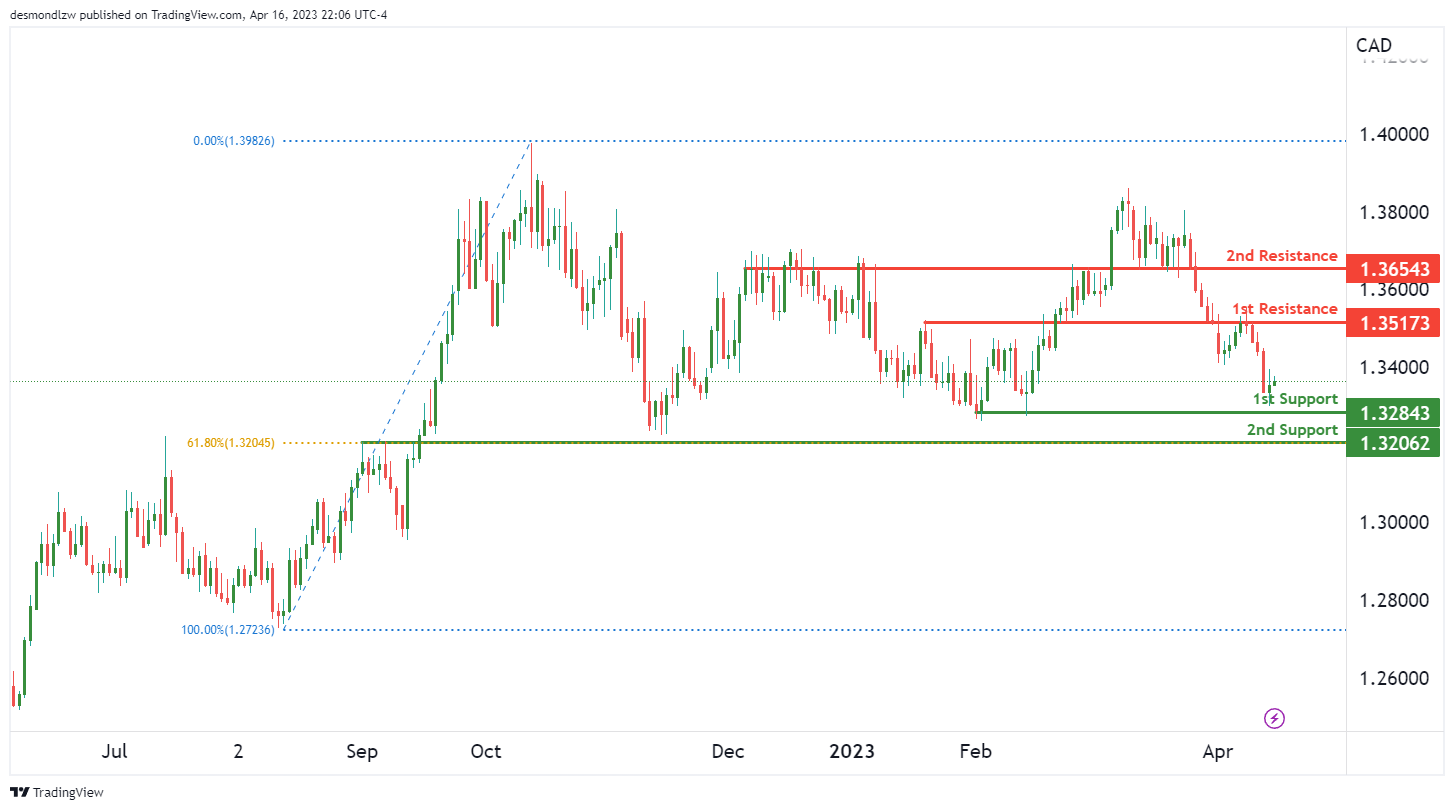
USD/CAD:
The overall momentum of the USD/CAD chart is currently bullish, suggesting that prices may continue to rise. In addition, the price is currently above the Ichimoku cloud, which further supports the bullish sentiment.
Looking at the support and resistance levels, we can see that the 1st support is at 1.3284. This level is a multi-swing low support and could potentially act as a key level for buyers to enter the market. The 2nd support is at 1.3206, and this level is an overlap support, adding to its significance as a potential buying zone.
On the resistance side, the 1st resistance is at 1.3517, which is an overlap resistance. This level is also important as it coincides with the 23.6% Fibonacci retracement level. If the price were to break above this level, it could potentially rise to the 2nd resistance at 1.3654. This level is a pullback resistance, adding to its significance as a potential target for buyers.
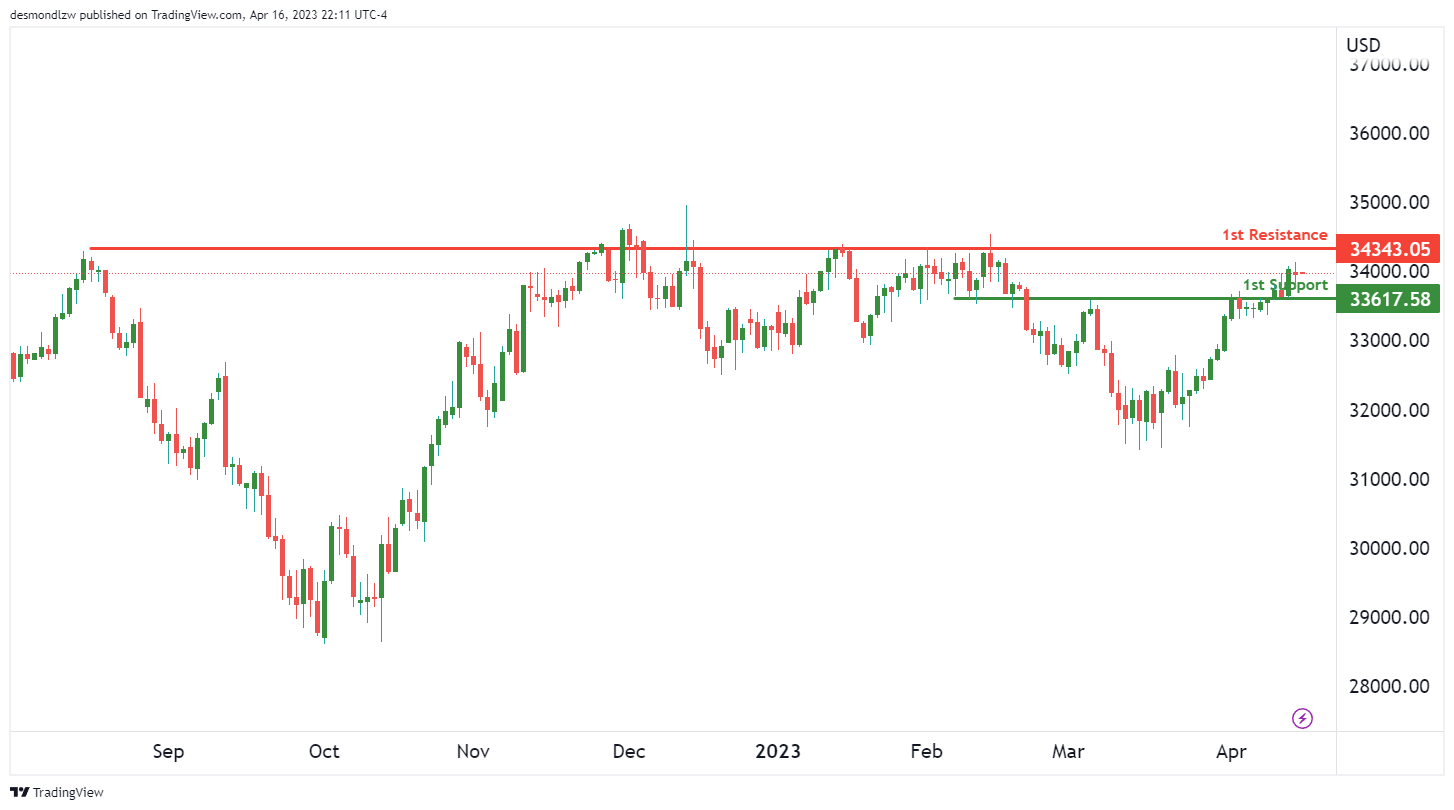
DJ30:
The DJ30 chart is currently showing neutral momentum, with price potentially fluctuating between the 1st support and 1st resistance levels. The 1st support level is at 33617.58, which is an overlap support. On the other hand, the 1st resistance level is at 34343.05, which is a multi-swing high resistance.
While the overall momentum is neutral, the DJ30 chart could see some movement as price fluctuates between these two levels. It’s important to note that breakouts from these levels may not be high conviction in nature due to the lack of a clear trend and momentum.
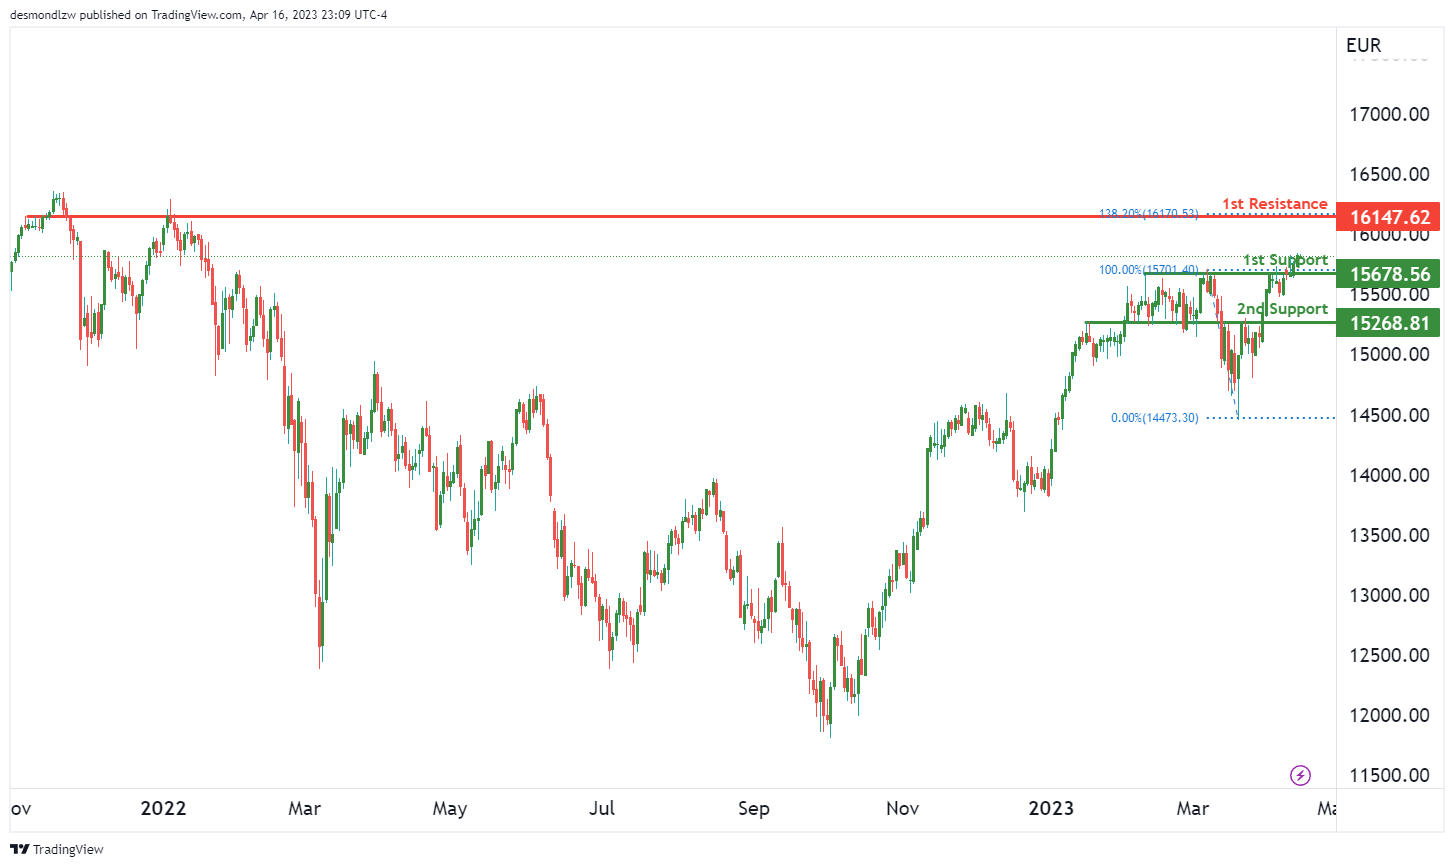
GER30:
The GER30 chart currently shows a bullish momentum, suggesting that prices may continue to rise. The current price could potentially make a bullish continuation towards the 1st resistance level. This indicates that the market is in an uptrend and may continue to be so for the foreseeable future.
In terms of support, the 1st support level is at 15678.56, which is a good pullback support. The 2nd support level at 15268.81 is also a pullback support, and both levels are below the current price. If the price falls, these levels may provide support and prevent the price from falling further.
On the other hand, the 1st resistance level at 16147.62 is a good overlap resistance level, with a 138.20% Fibonacci Extension. This level is above the current price, and if the price rises, this level may provide resistance and prevent the price from rising further.
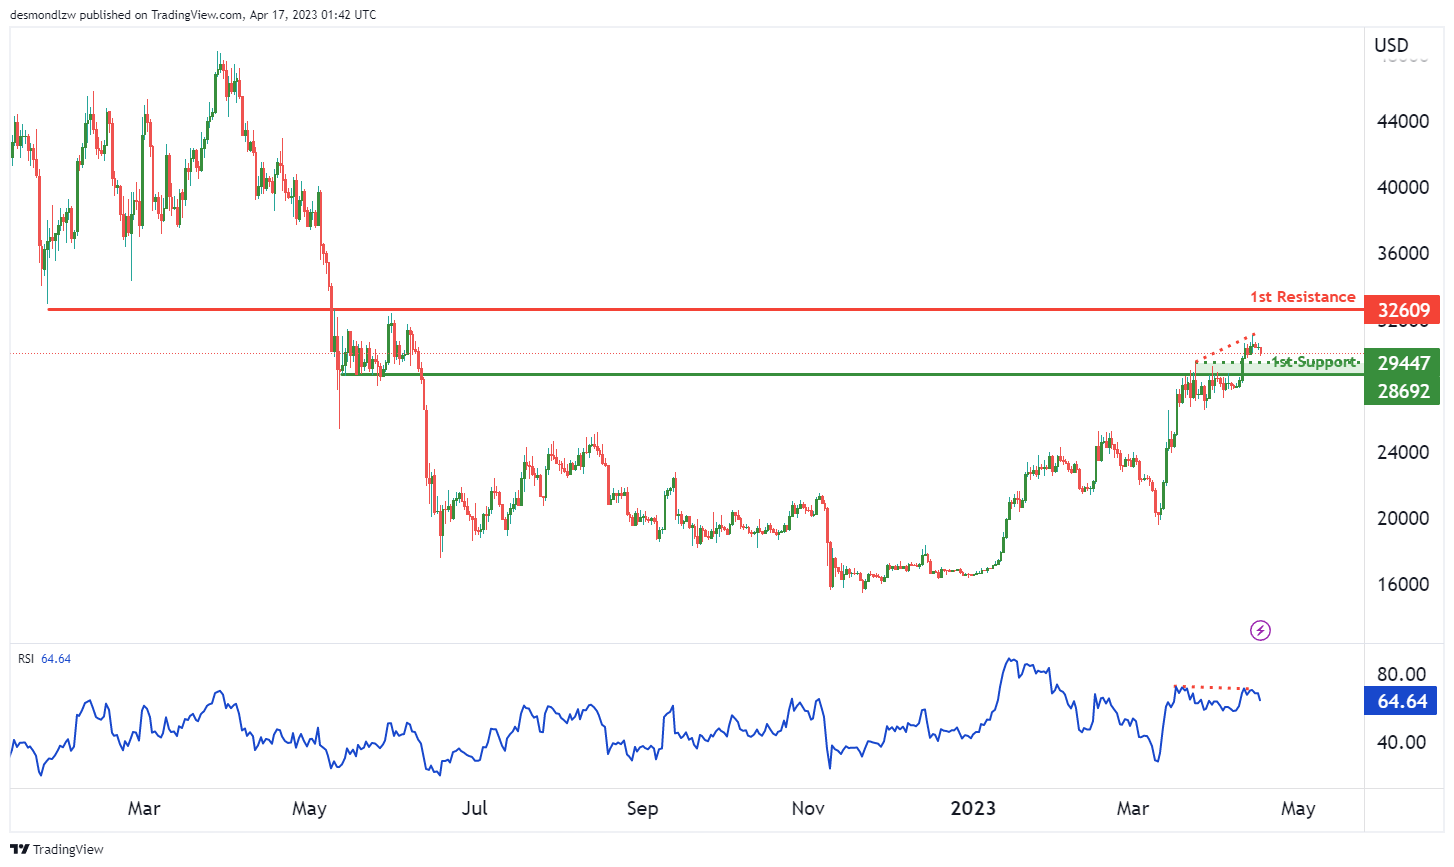
BTC/USD:
Bitcoin Analysis: Potential Short-Term Drop Before Reaching 1st Resistance
The overall momentum of the Bitcoin chart is currently bullish. However, it seems that price could potentially drop further in the short term before rising towards the first resistance level.
At the moment, price is testing the 1st support at 28692. This level is a pullback support and could potentially act as a bouncing point for price to rise towards the 1st resistance at 32609. However, there is an intermediate support at 29447 which is also a pullback support, suggesting that price may drop further in the short term before bouncing from there.
It’s worth noting that the RSI is displaying bearish divergence versus price, indicating that a reversal might occur soon.
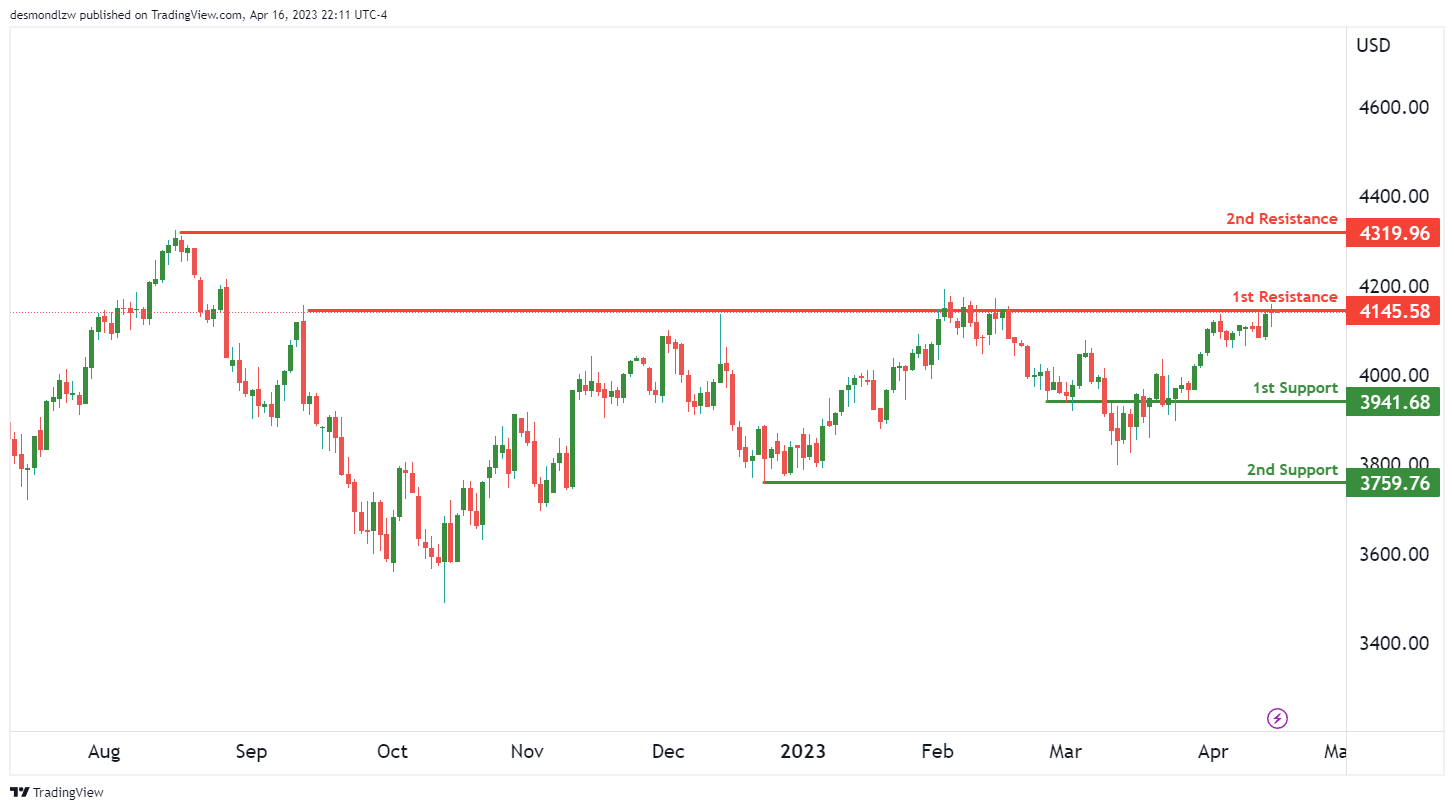
US500
The US500 chart is currently showing a bearish momentum. There is a potential for a bearish reaction off the 1st resistance at 4145.58, which is a strong multi-swing high resistance level. Additionally, there is a 2nd resistance level at 4319.96 which is a swing high resistance.
On the other hand, there are support levels to look out for. The 1st support level is at 3941.68 which is a strong overlap support level, while the 2nd support level is at 3759.76 which is a swing low support.
If price were to break the 1st resistance, it could potentially rise towards the 2nd resistance level. However, given the overall bearish momentum of the chart, it is more likely that price will drop towards the 1st support level.
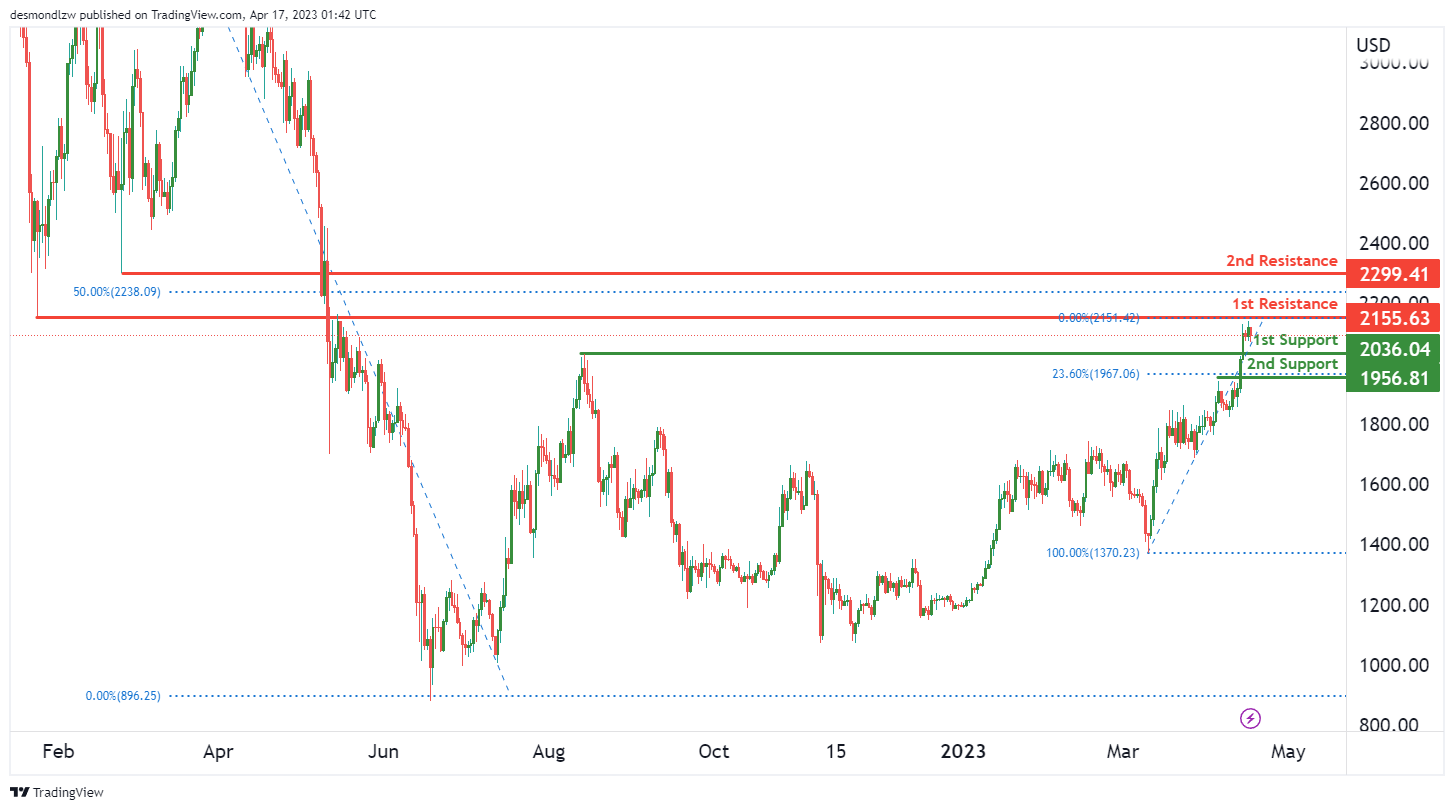
ETH/USD:
The price of ETH/USD has been showing bearish momentum on the chart, with potential for a continuation towards the 1st support at 2036.04, which is a pullback support level. Another support level to consider is the 2nd support at 1956.81, which is also a pullback support and aligns with the 23.6% Fibonacci retracement level.
On the resistance side, the 1st resistance is at 2155.63, which is a strong overlap resistance level. If the price manages to break above this level, it could potentially rise towards the 2nd resistance at 2299.41, which is a pullback resistance level. However, given the bearish momentum of the chart, it is more likely that the price will continue to drop towards the support levels rather than break above the resistance levels.
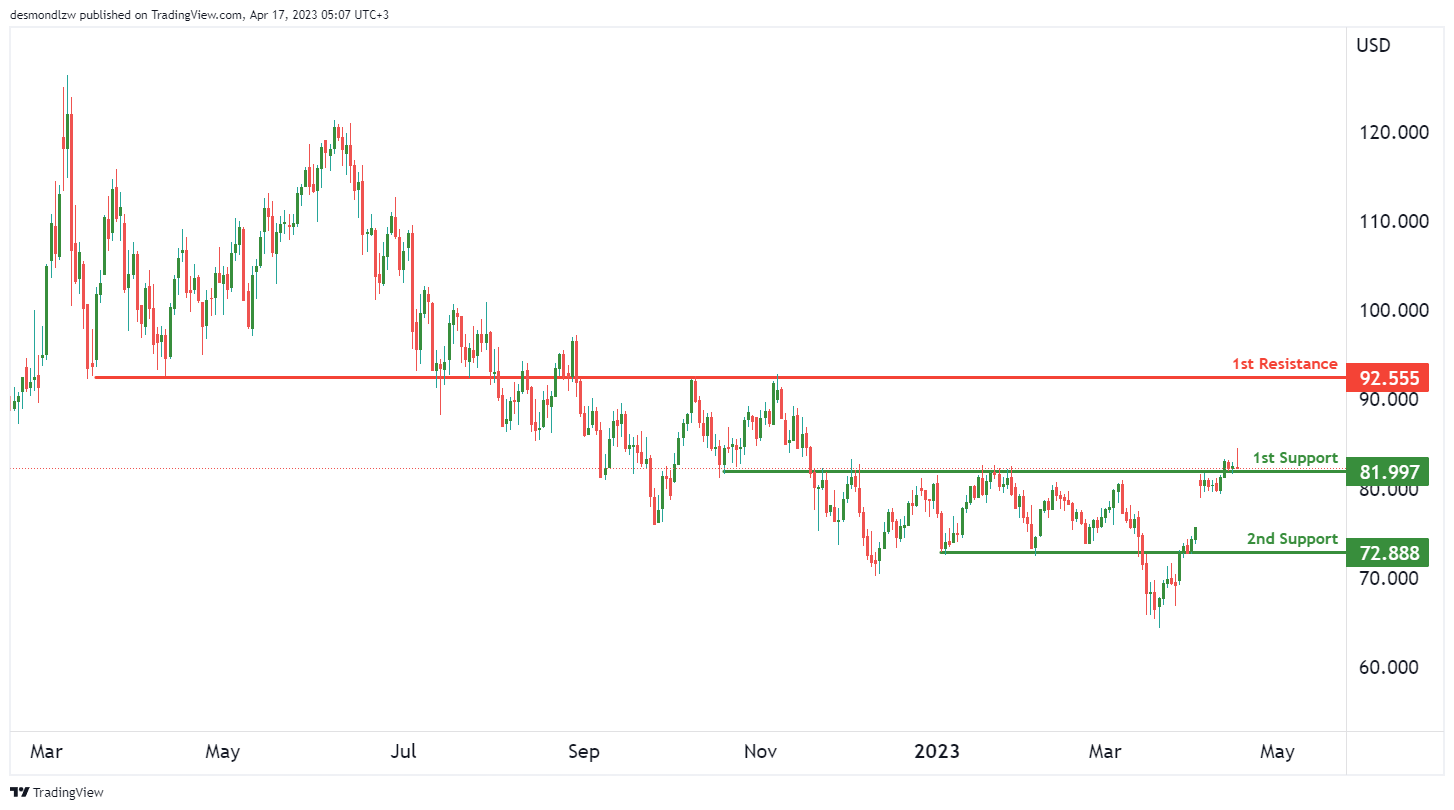
WTI/USD:
The price of WTI has been showing bullish momentum on the chart. However, in the short term, the price could potentially retrace towards the 1st support at 81.99, which is a strong overlap support level. If the price bounces off this support, it could resume its bullish momentum towards the 1st resistance at 92.55, which is also an overlap resistance level.
If the price were to drop below the 1st support, it could potentially fall towards the 2nd support at 72.88, which is another overlap support level. It’s worth noting that a drop towards the 2nd support is not our base scenario, but it is a possible scenario to keep in mind.
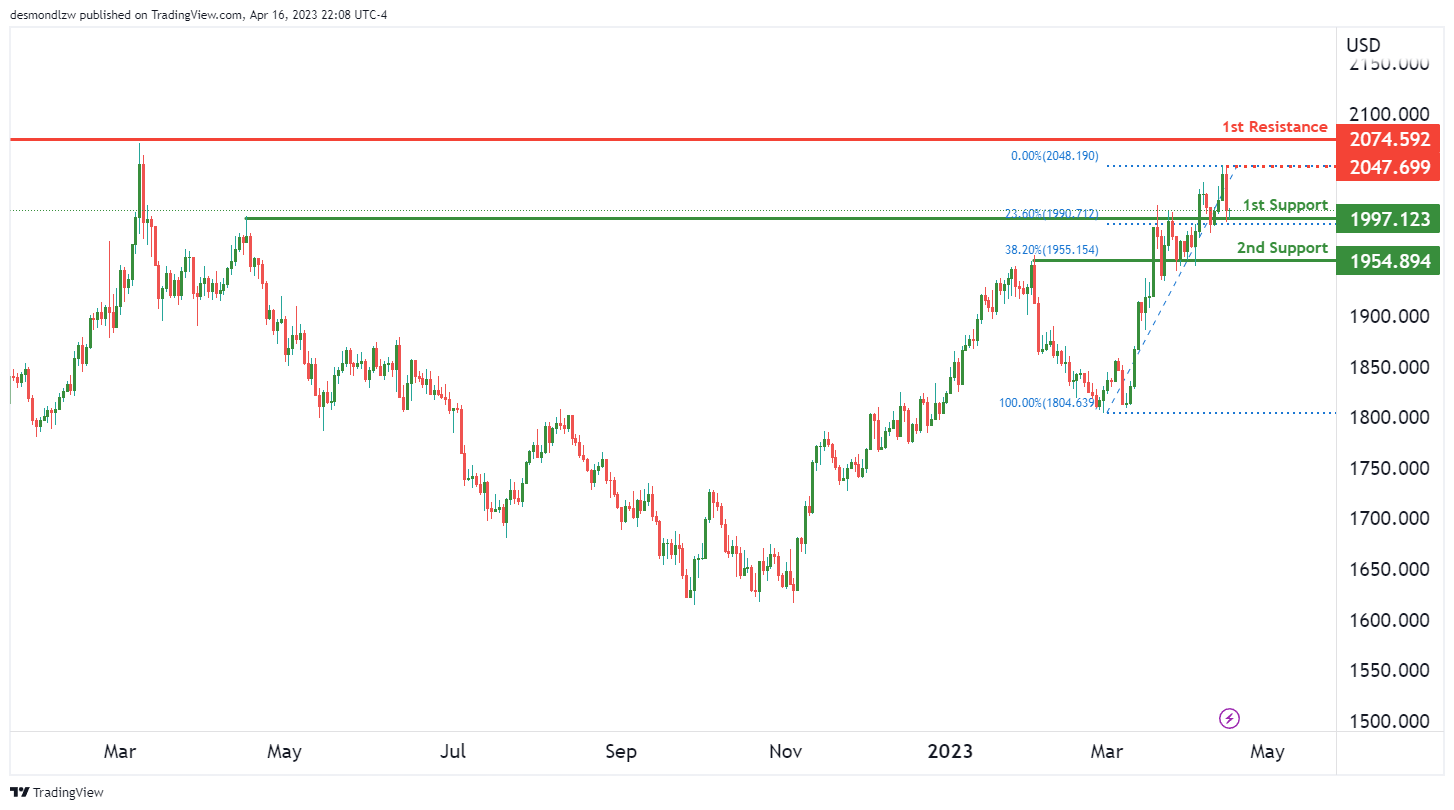
XAU/USD (GOLD):
The XAU/USD chart is currently showing bullish momentum, and the price could potentially drop in the short term towards the 1st support at 1997.12, which is a strong overlap support level and also aligns with the 23.6% Fibonacci retracement level. If the price breaks below this level, it could drop further towards the 2nd support at 1954.89, which is also an overlap support and aligns with the 38.2% Fibonacci retracement level.
On the resistance side, the 1st resistance is at 2070.59, which is a swing high resistance level. If the price manages to break above this level, it could potentially rise towards the intermediate resistance at 2047.69, which is also a swing high resistance. Overall, the chart suggests that the momentum is bullish, and the price may continue to rise towards the resistance levels after a short-term drop towards the support levels.


