
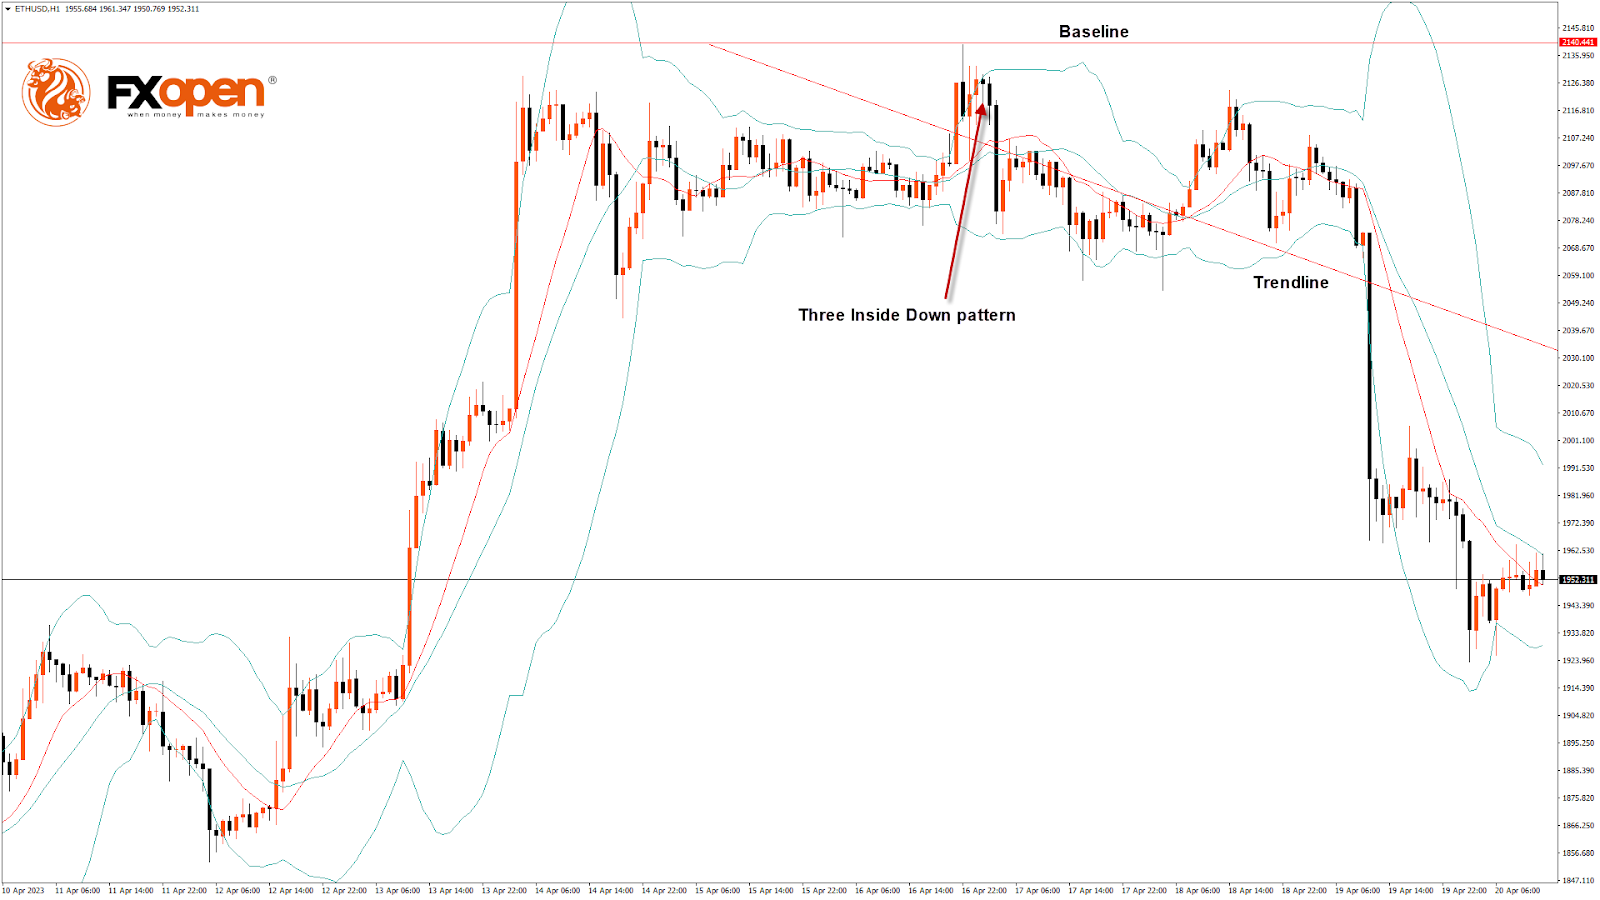
Bulls couldn’t keep control of the market, and after touching a high of $2,140 on 16 April, the ETH/USD pair declined, touching a low of $1,923 today in the early Asian trading session.
ETHUSD is under bearish pressure after falling below the $2,000 psychological support level as the global investor sentiment appears weak after the Shanghai upgrade.
The three inside down pattern is below the $2,140 handle on the H1 timeframe. It’s a bearish pattern, which signifies the end of a bullish phase. Also, there is a bearish harami pattern in the H2 timeframe.
ETH is back under the pivot point, indicating the bearish pressure in the market.
The relative strength index is at 37.74, indicating very weak demand for Ether and a continuation of the selling pressure in the market.
The STOCHRSI is giving an overbought signal, meaning that the price is expected to decline in the short-term range.
We also detected the formation of the bearish harami pattern in both the 30-minute and 1-hour timeframe.
Most of the technical indicators are bearish. Most moving averages are bearish at the current market level of $1,944.
ETH is now trading below the 100-hour simple and 200-hour exponential moving averages.
- ETH bearish reversal is seen below the $2,140 mark.
- The short-term range is expected to be strongly bearish.
- The average true range indicates low market volatility.
ETH Bearish Reversal Is Below $2,140
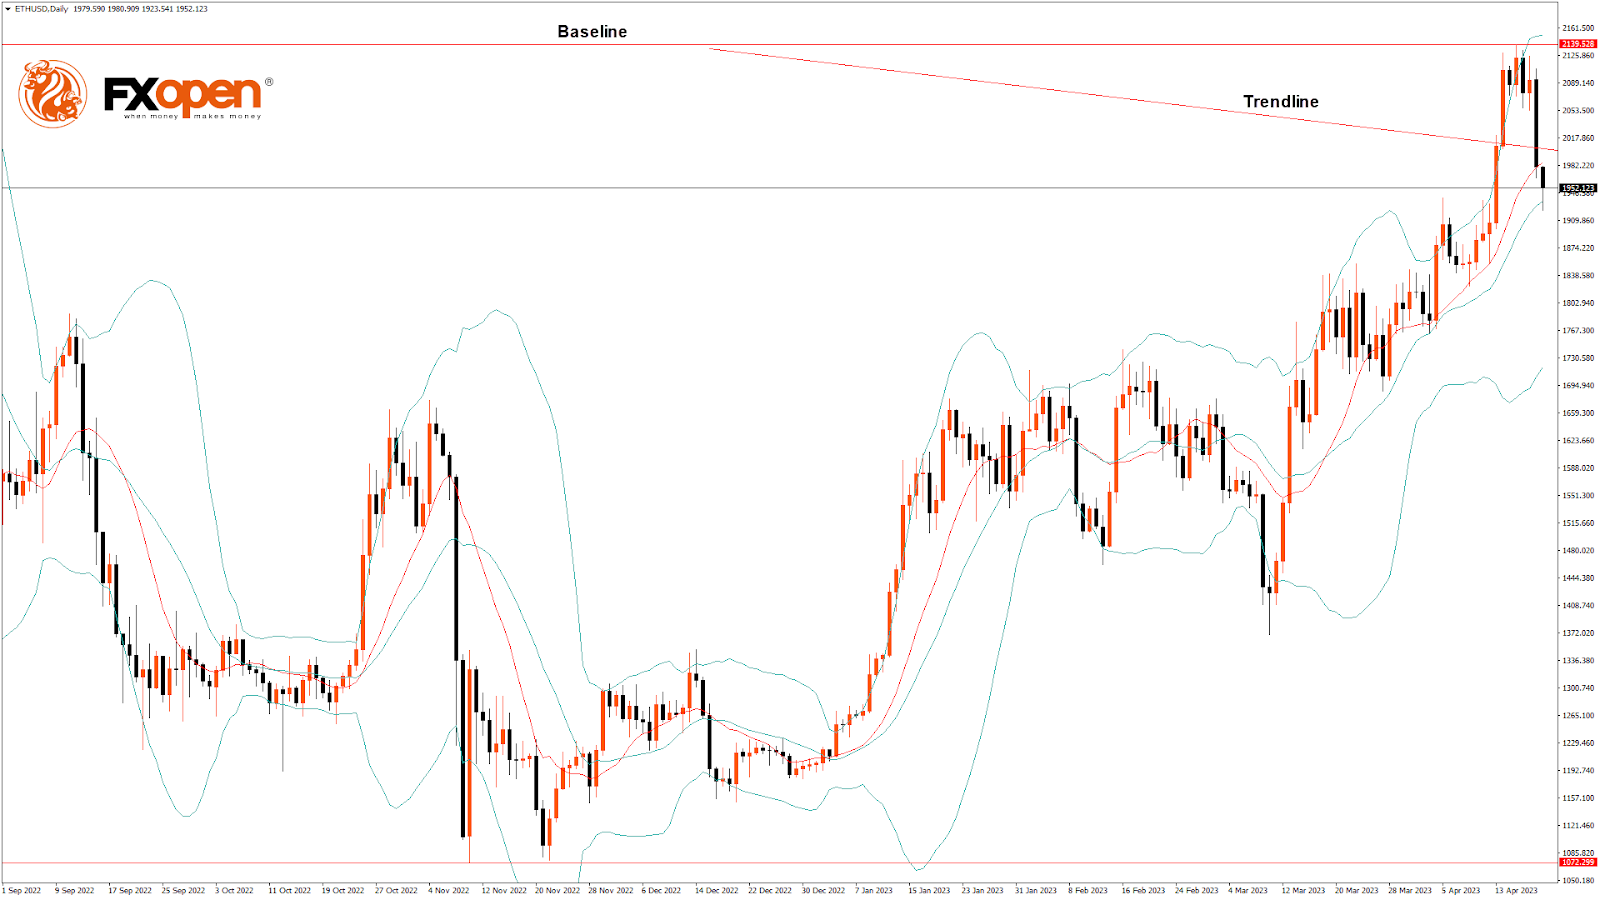
On the daily chart, ETH is trading just below its pivot level of $1,955 and is moving into a very strong bearish channel. The price is about to break its classic support level of $1,939 and has already broken its Fibonacci resistance level of $1,951; further supports are $1,910 and $1,850.
An Ichimoku bearish crossover between Tenkan and Kijun is formed in the 15-minute timeframe.
The price ranges near the channel’s resistance in the 15-minute timeframe, indicating the bearish trend.
The key support levels to watch are $1,845, which is a 38.2% retracement from the 13-week high, and $1,861, which is a 14-day RSI at 50.
The Week Ahead
ETH is correcting lower below $2,000, indicative of the bearish momentum, and is expected to move towards the $1,900 level in the medium-term range in the H1 timeframe.
We see a short-term bearish trend line forming from $2,140 towards the $1,937 level.
There is a minor bearish trend line with the resistance at $1,994, at which the price crosses the 9-day moving average.
The immediate short-term outlook for ETH has turned mildly bearish, the medium-term outlook has turned bearish, and the long-term outlook is neutral in present market conditions.
The resistance zone is at $2,018, which is a pivot point, and at $2,063, which is 14-3 daily raw stochastic at 80.
The weekly outlook is $1,850 with a consolidation zone of $1,900.


