
As we move away from the bank crisis and de-dollarization concerns, a significant question on the minds of many traders is whether the US Dollar will experience a corrective rebound from its current position. This is a crucial question because it will set a precedent for predicting the price action of various commodities, particularly gold. To answer this question, let’s examine the current price action on the charts and determine whether the US Dollar will strengthen in April after several weeks of bearish momentum.
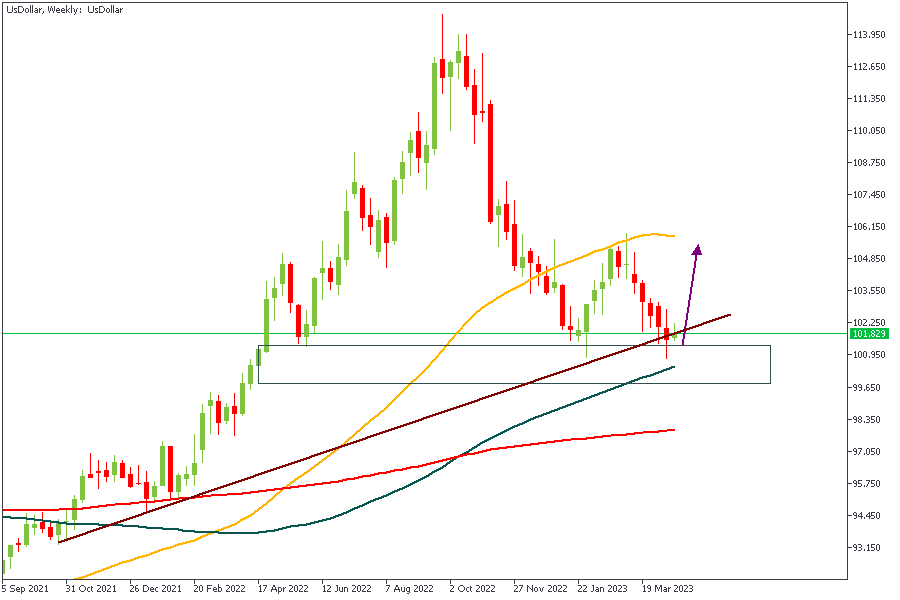
US DOLLAR – Weekly Timeframe
The US Dollar chart on the weekly timeframe shows the price currently around a key rally-base-rally demand zone with a confluence of trendline support, the 100-Period Moving Average, and a bullish array from the moving average positions. This confirms, to a large extent, the bullish sentiment and the expectation of a reversal from the Dollar in April.
Analysts’ Expectations:
- Direction: Bullish
- Target: 103.933
- Invalidation: 99.629
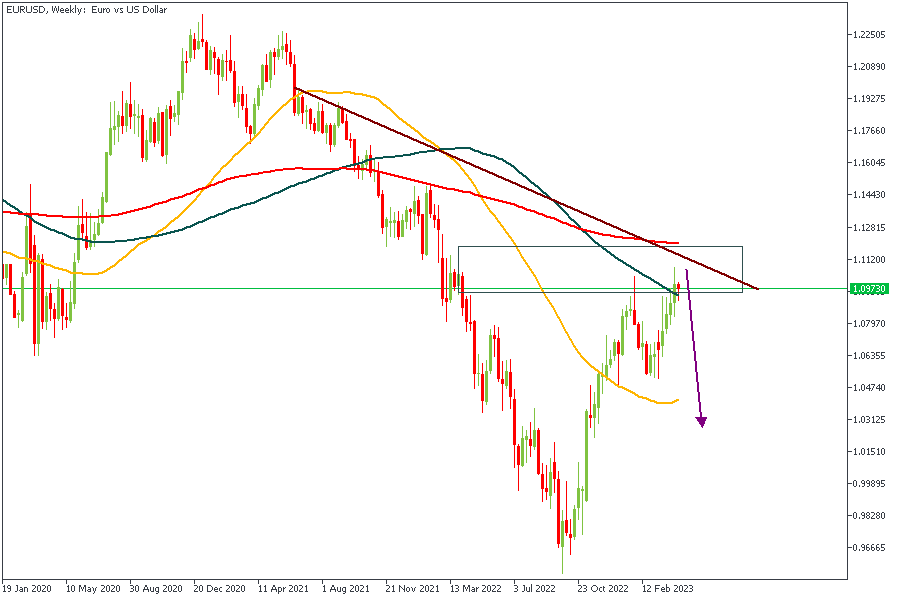
EURUSD – Weekly Timeframe
EURUSD has reached an important drop-base-drop supply zone on the weekly timeframe. A resistance trendline intersects this supply zone and the 100-Period Moving Average. Considering the manner of arrangement of the Moving Averages and the 88% of the Fibonacci retracement, we will likely see a big bearish movement away from the supply zone.
Analysts’ Expectations:
- Direction: Bearish
- Target: 1.07088
- Invalidation: 1.11839
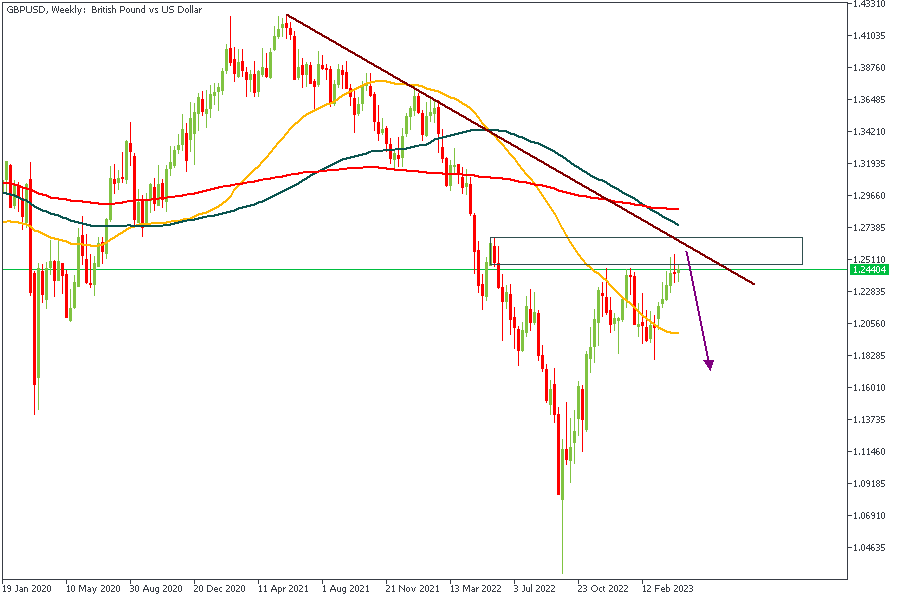
GBPUSD – Weekly Timeframe
Similar to the EURUSD scenario, we find GBPUSD playing out within a rally-base-drop supply zone with the trendline intersection. The 100-Period Moving Average is also within close reach of the current price spot, which could contribute to the bearish movement as a resistance level.
Analysts’ Expectations:
- Direction: Bearish
- Target: 1.21033
- Invalidation: 1.26882
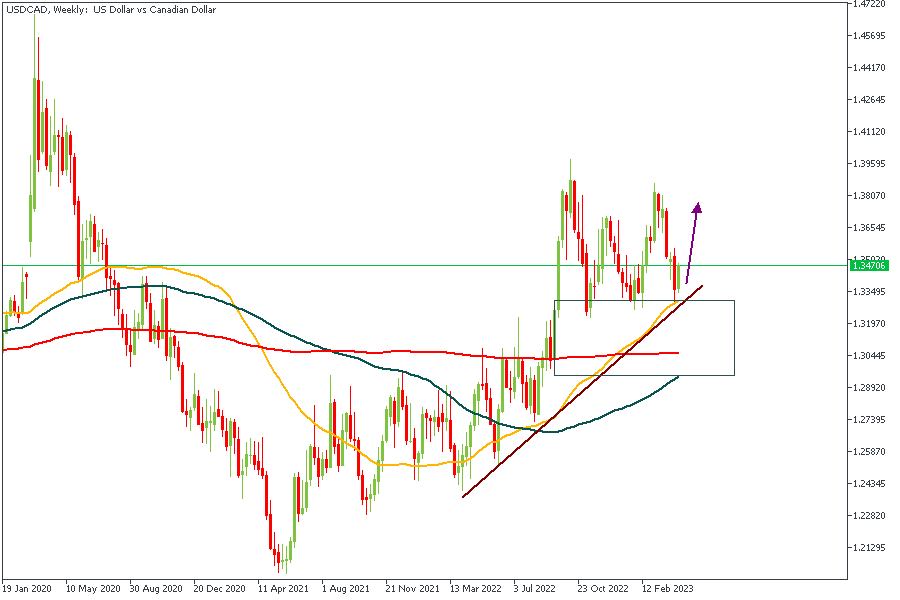
USDCAD – Weekly Timeframe
If the US Dollar truly plays out stronger, it would lead to a bullish price action here on the weekly timeframe of USDCAD. As a result, we need to check for factors that may contribute to the bullish outcome. First, the rally-base-rally demand zone and the 50-Period Moving Average serve as the initial confirmation. At the same time, the trendline support and the 76% of the Fibonacci retracement tool can be considered secondary confirmation factors. Overall, the bullish sentiment seems valid beyond any doubt.
Analysts’ Expectations:
- Direction: Bullish
- Target: 1.38227
- Invalidation: 1.29965
CONCLUSION
The trading of CFDs comes at a risk. Thus, to succeed, you have to manage risks properly. To avoid costly mistakes while you look to trade these opportunities, be sure to do your due diligence and manage your risk appropriately.


