
DXY:
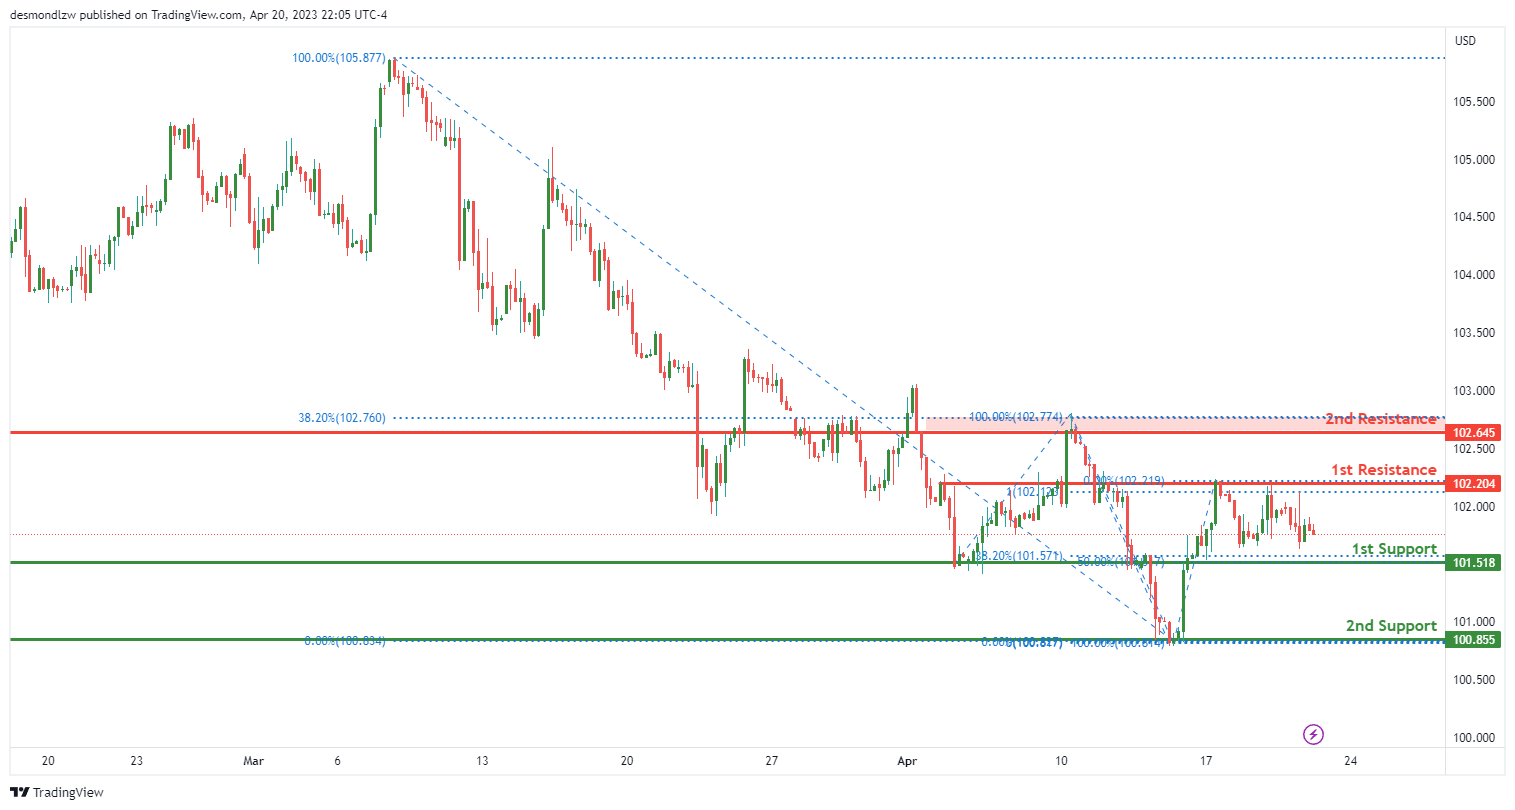
The DXY chart currently shows a neutral momentum overall, which suggests that the price could potentially fluctuate between the 1st resistance and 1st support levels.
The 1st support level for DXY is at 101.51, which is an overlap support and also lines up with the 38.2% Fibonacci retracement level. This level has proven to be a strong support in the past. If the price were to drop from the current level, it could potentially reach this support level.
The 2nd support level is at 100.85, which is a swing low support level. This level has also provided strong support in the past and could potentially act as a target for a further drop in price.
On the resistance side, the 1st resistance level is at 102.20, which is an overlap resistance level and lines up with the 100% Fibonacci projection. This level is key to watch for potential bearish movements.
The 2nd resistance level is at 102.64, which is also an overlap resistance and coincides with the 38.2% Fibonacci retracement level. If the price were to break through this level, it could potentially trigger a stronger bullish acceleration towards the 1st resistance.
EUR/USD:
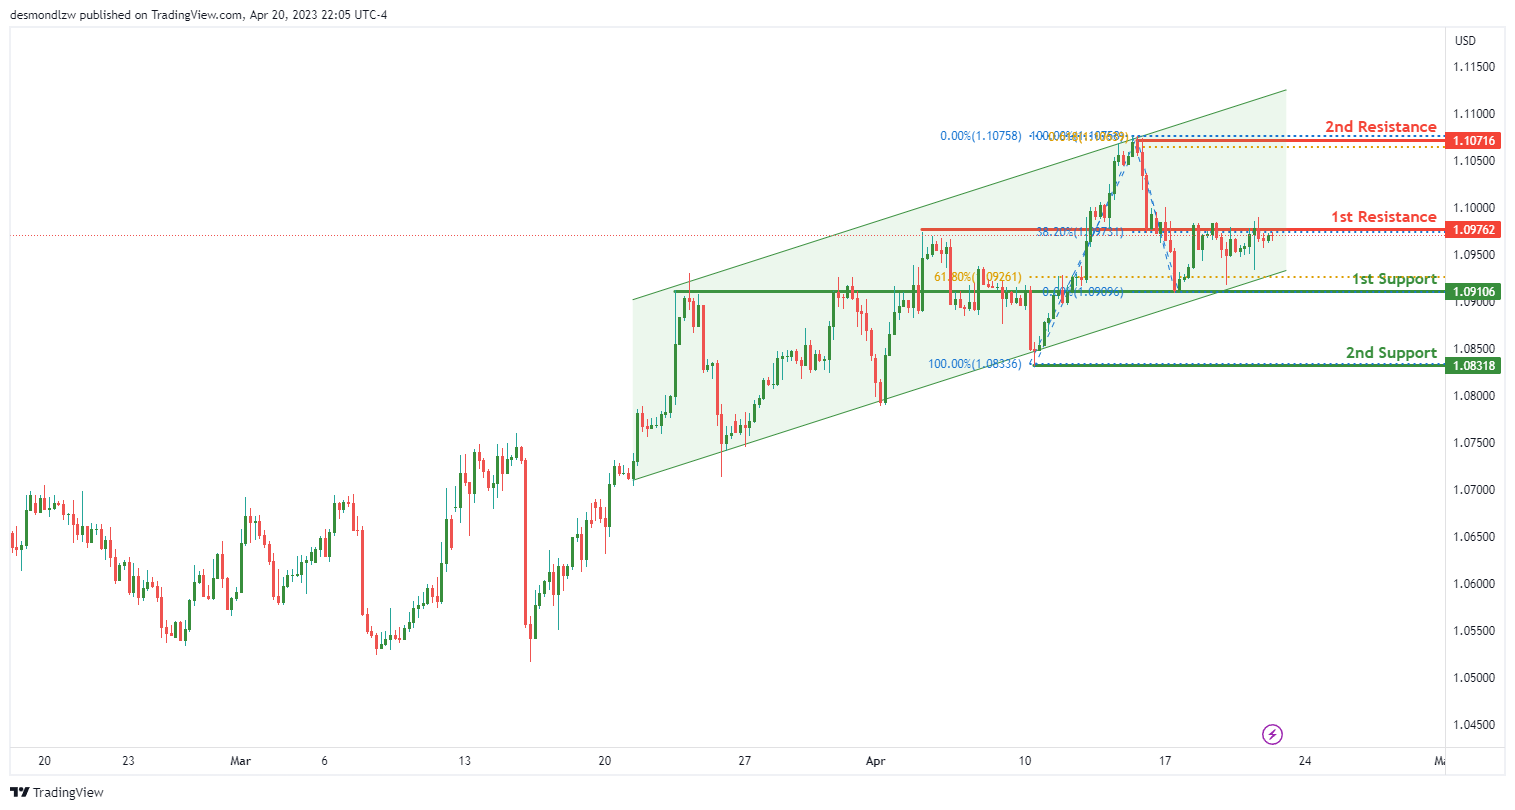
The EUR/USD chart is showing bullish momentum overall, as it is currently within a bullish ascending channel, suggesting that price may continue to rise due to its bullish momentum.
Looking at the support and resistance levels, the 1st support is at 1.0910, which is an overlap support that lines up with a 61.80% Fibonacci retracement. This level has proven to be strong in the past and could potentially act as support for price. If the price were to break below this level, it could drop towards the 2nd support at 1.0831, which is a swing low support.
On the resistance side, the 1st resistance level is at 1.0976, which is an overlap resistance and lines up with a 38.20% Fibonacci retracement. If the price were to break through this resistance level, it could trigger a bullish acceleration towards the 2nd resistance level at 1.1071, which is also an overlap resistance and lines up with a 61.80% Fibonacci projection.
GBP/USD:
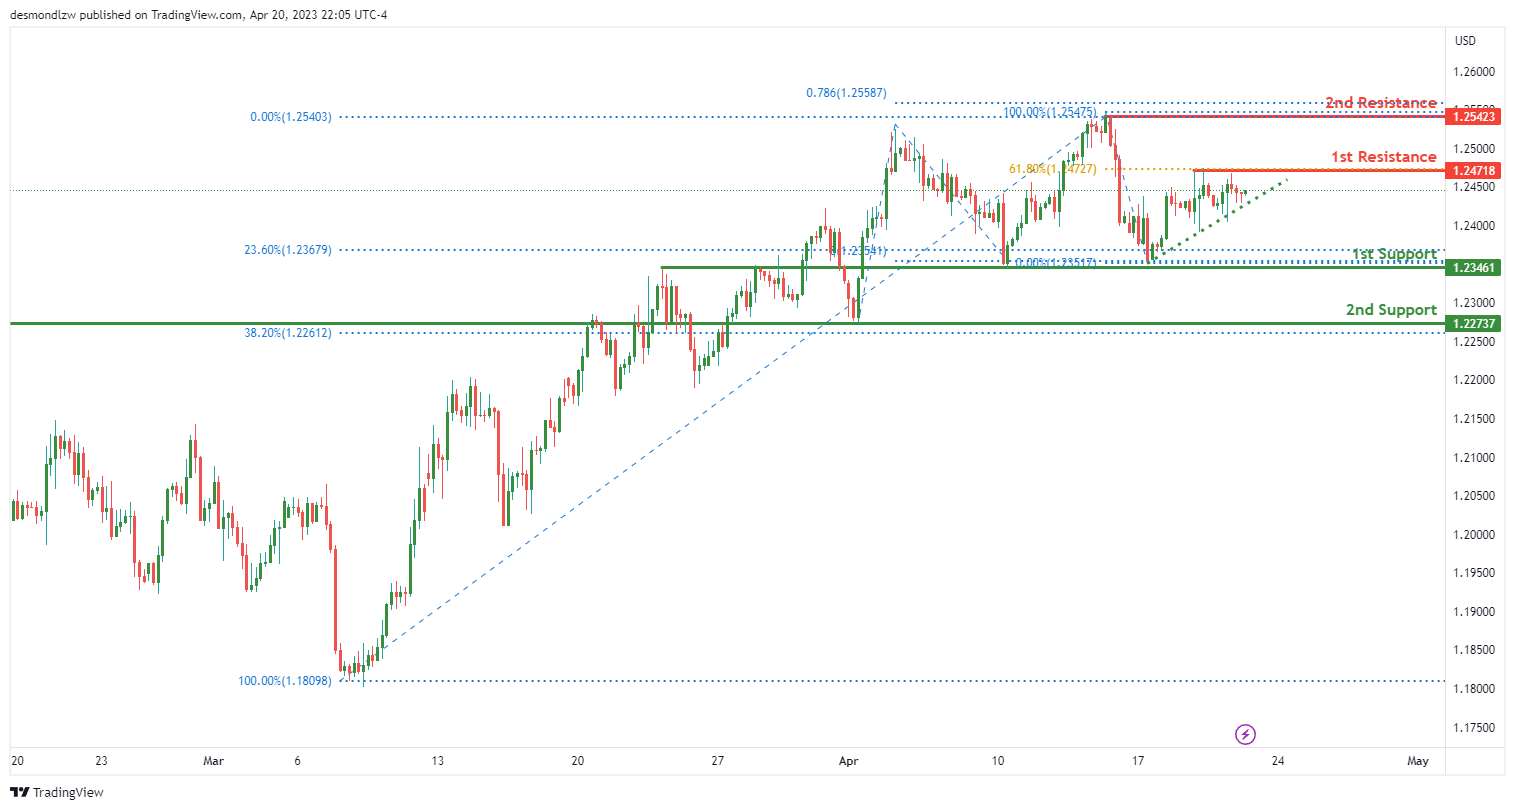
The GBP/USD chart is showing strong bullish momentum overall, as price is above a major ascending trend line and on an ascending trend line which acts as support. This suggests further bullish momentum is likely to continue.
Price has the potential to make a bullish break through the 1st resistance and rise towards the 2nd resistance.
On the support side, the 1st support is at 1.2346 which is an overlap support and has a 23.6% Fibonacci retracement lining up with it. This level has the potential to act as strong support if price were to bounce from here. The 2nd support is at 1.2273 which is also an overlap support and has a 38.2% Fibonacci retracement lining up with it.
On the resistance side, the 1st resistance is at 1.2471 which is a multi-swing high resistance level. If price manages to break through this level, it could potentially rise towards the 2nd resistance at 1.2542. This level is a swing high resistance and also lines up with the 78.6% Fibonacci projection.
USD/CHF:
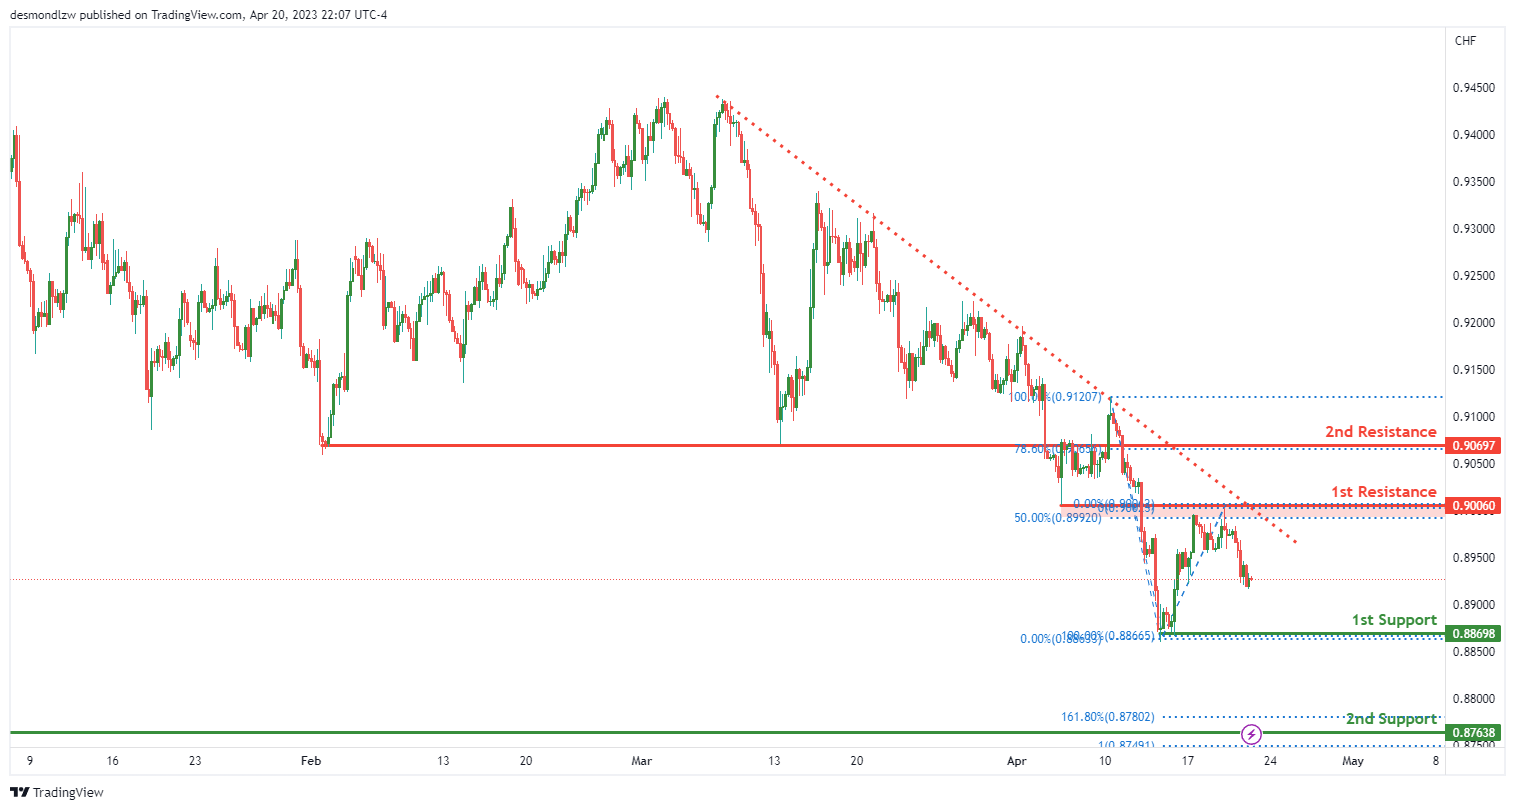
The current price of USD/CHF is below a major descending trend line, which suggests that bearish momentum is likely to continue. Additionally, the price is currently testing a descending trend line that is acting as resistance.
Based on this, it is possible that the price will continue to drop and reach the first support level at 0.8869. This support level is an important multi-swing low support that also lines up with the 23.6% Fibonacci retracement level.
If the price breaks through this support level, the next support level is at 0.8763, which is a significant swing low support and coincides with the 161.8% Fibonacci extension level.
On the other hand, if the price manages to break through the descending trend line resistance, it could potentially rise towards the first resistance level at 0.9006. This level is an overlap resistance and lines up with the 50% Fibonacci retracement level.
If the price manages to break through the first resistance level, the second resistance level is at 0.9069. This level is a pullback resistance and lines up with the 78.6% Fibonacci projection level.
USD/JPY:
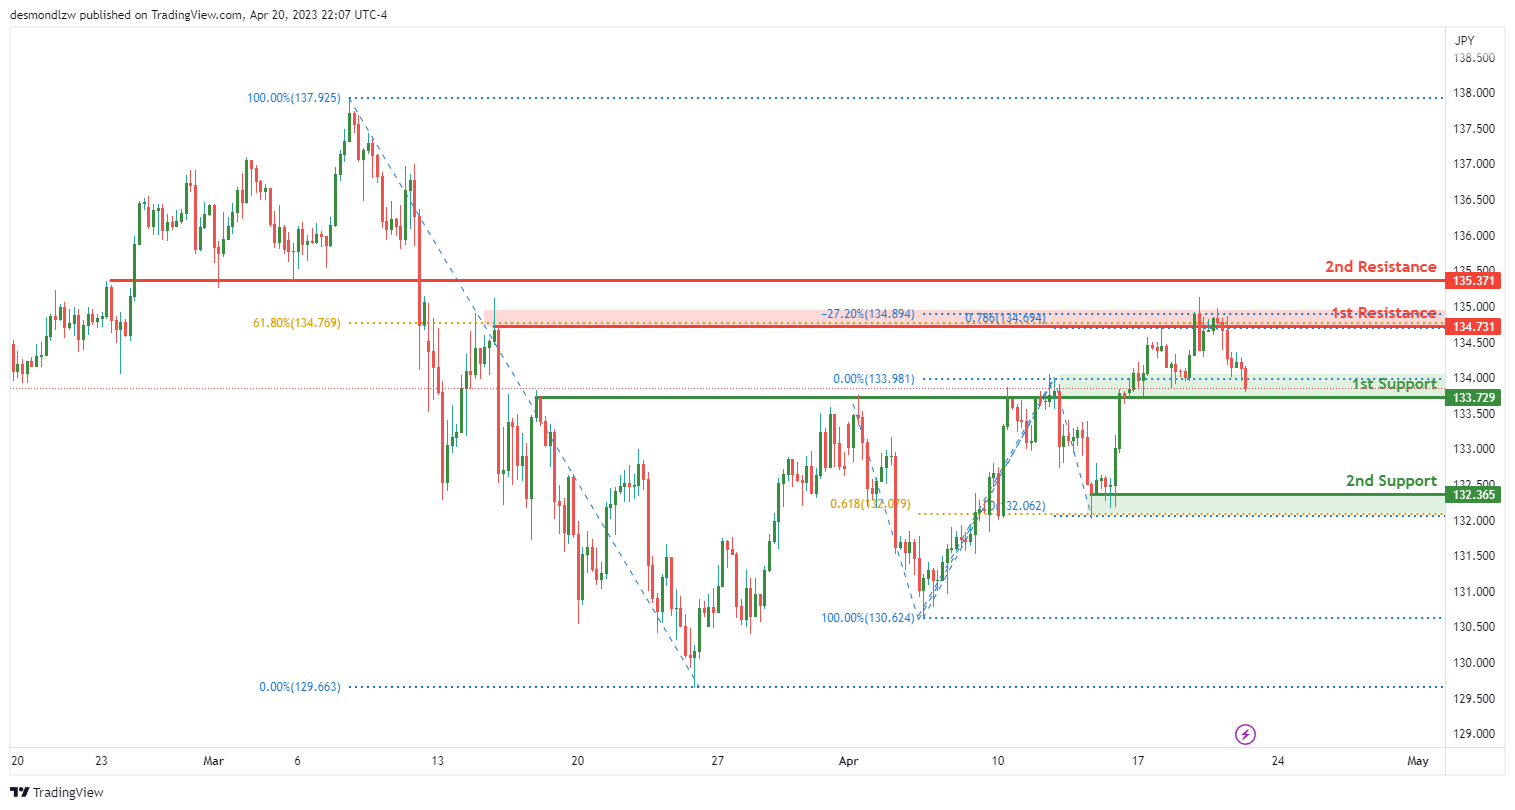
The USD/JPY chart currently shows strong bullish momentum. Prices could potentially bounce off the 1st support level at 133.72 and move towards the 1st resistance level at 134.73.
The 1st support level is an overlap support that coincides with current price, indicating a strong level of buying interest. The 2nd support level is a multi-swing low support that is aligned with the 61.80% Fibonacci projection, further enhancing its importance as a support level.
On the resistance side, the 1st resistance level is a multi-swing high resistance that corresponds with the 61.80% Fibonacci retracement. This resistance level is expected to pose a significant challenge to prices moving upwards. The 2nd resistance level is a pullback resistance that may also act as a hindrance to the bullish momentum.
AUD/USD:
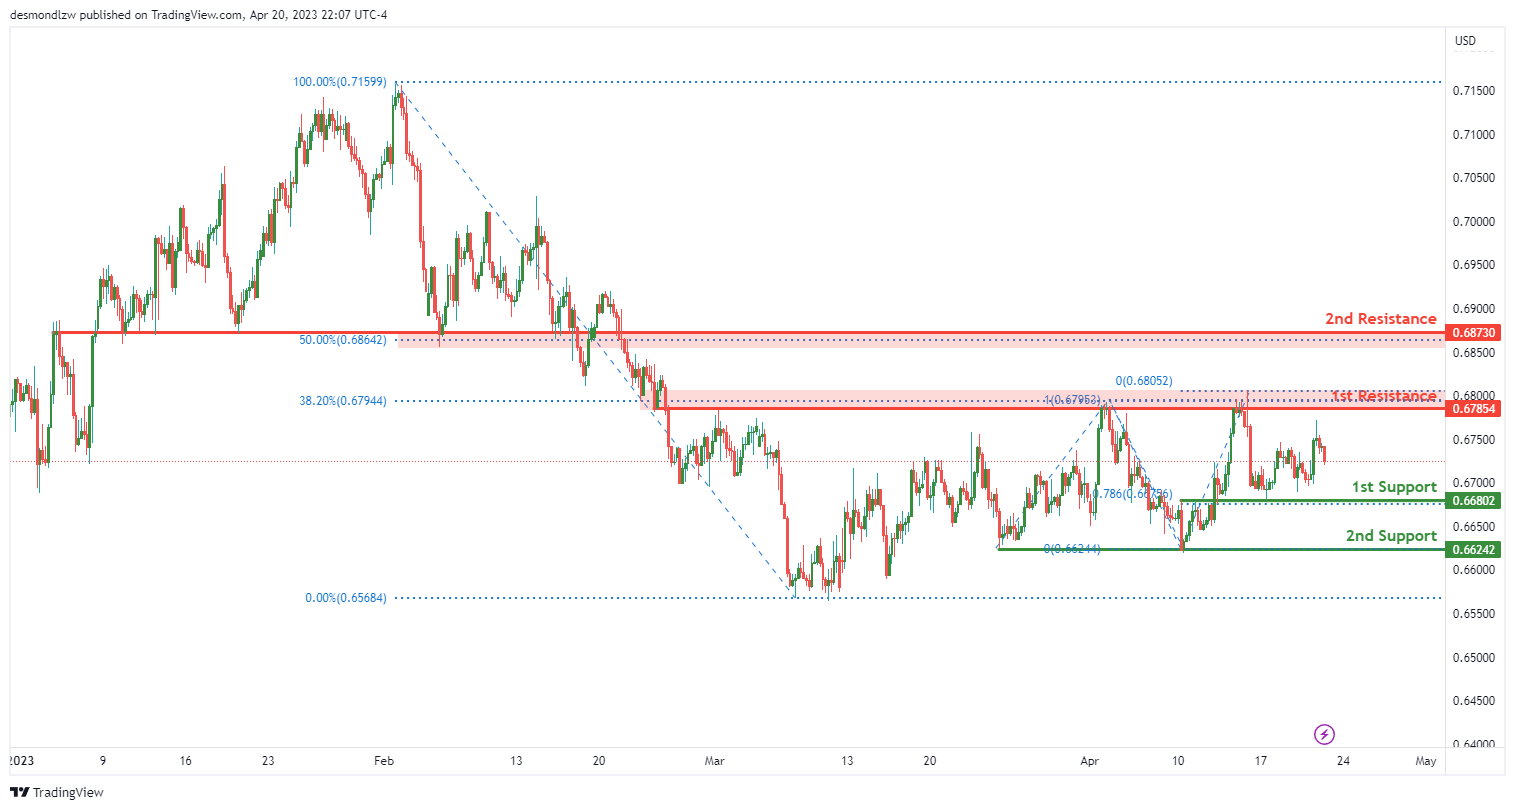
The AUD/USD chart is currently exhibiting strong bearish momentum. Price is below the major descending trend line, which suggests that we may see a continuation of the bearish trend.
There is potential for price to continue its bearish movement towards the 1st support level at 0.6680. This level is a strong overlap support and lines up with the 78.60% Fibonacci projection, making it a good candidate for a potential bounce. If price were to break below this level, the next support level is the 2nd support at 0.6624, which is a multi-swing low support.
On the other hand, if price were to reverse from the 1st support, it could potentially rise to the 1st resistance at 0.6785. This level is a pullback resistance and coincides with the 38.20% Fibonacci retracement. If price were to break above the 1st resistance, the next level to watch out for is the 2nd resistance at 0.6873, which is another pullback resistance and lines up with the 50% Fibonacci retracement.
NZD/USD:
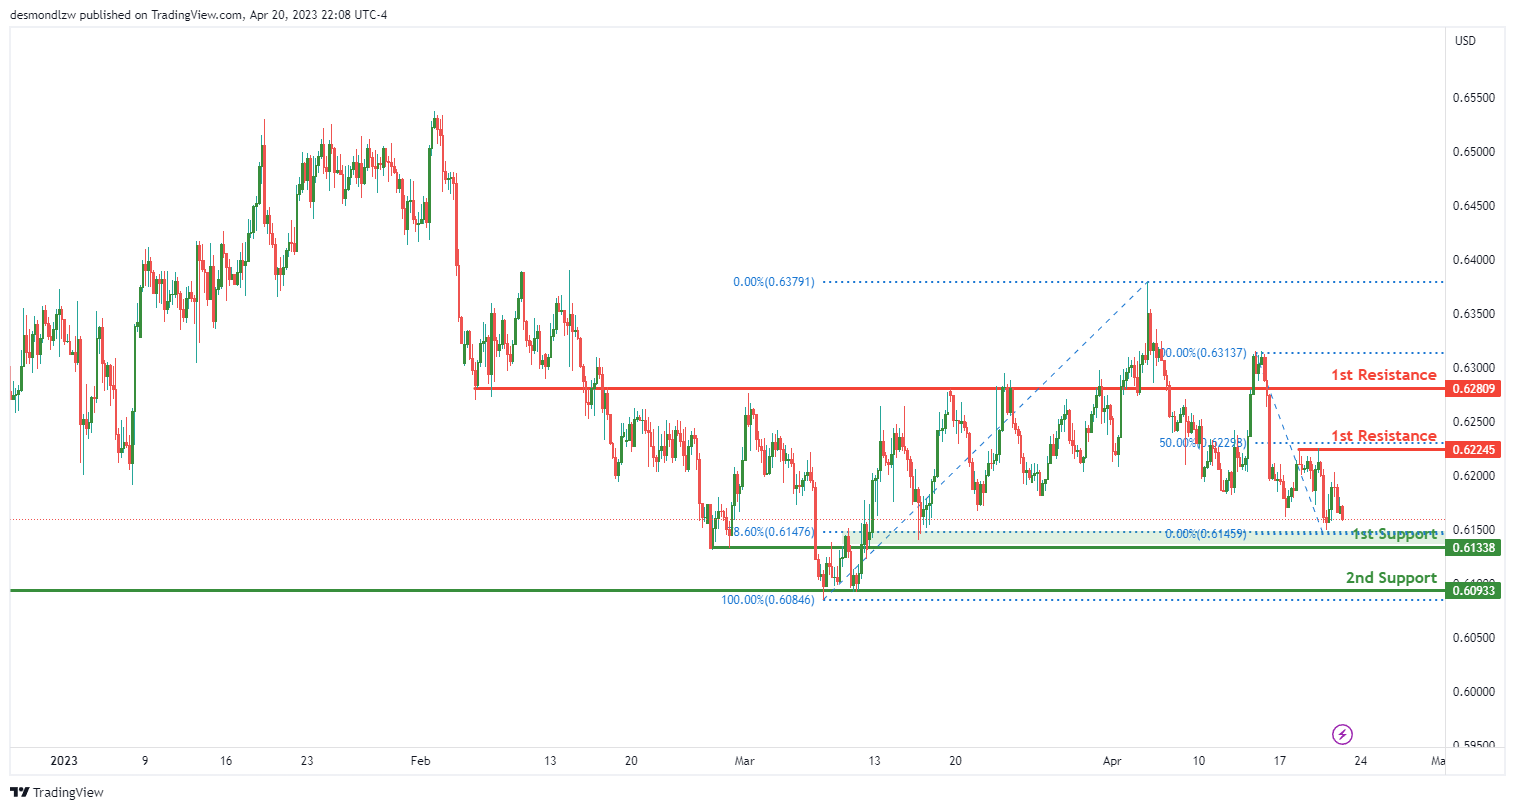
The overall momentum of the NZD/USD chart is bearish, indicating a downward trend. Price could potentially continue to decline towards the 1st support at 0.6133, which is a significant overlap support level and coincides with the 78.60% Fibonacci retracement. A break below this level could push the price further down to the 2nd support at 0.6093, which is also a multi-swing low support.
On the other hand, the 1st resistance at 0.6224 is acting as a pullback resistance and coincides with the 50% Fibonacci retracement. A bullish reversal from this level could push the price up towards the 2nd resistance at 0.6280, which is a significant overlap resistance level.
It’s important to note that the bearish momentum is currently strong, suggesting that the probability of a bearish continuation is high.
USD/CAD:
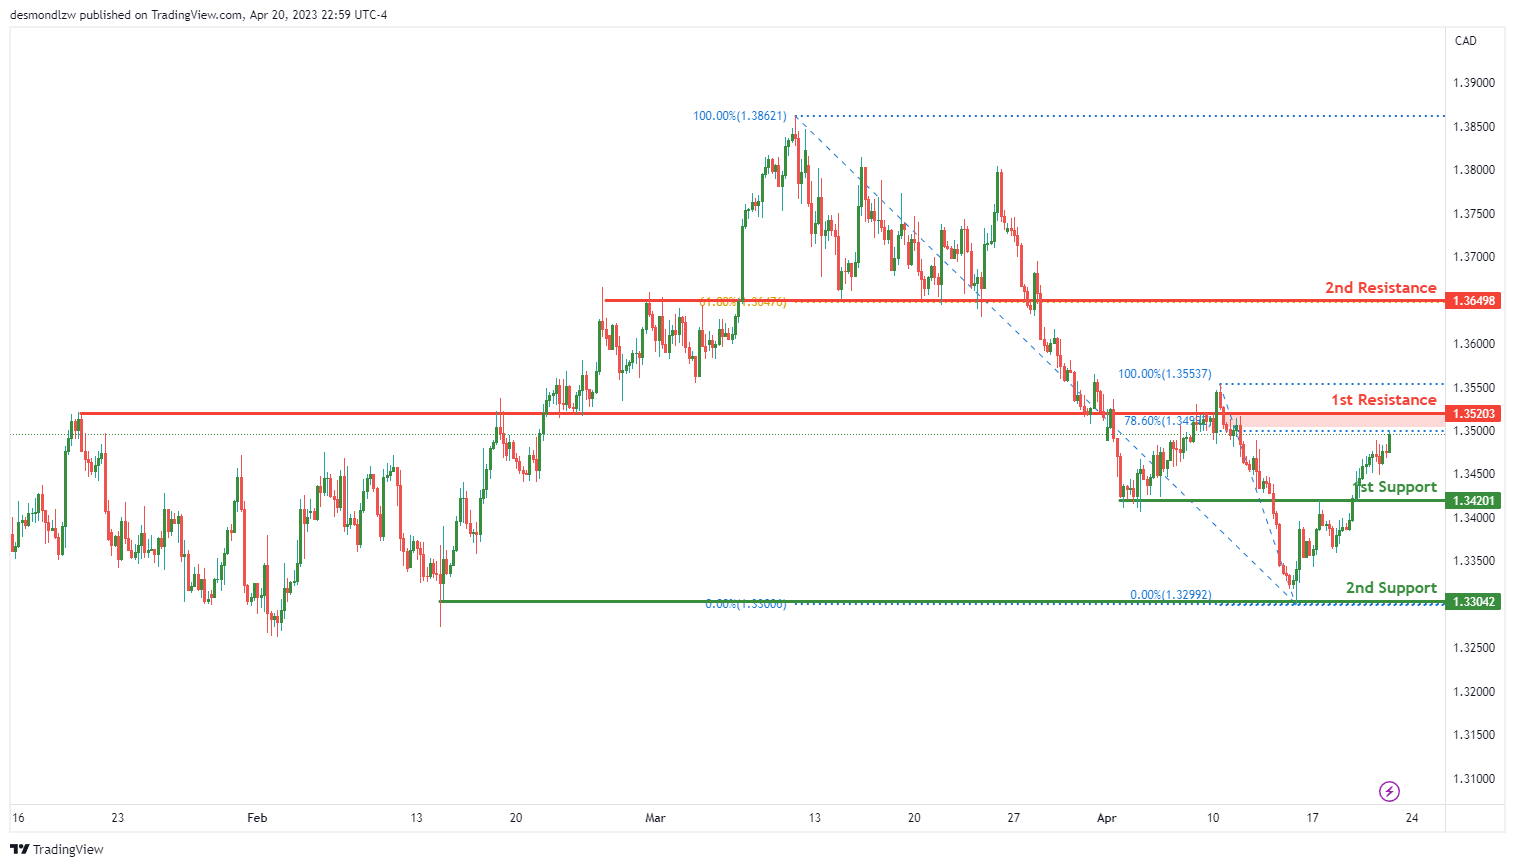
The USD/CAD currency pair is exhibiting strong bearish momentum on its chart, indicating a potential bearish continuation in the near future. The price is expected to react bearishly to the 1st resistance and drop towards the 1st support level.
The 1st support level is situated at 1.3420, which is a crucial pullback support level and coincides with the 78.60% Fibonacci retracement level. The 2nd support level is located at 1.3304, which is a multi-swing low support level.
On the upside, the 1st resistance level is seen at 1.3520, which is an important overlap resistance level and coincides with the 78.60% Fibonacci retracement level. The 2nd resistance level is positioned at 1.3649, which is a pullback resistance level and coincides with the 61.80% Fibonacci retracement level.
DJ30:
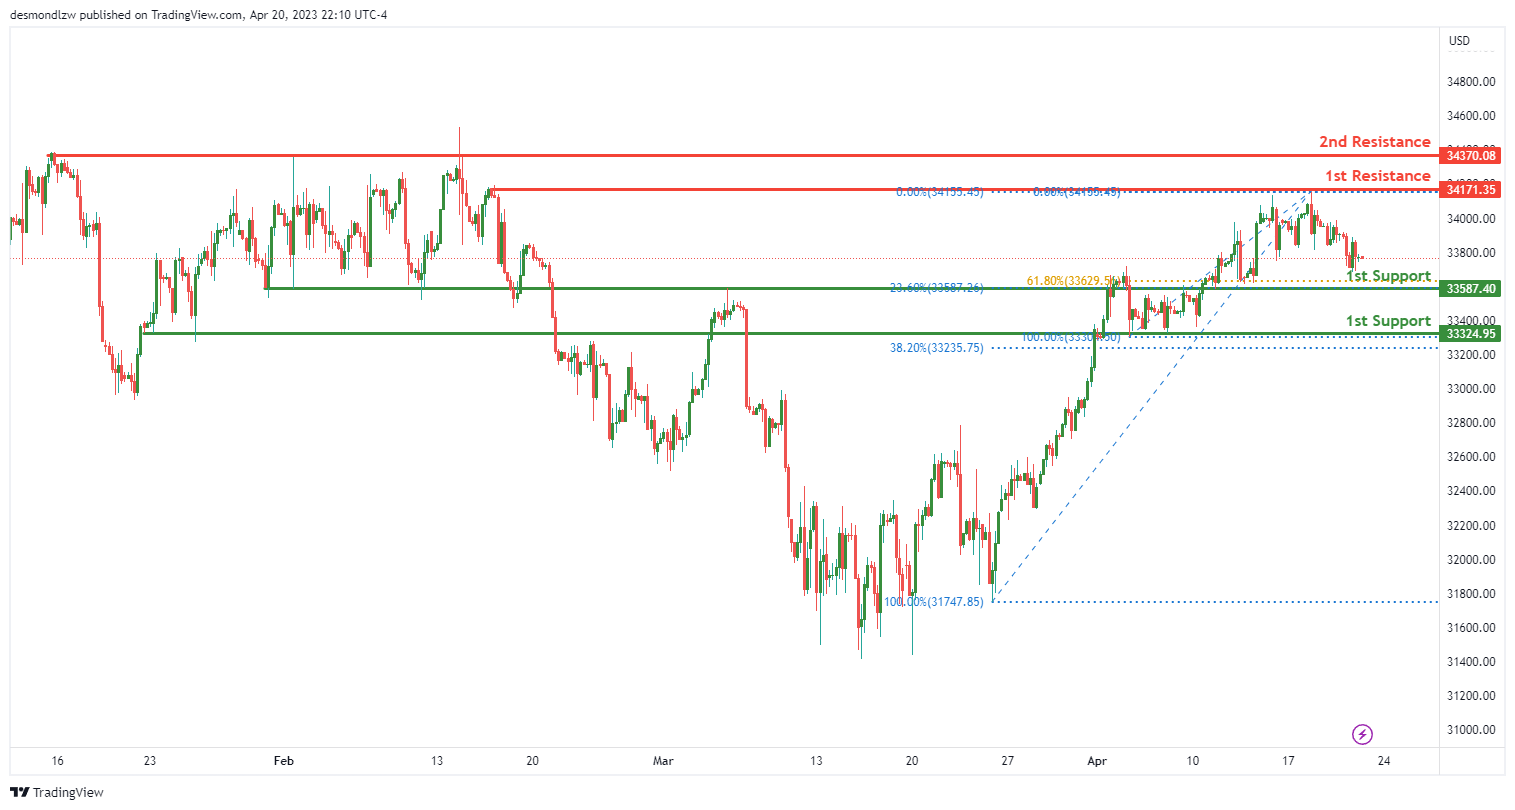
The Dow Jones Industrial Average (DJ30) is showing bullish momentum on the chart, with potential for a bullish bounce off the first support level and a move towards the first resistance level.
The first support level is at 33587.40, which is an overlap support level and the 61.80% Fibonacci retracement level. This level has previously acted as a support, which increases its significance. The second support level at 33324.95 is also an overlap support level and the 38.20% Fibonacci retracement level. A bounce off either of these levels could potentially signal a bullish move.
On the upside, the first resistance level is at 34171.35, which is a multi-swing high resistance level. A break above this level could potentially indicate further bullish momentum. The second resistance level at 34370.08 is also a multi-swing high resistance level, which increases its significance.
GER30:
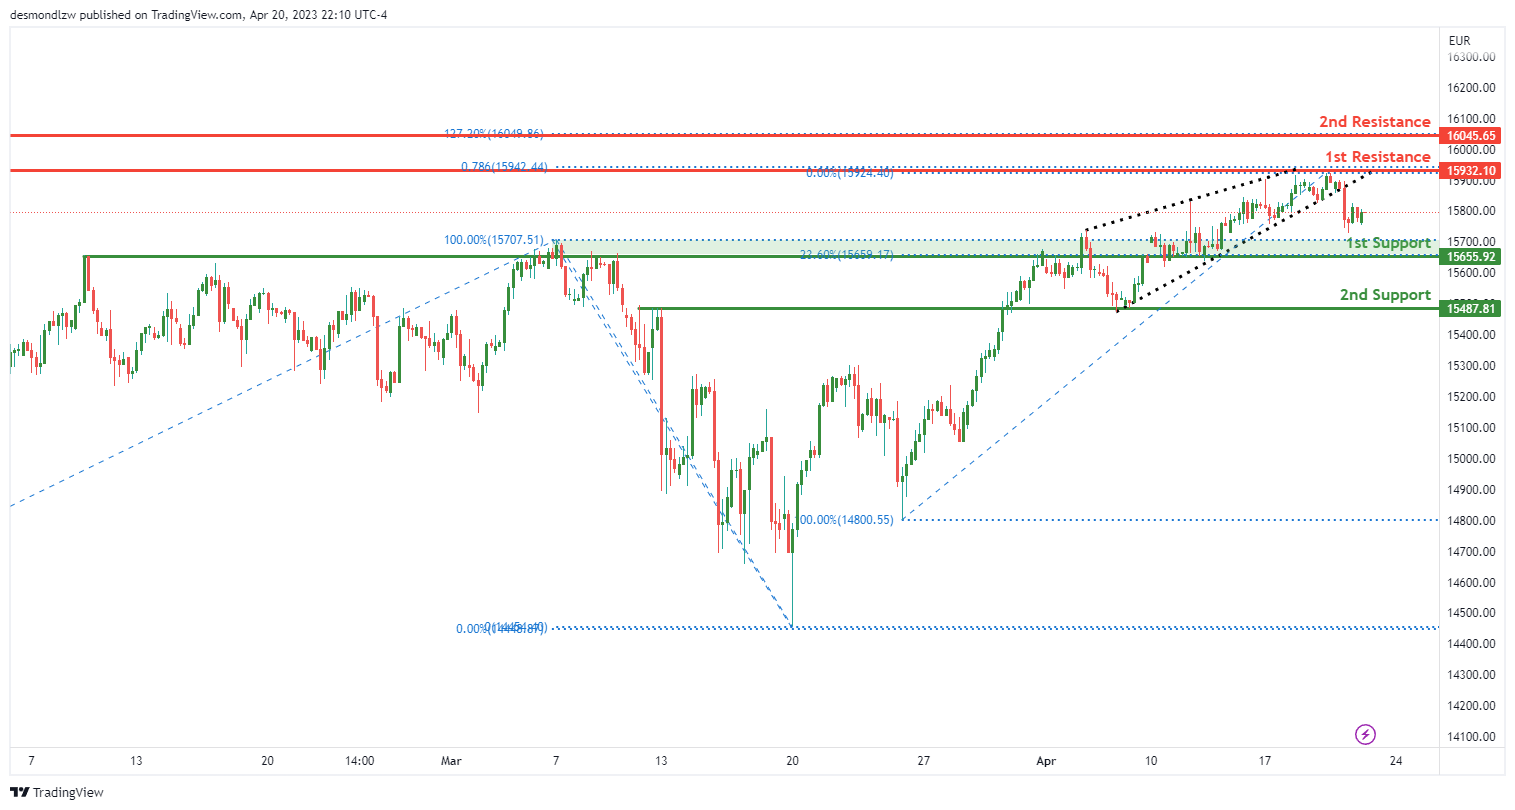
The German DAX (GER30) has been exhibiting bearish momentum on the chart, with a rising wedge pattern that suggests a possible imminent breakout to the downside. With this overall sentiment, the price is expected to continue its bearish trend towards the next support level.
The first support level that the price could potentially reach is at 15655.92, which is an overlap support and also coincides with the 23.60% Fibonacci retracement level. If the price breaks through this level, the next support level to watch out for is at 15487.81, which is another overlap support.
On the other hand, the first resistance level that could potentially hinder the price from going further down is at 15932.10, which is a swing high resistance and coincides with the 78.60% Fibonacci projection level. If the price manages to break through this level, the next resistance level to watch out for is at 16045.65, which is another swing high resistance and coincides with the 127.20% Fibonacci extension level.
BTC/USD:
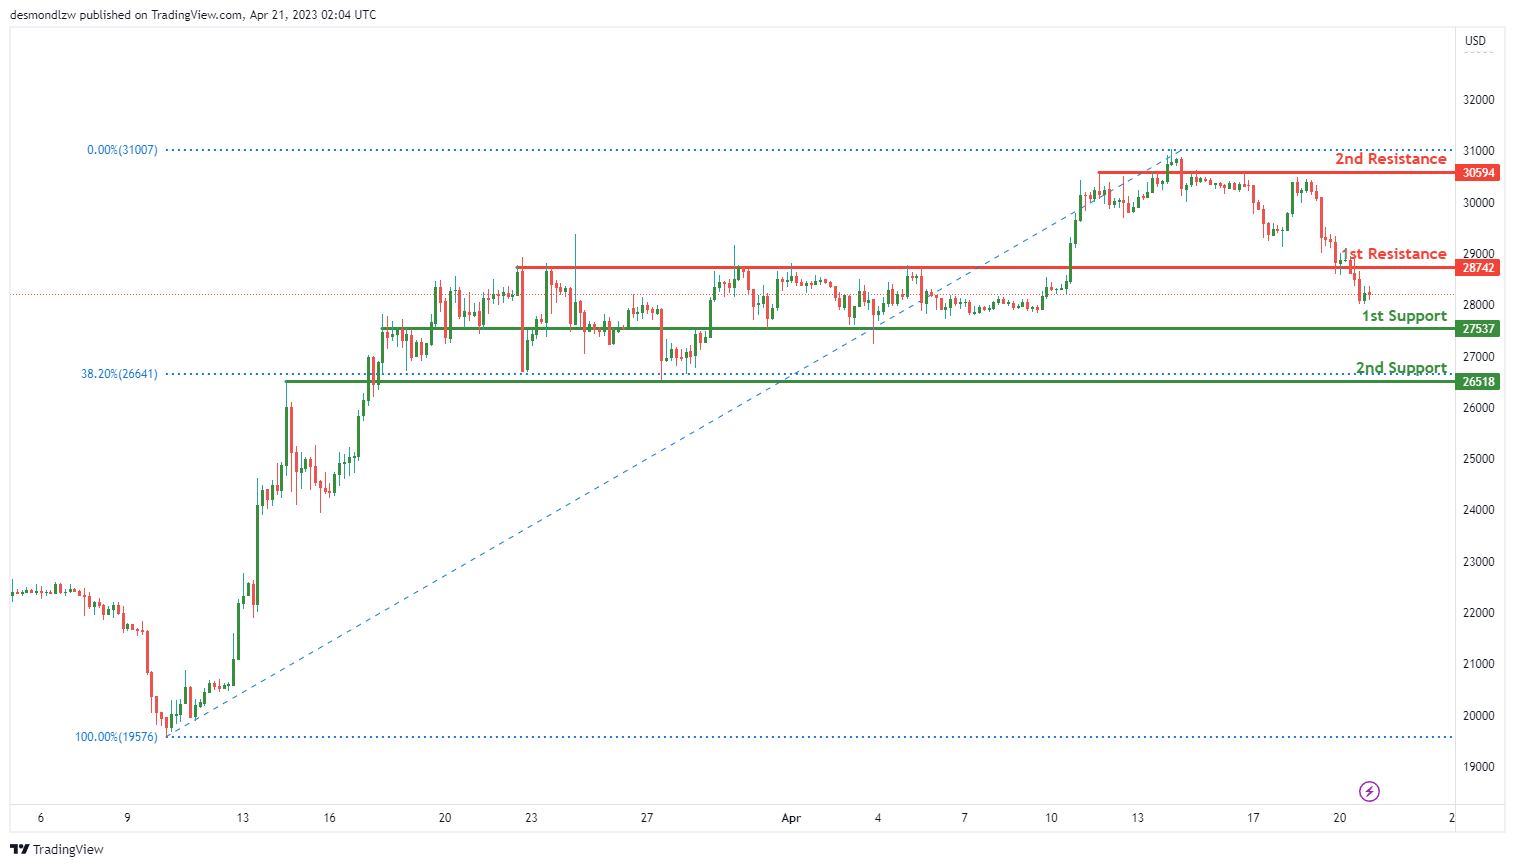
The Bitcoin/USD pair is currently showing bearish momentum, with a potential continuation towards the 1st support level at 27537.
The first support level is a pullback support level, while the second support level at 26518 is an overlap support level, which also corresponds to the 38.20% Fibonacci retracement level. These levels are expected to act as support, as prices continue to move downwards.
On the other hand, the first resistance level at 28742 is a pullback resistance level, while the second resistance level at 30594 is an overlap resistance level. These resistance levels are expected to offer significant resistance to prices as they move upwards.
US500
US500 Bearish Momentum: Possible Breakdown of Key Support Levels
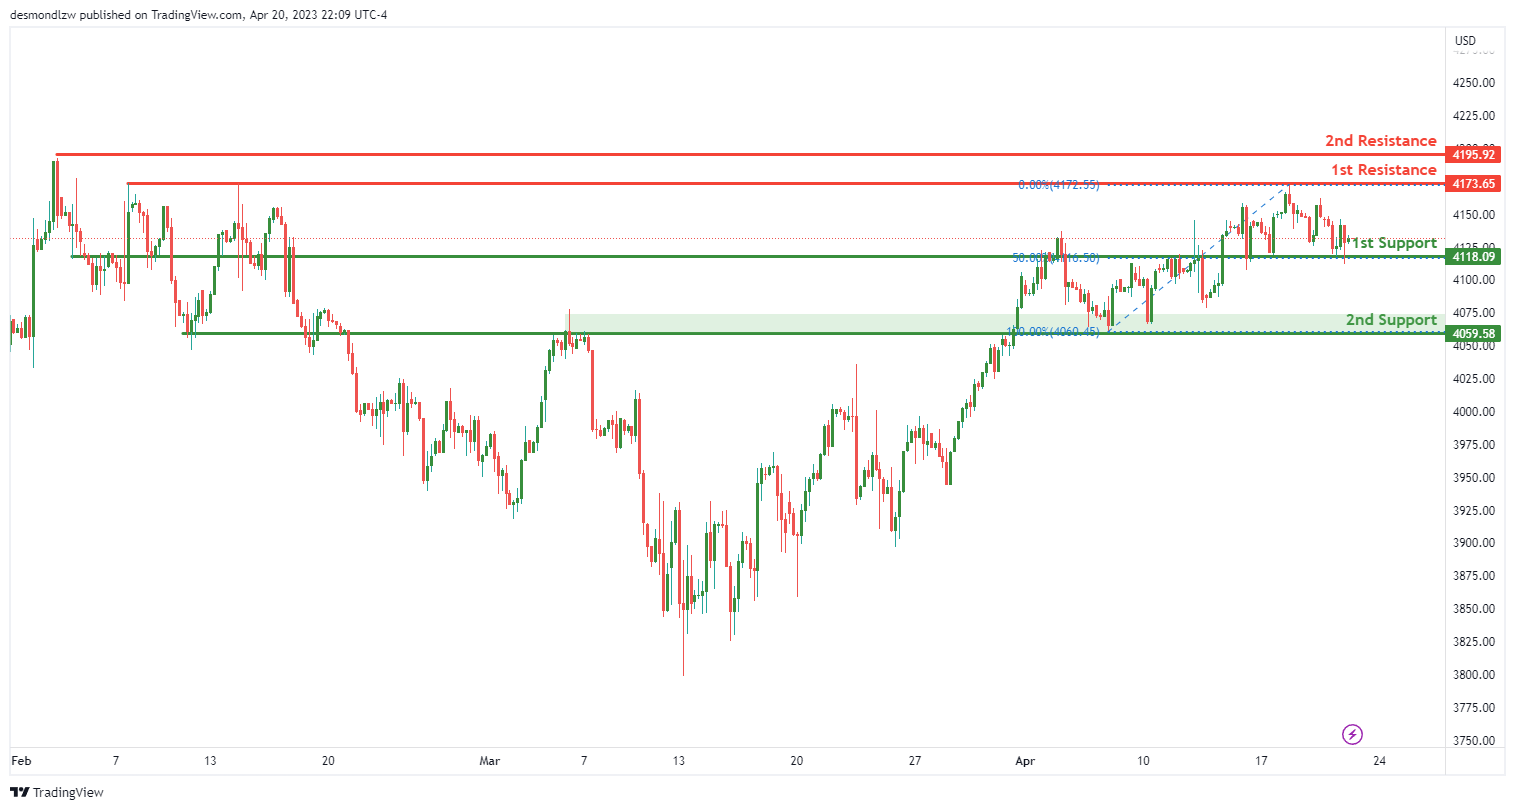
The US500 index has been displaying bearish momentum as it struggles to maintain its position above key support levels. With the price potentially breaking below the 1st support level at 4118.09, traders may anticipate a drop towards the 2nd support level at 4059.58.
Overall, the momentum of the US500 chart is bearish, with prices struggling to maintain support levels. The 1st support level is an overlap support, with a 50% Fibonacci retracement. On the other hand, the 2nd support level is also an overlap support, providing further evidence of a strong support zone.
In terms of resistance, the 1st resistance level is currently at 4173.65, indicating a multi-swing high resistance level. The 2nd resistance level at 4195.92 acts as a swing high resistance, further confirming the bearish momentum of the chart.
If the bearish momentum continues, traders may anticipate a breakdown of key support levels, leading to a potential drop towards the next level of support. Alternatively, if the index manages to maintain its position above support levels and breaks through the resistance levels, a bullish trend may emerge.
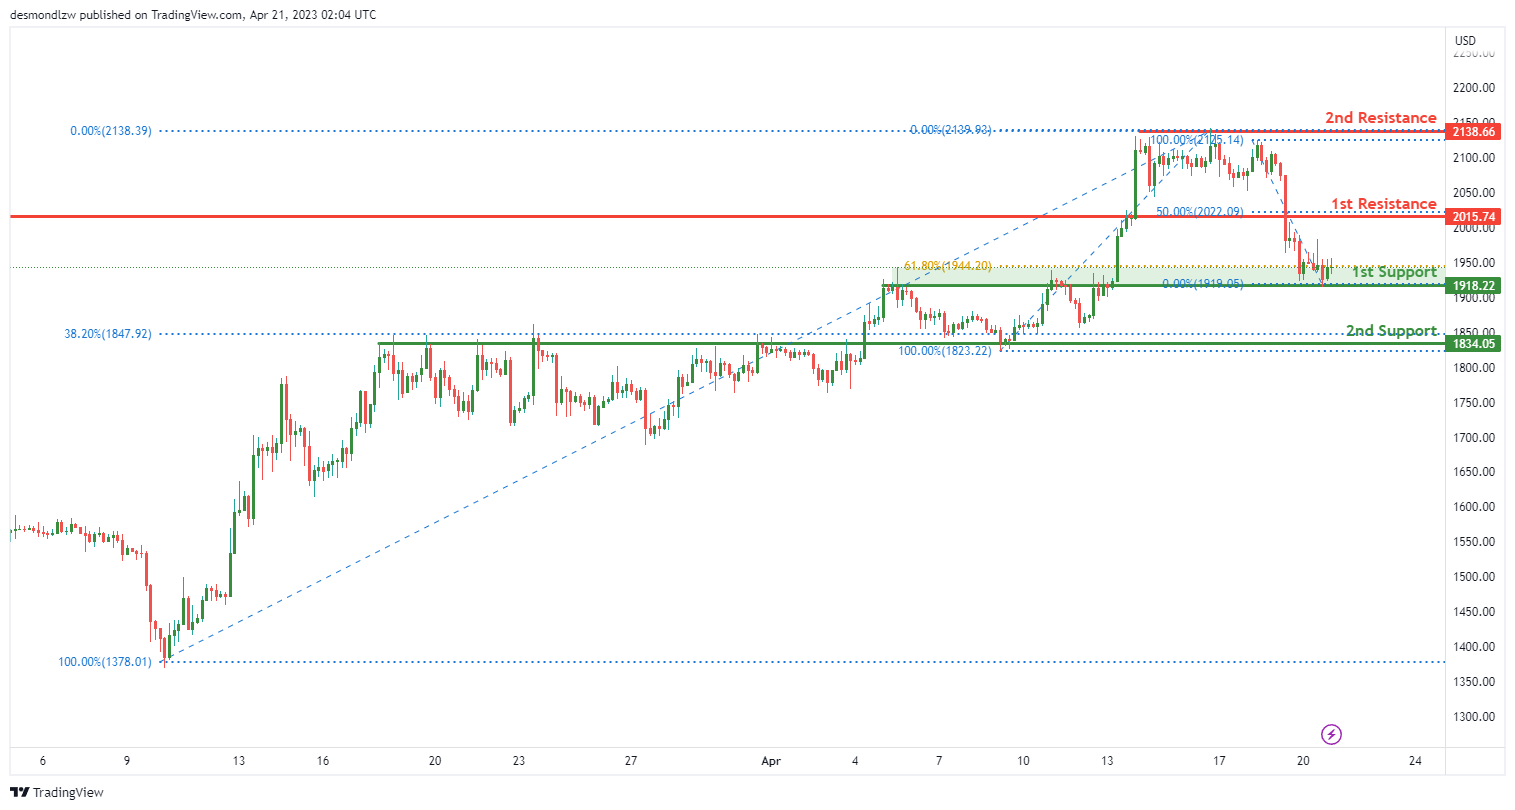
ETH/USD:
The overall momentum of the ETH/USD chart is bullish. The price could potentially continue to rise towards the first resistance level.
The first support level is at 1918.22, which is an overlap support and a 61.80% Fibonacci retracement level. The second support level is at 1834.05, which is also an overlap support and a 38.20% Fibonacci retracement level.
The first resistance level is at 2015.74, which is a pullback resistance and a 50% Fibonacci retracement level. The second resistance level is at 2138.66, which is a multi-swing high resistance.
Overall, if the bullish momentum continues, we could see the price of ETH/USD rise towards the first resistance level at 2015.74. However, if there is a bearish reversal, the price could potentially drop towards the first support level at 1918.22.
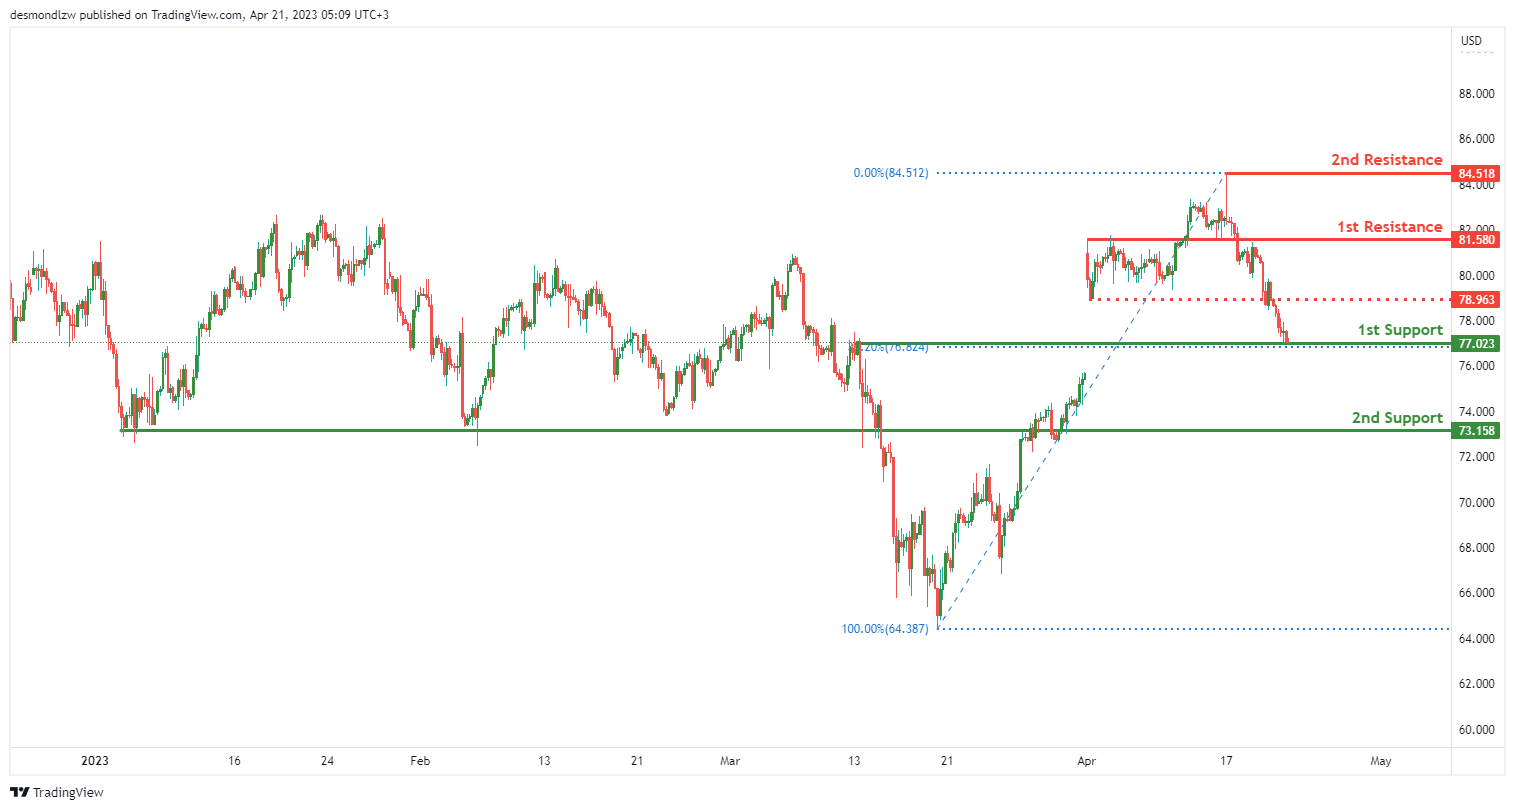
WTI/USD:
The overall momentum of WTI is bullish. The price is expected to potentially make a bullish bounce off the first support level and head towards the first resistance level.
The first support level is at 77.02, and it is a swing low support. It is also situated at the 38.20% Fibonacci retracement level, which makes it a significant level to watch. The second support level is at 73.15, and it is a pullback support level.
On the resistance side, the first resistance level is at 81.58, and it is an overlap resistance level. It is expected to be a significant level of resistance that could potentially stop the bullish momentum of the price. The second resistance level is at 84.51, and it is a swing high resistance level.
In addition to the above levels, there is also an intermediate resistance level at 78.96, which is a pullback resistance level. This level may act as a minor resistance level that the price may encounter before reaching the first resistance level.
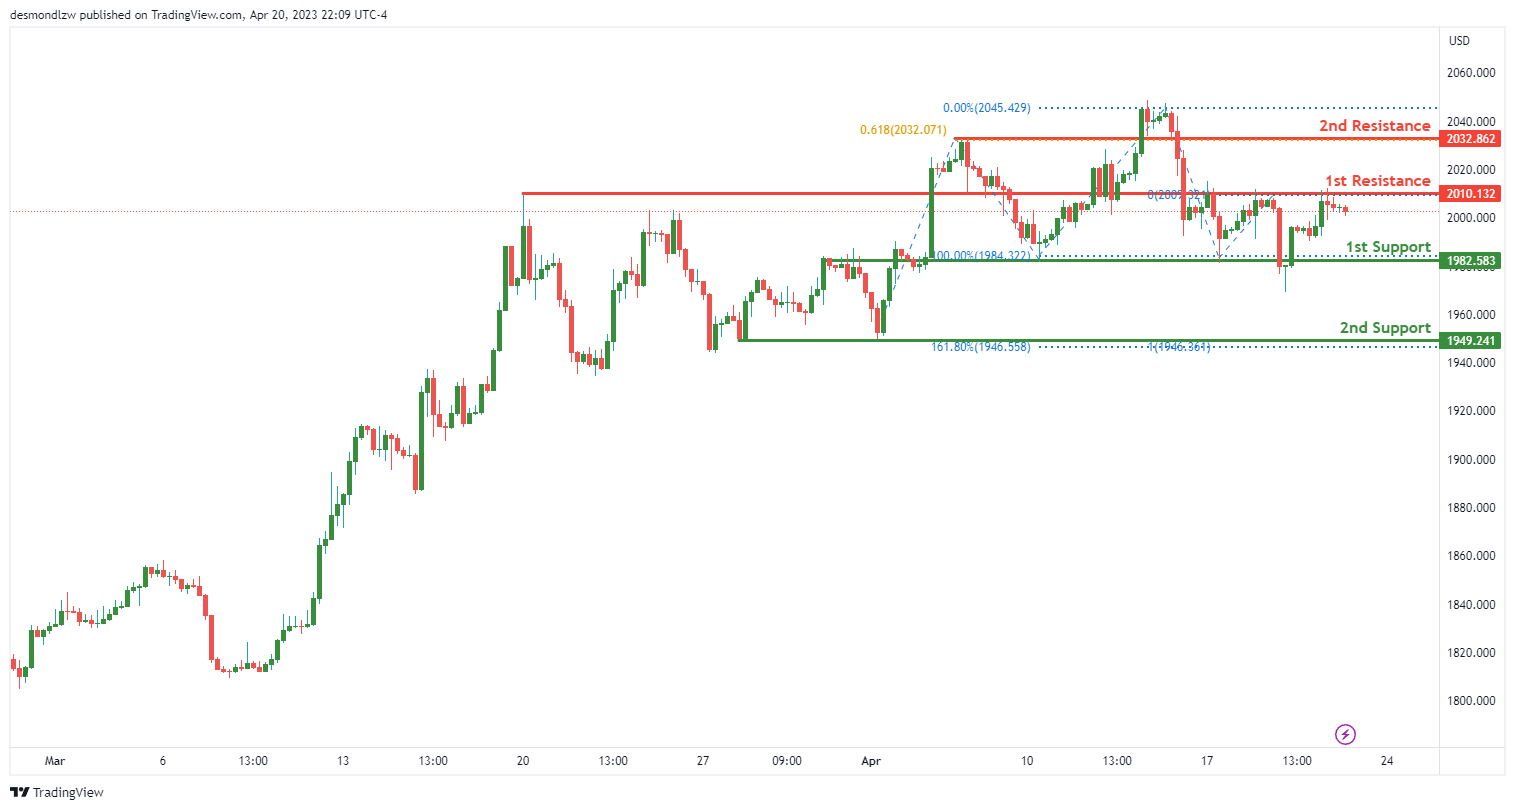
XAU/USD (GOLD):
Gold prices are currently experiencing a bearish momentum on the chart. The price could potentially continue its downward movement towards the first support level at 1982.58, which is an overlap support level. If the price breaks below this support level, the next level of support will be the 2nd support at 1949.24, which is a multi-swing low support level and also aligns with the 161.80% Fibonacci Extension level.
On the other hand, the first resistance level is located at 2010.13, which is also an overlap resistance level. If the price manages to break above this resistance level, it could rise towards the second resistance level at 2032.86. This resistance level coincides with a pullback resistance level and the 61.80% Fibonacci projection.


