
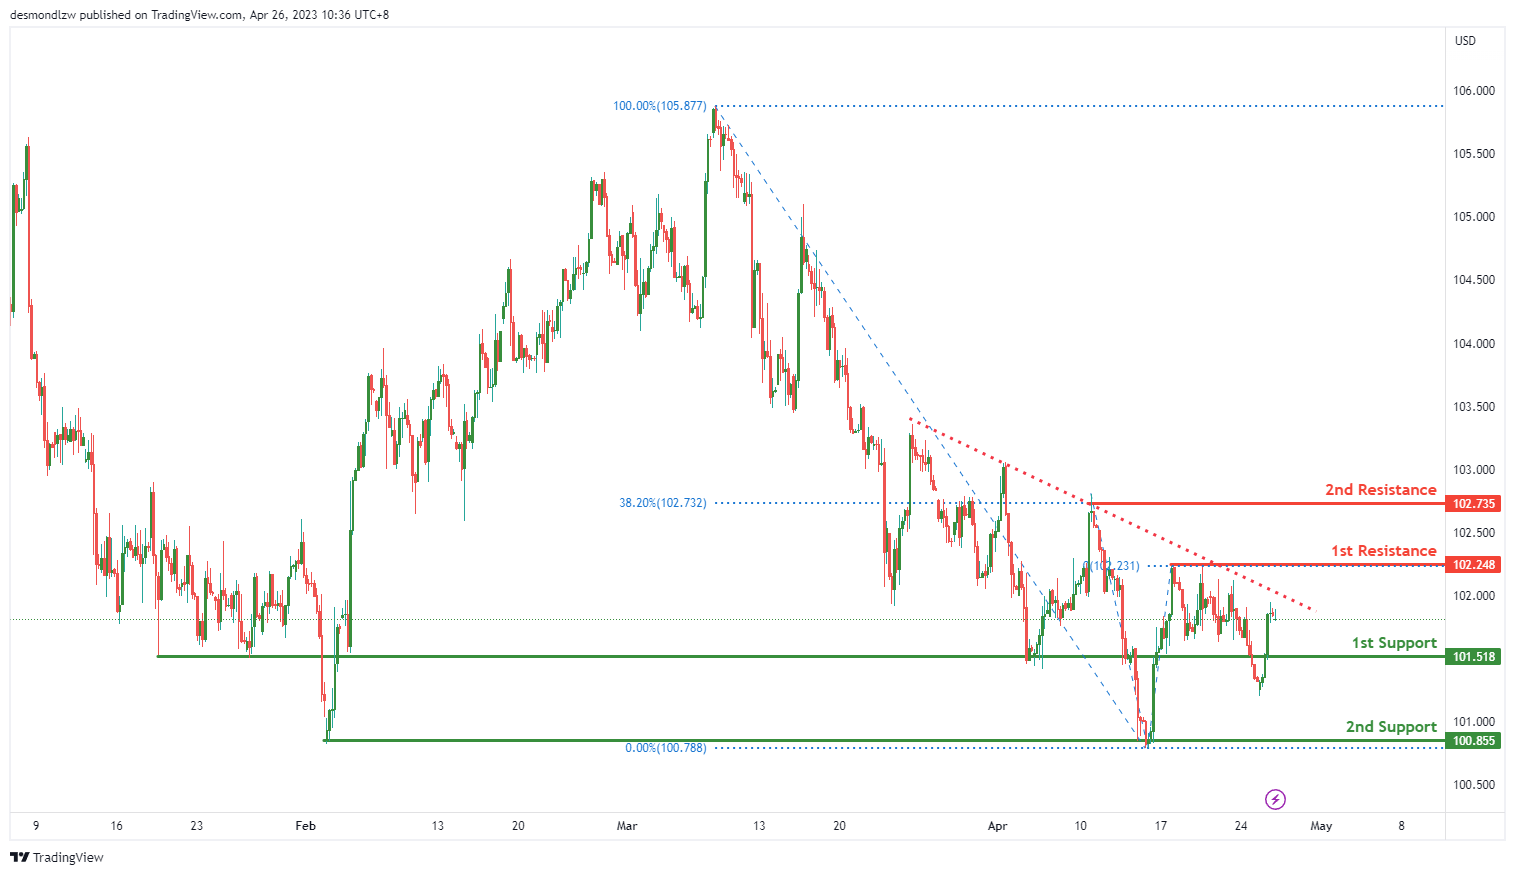
DXY:
The US Dollar Index (DXY) is currently showing bullish momentum, as it could potentially continue to move towards its first resistance level.
At the moment, the first support level for DXY is at 101.52, which is an overlap support. If the price drops further, it could potentially find support at 100.86, which is another overlap support.
However, the overall momentum of the chart remains bullish, so it’s more likely that the price will continue to rise towards the first resistance level of 102.25, which is also an overlap resistance. If it manages to break through this level, it could reach the second resistance level of 102.74, which is an overlap resistance and also coincides with the 38.20% Fibonacci retracement level.
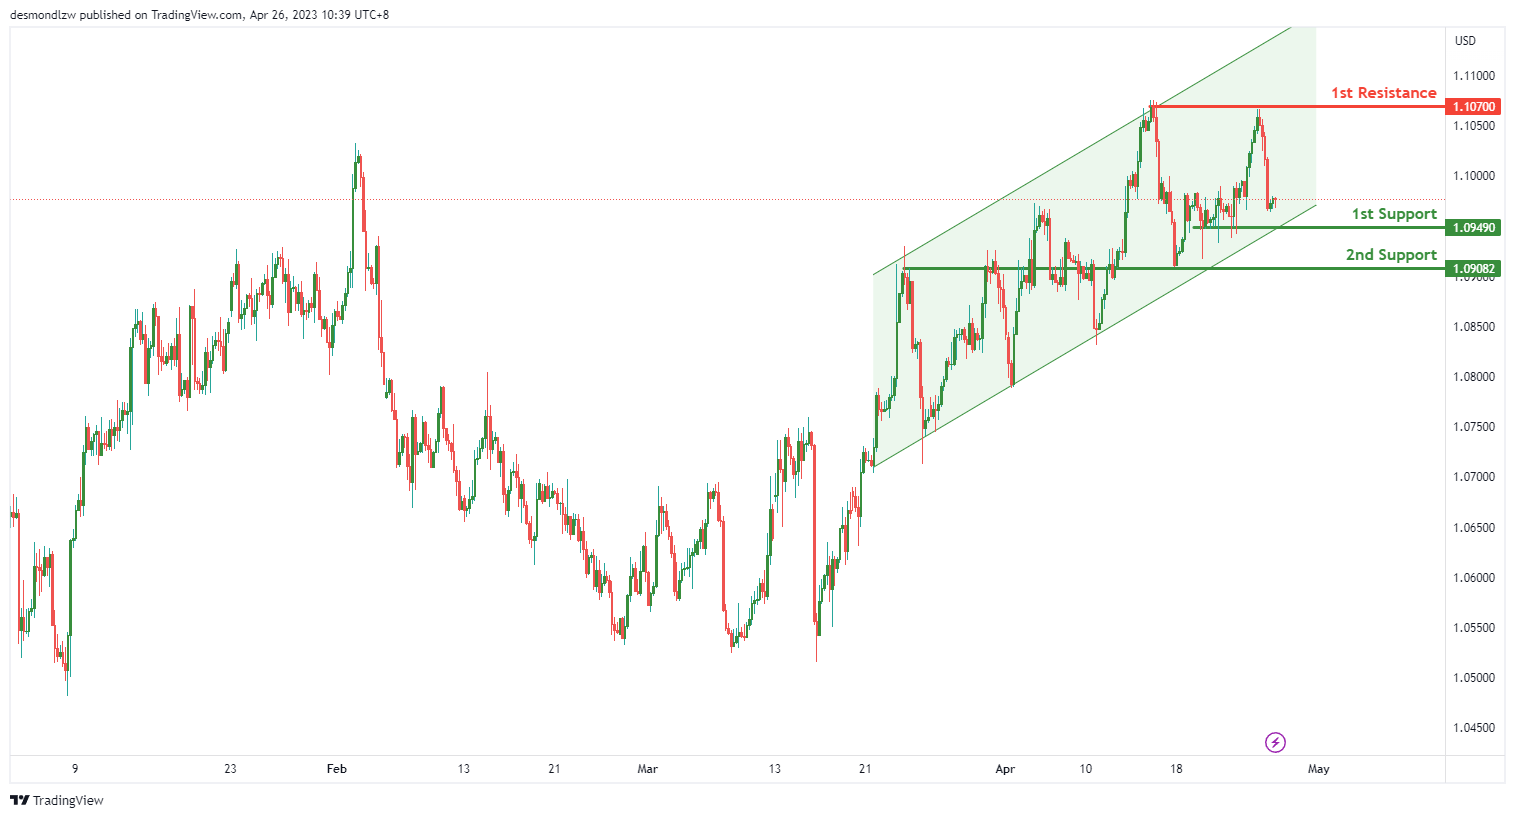
EUR/USD:
The EUR/USD chart shows weak momentum with a bearish bias. Prices could potentially make a bearish continuation towards the first support level. On the upside, prices could face resistance near the swing high resistance level.
Looking at the support and resistance levels, we can see that the first support level is at 1.0949. This level is an overlap support, indicating that it has been an important price level in the past. The second support level is at 1.0908, which is also an overlap support level, and it coincides with the 50% Fibonacci retracement level.
On the other hand, the first resistance level is at 1.1070, which is a multi-swing high resistance level.
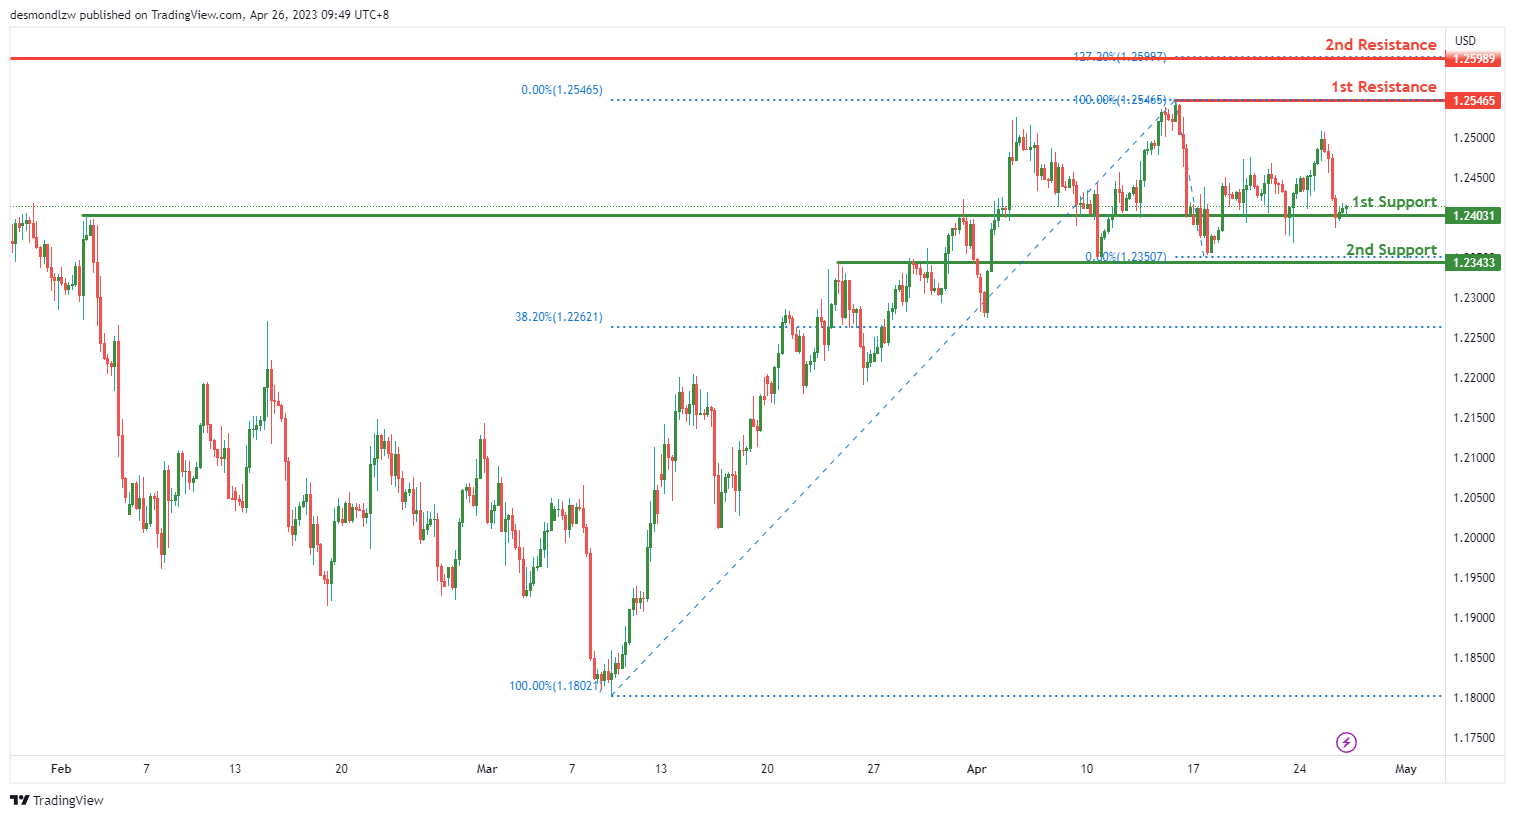
GBP/USD:
The GBP/USD pair has been showing weak momentum with low confidence overall. However, there is a possibility for a bullish bounce off the first support level and head towards the first resistance level.
The first support level is at 1.2403, which is an overlap support level. If the price reaches this level, there is a chance that it could bounce off this level and head towards the first resistance level.
The second support level is at 1.2343, which is also an overlap support level. This level may act as a stronger support level if the price falls further.
On the upside, the first resistance level is at 1.2547, which is a swing high resistance level. If the price manages to break above this level, it could potentially continue to rise.
The second resistance level is at 1.2599, which is an overlap resistance level. This level may act as a stronger resistance level if the price manages to break above the first resistance level.
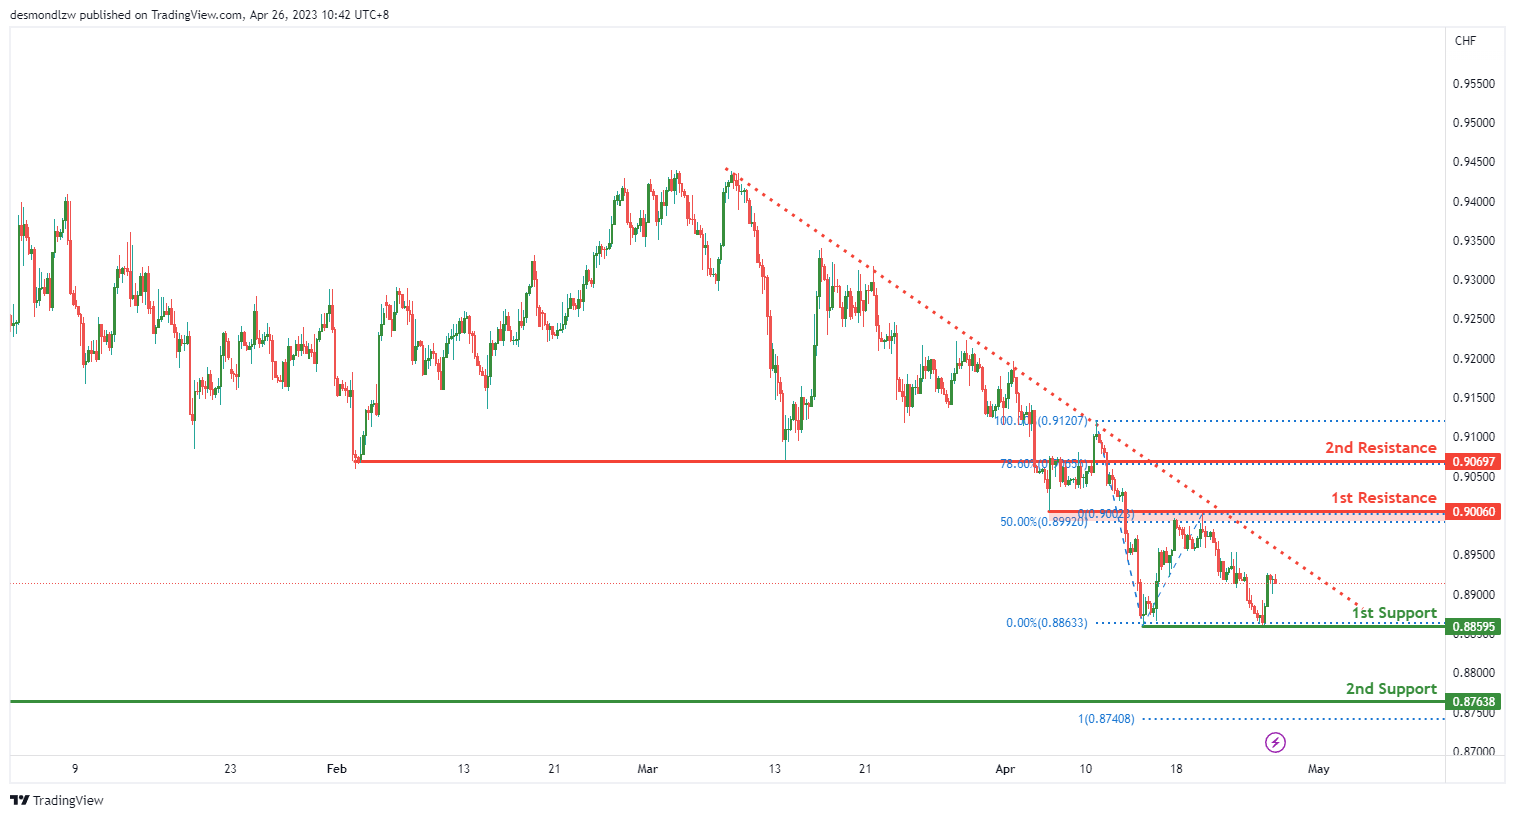
USD/CHF:
The USD/CHF currency pair is currently showing neutral momentum on the charts, with the potential to fluctuate between the 1st resistance and 1st support levels.
The 1st support level is at 0.8860 and is considered a multi-swing low support, while the 2nd support level is at 0.8764 and is an overlap support.
On the other hand, the 1st resistance level is at 0.9006 and is an overlap resistance, with the 50% Fibonacci retracement adding to its significance.
The 2nd resistance level is at 0.9070 and is an overlap resistance, with the 78.60% Fibonacci retracement providing additional support.
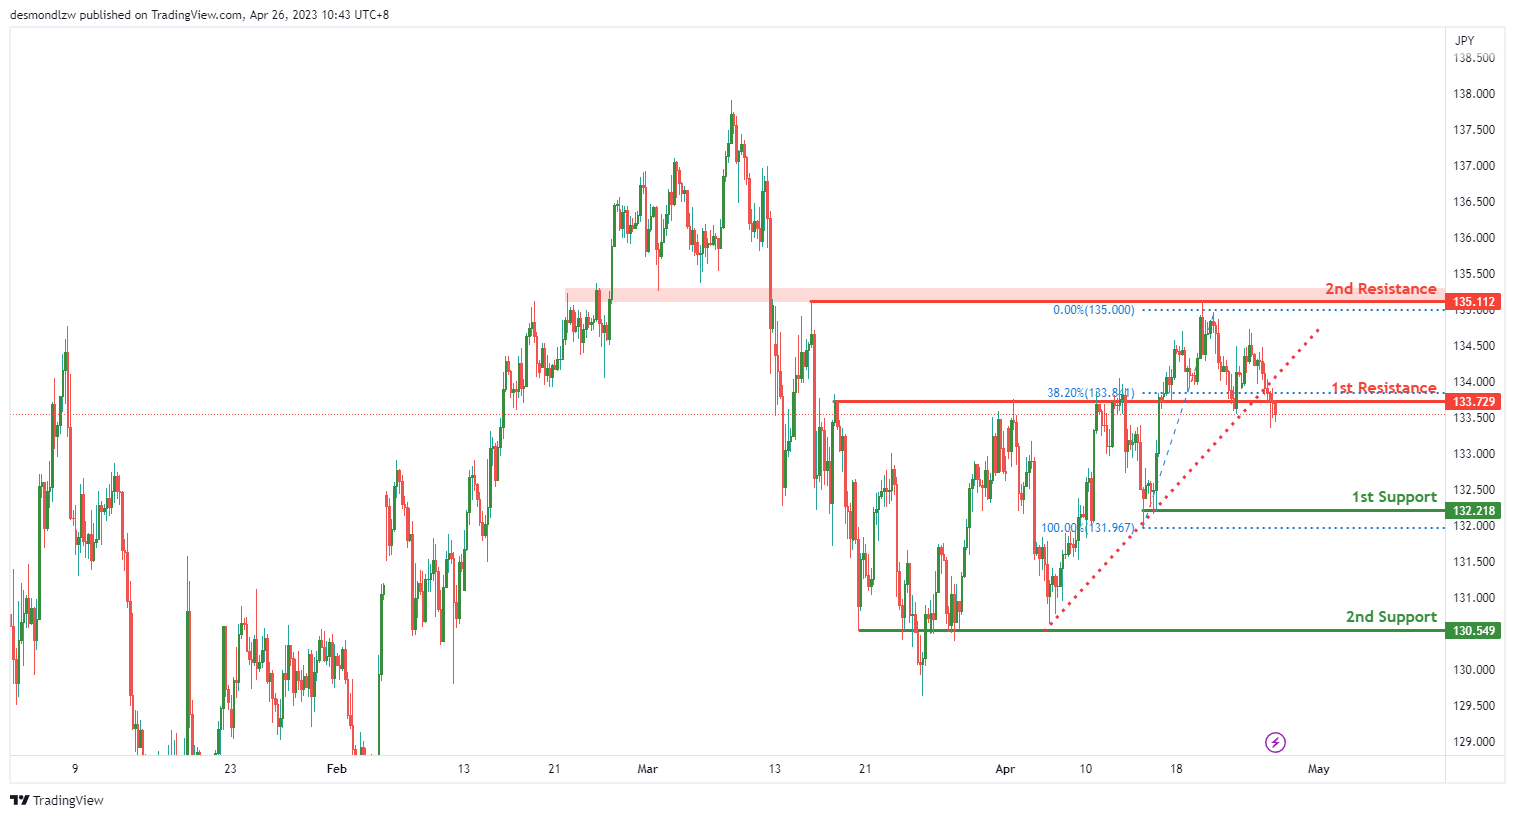
USD/JPY:
After breaking out of the rising trendline and prior 1st support of 133.73, USD/JPY could continue its bearish momentum towards the new 1st support level at 132.22. The level is considered a strong support as it has been tested multiple times in the past.
If the price breaks below this level, the next potential support could be at 130.55, which is a key support level based on the 61.80% Fibonacci retracement.
On the upside, the first resistance is at 133.73, which is an overlap resistance level. If the price manages to break above this level, it could potentially head towards the next resistance at 135.11, which is also an overlap resistance level.
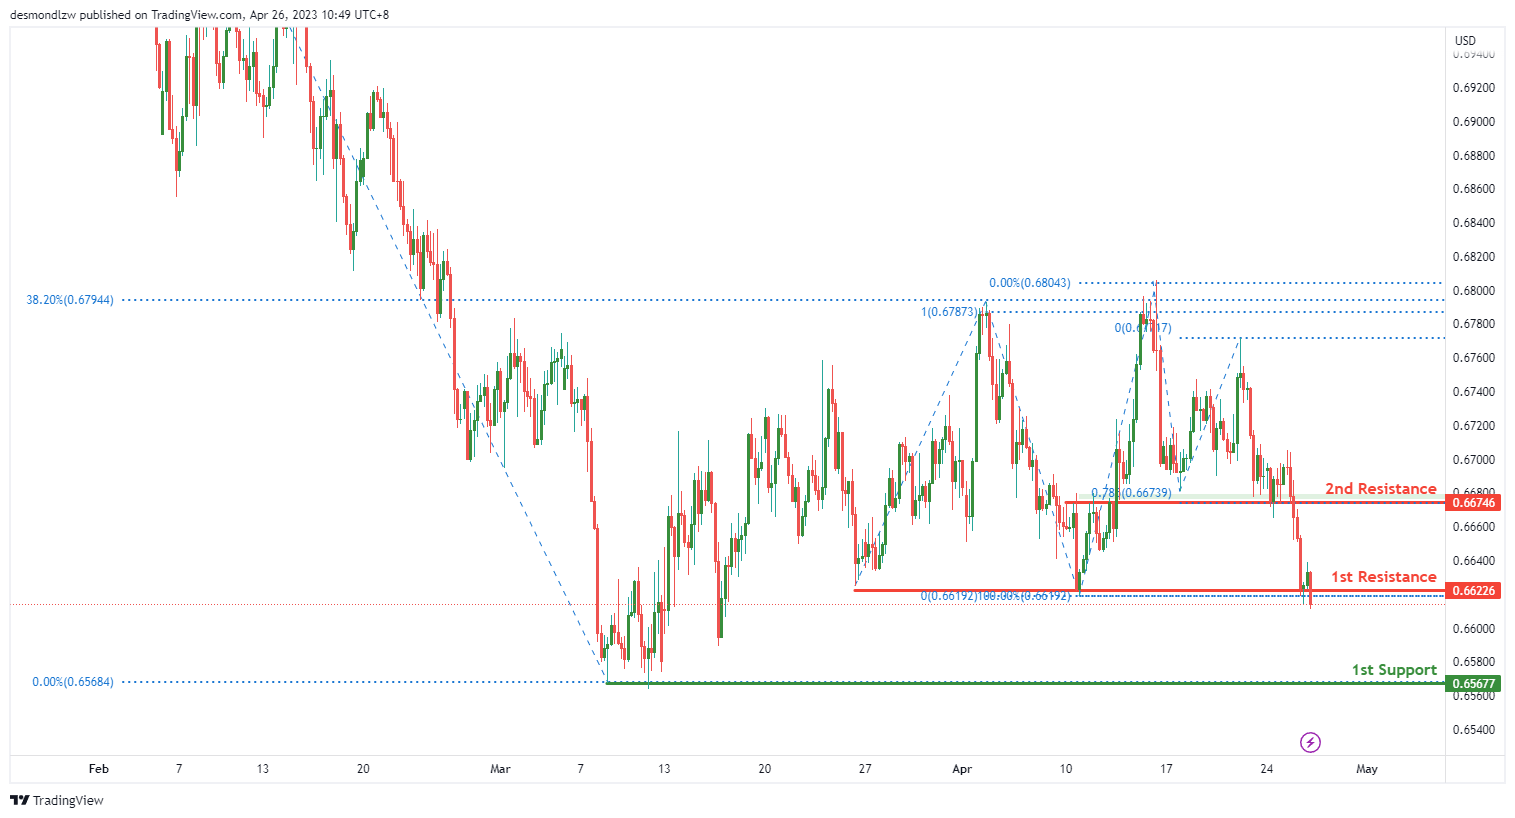
AUD/USD:
The AUD/USD pair is currently showing strong bearish momentum as it broke through the prior first support of 0.6623. It could reach the new first support level at 0.6568, which is another multi-swing low support level.
If the price bounces from this new support level, it could head towards the first resistance level at 0.6623. The previous first support level at 0.6623 now acts as the new first resistance, which is an overlap resistance. This second resistance level is an overlap resistance and also corresponds to the 78.60% Fibonacci projection.
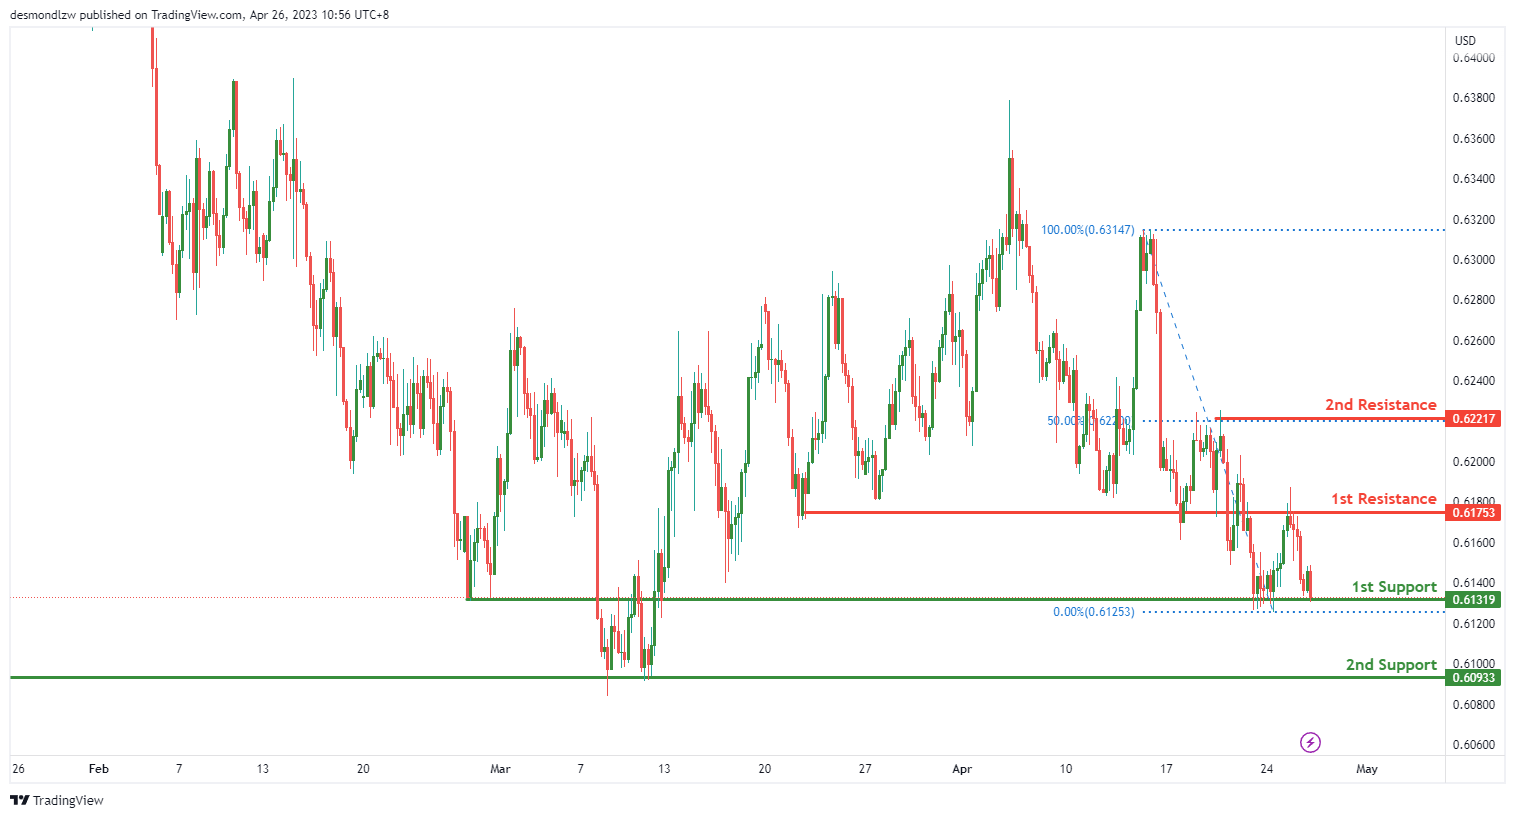
NZD/USD:
The NZD/USD chart is currently exhibiting an overall bearish momentum, indicating that the price may potentially break through the first support levels. The first support level is at 0.6132 and may provide potential support.
The next potential support level is at 0.6093, which is a multi-swing low support and may provide additional support for the price if it were to drop further.
On the other hand, if the price were to rise, the 1st resistance level is at 0.6175. This level is a multi-swing high resistance, making it a strong level for potential resistance.
If the price were to break above the 1st resistance level, the next potential resistance level is at 0.6222. This level is also an overlap resistance and coincides with the 50.0% Fibonacci retracement, making it a strong level for potential resistance.
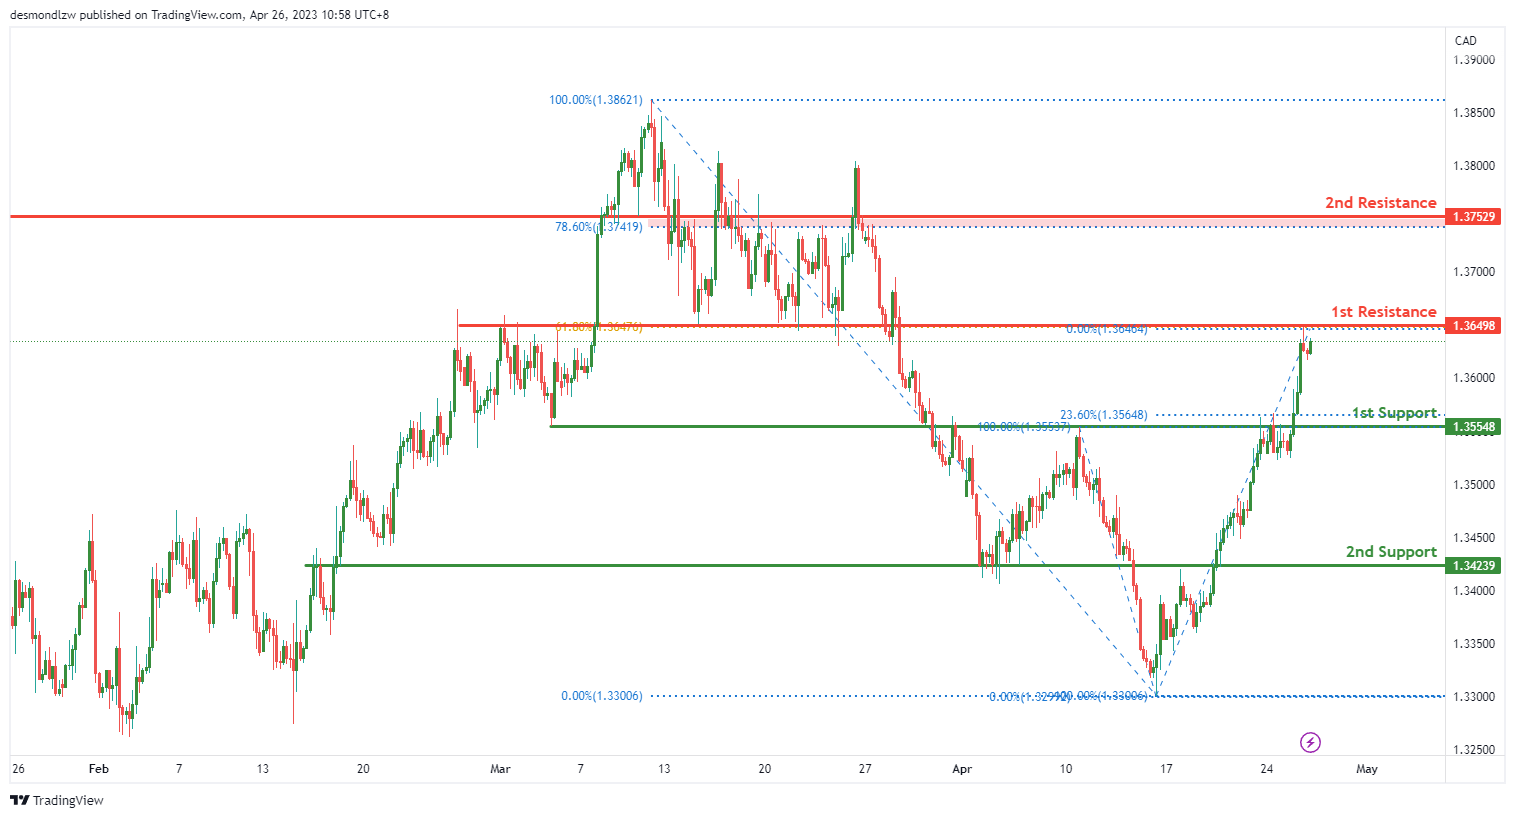
USD/CAD:
The USD/CAD currency pair has been showing bullish momentum recently, with the potential for continued upside movement towards the first resistance level.
The first support level at 1.3555 is a good level to watch, as it represents an overlap support and also coincides with the 23.60% Fibonacci retracement level. A bounce off this level could signal a continuation of the recent bullish trend.
The second support level at 1.3424 is also an overlap support and may provide additional buying opportunities in case of a deeper retracement.
On the upside, the first resistance level at 1.3650 is an overlap resistance and coincides with the 61.80% Fibonacci retracement level, making it a strong area of resistance. If price breaks above this level, it could indicate a sustained bullish trend.
The second resistance level at 1.3753 is also an overlap resistance and coincides with the 78.60% Fibonacci retracement level, adding further strength to this resistance level.
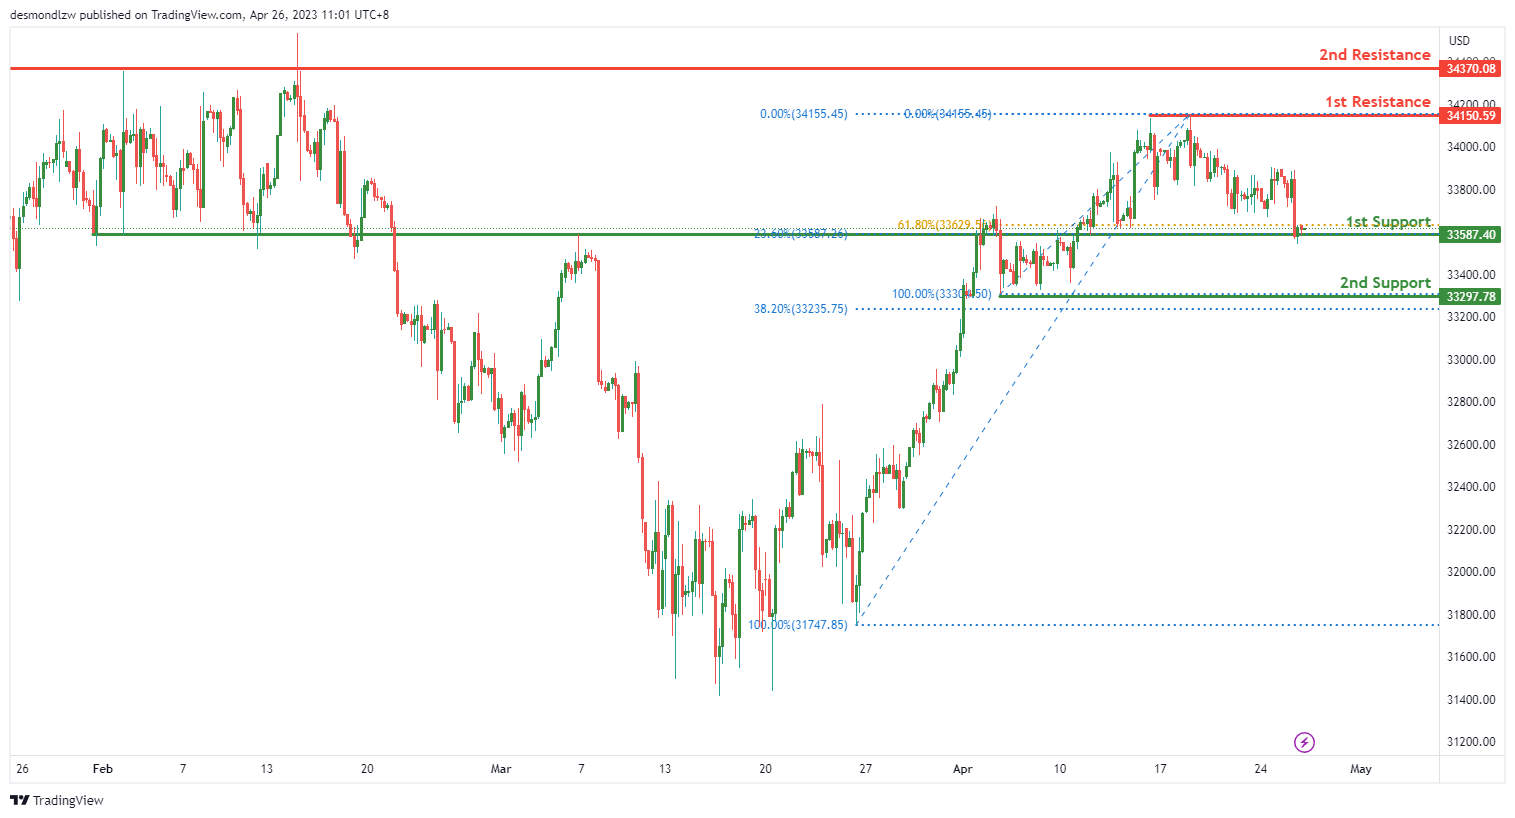
DJ30:
The DJ30 has been showing a weak overall momentum with low confidence. However, the price could potentially make a bullish bounce off the first support level and head towards the first resistance level.
The first support level is at 33,587.40 and it is considered a good support level due to its overlap support and its 23.60% Fibonacci retracement. The second support level is at 33,297.78, and it is also an overlap support, and its 38.20% Fibonacci retracement makes it a good level of support.
The first resistance level is at 34,150.59 and it is considered a good level of resistance due to its multi-swing high resistance. The second resistance level is at 34,370.08, and it is an overlap resistance that provides another potential level of resistance.
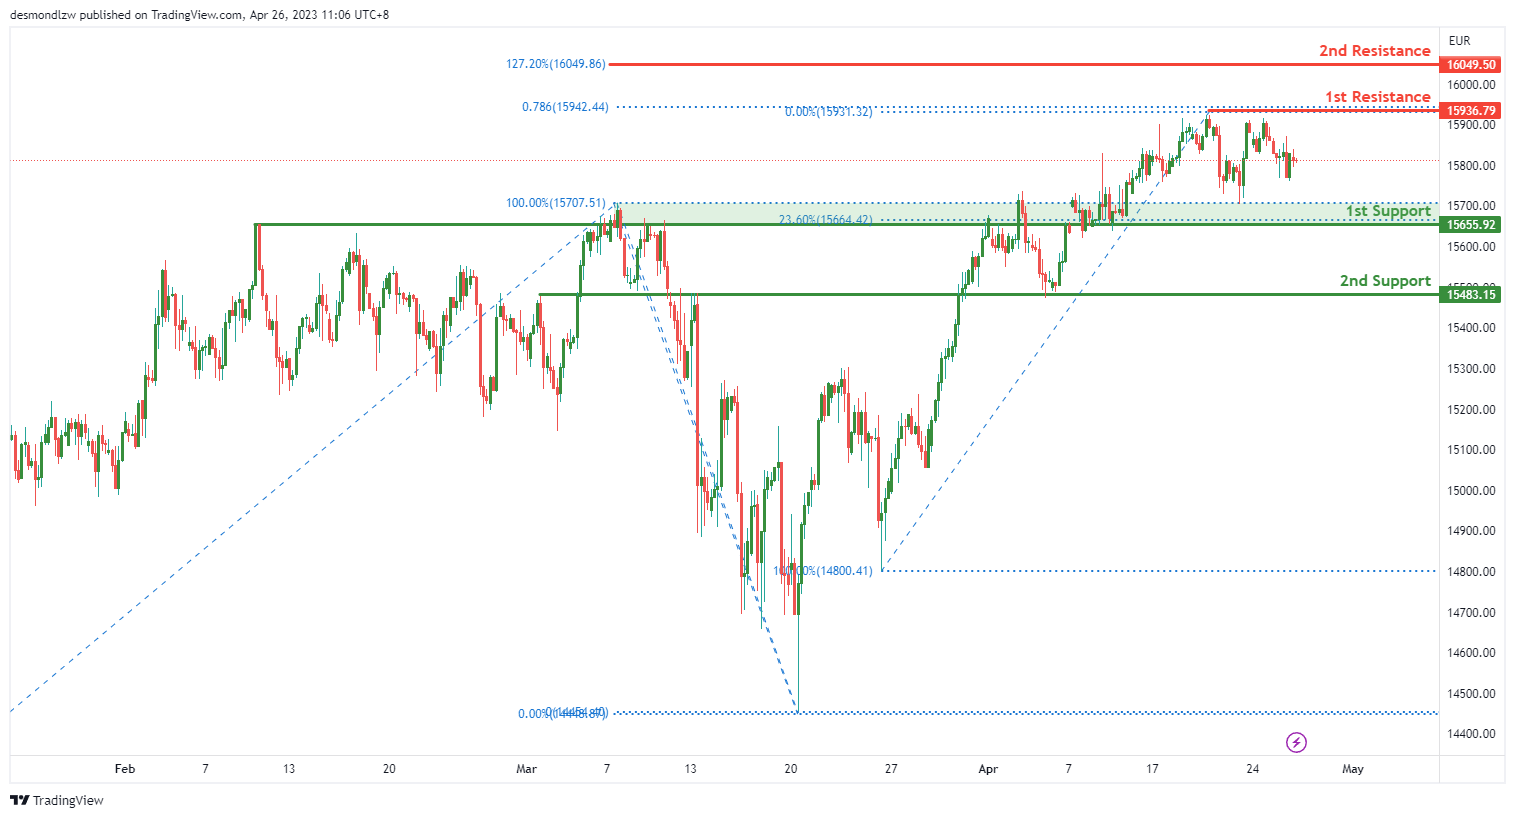
GER30:
The GER30 index has been trading in a neutral momentum. The price could potentially fluctuate between the 1st support and 1st resistance level.
The 1st support level is at 15655.92, which is an overlap support and also coincides with the 23.60% Fibonacci retracement level. The 2nd support level is at 15483.15, which is an overlap support.
On the upside, the 1st resistance level is at 15936.79, which is a multi-swing high resistance level. The 2nd resistance level is at 16049.50, which is an overlap resistance level and also coincides with the 127.20% Fibonacci extension level.
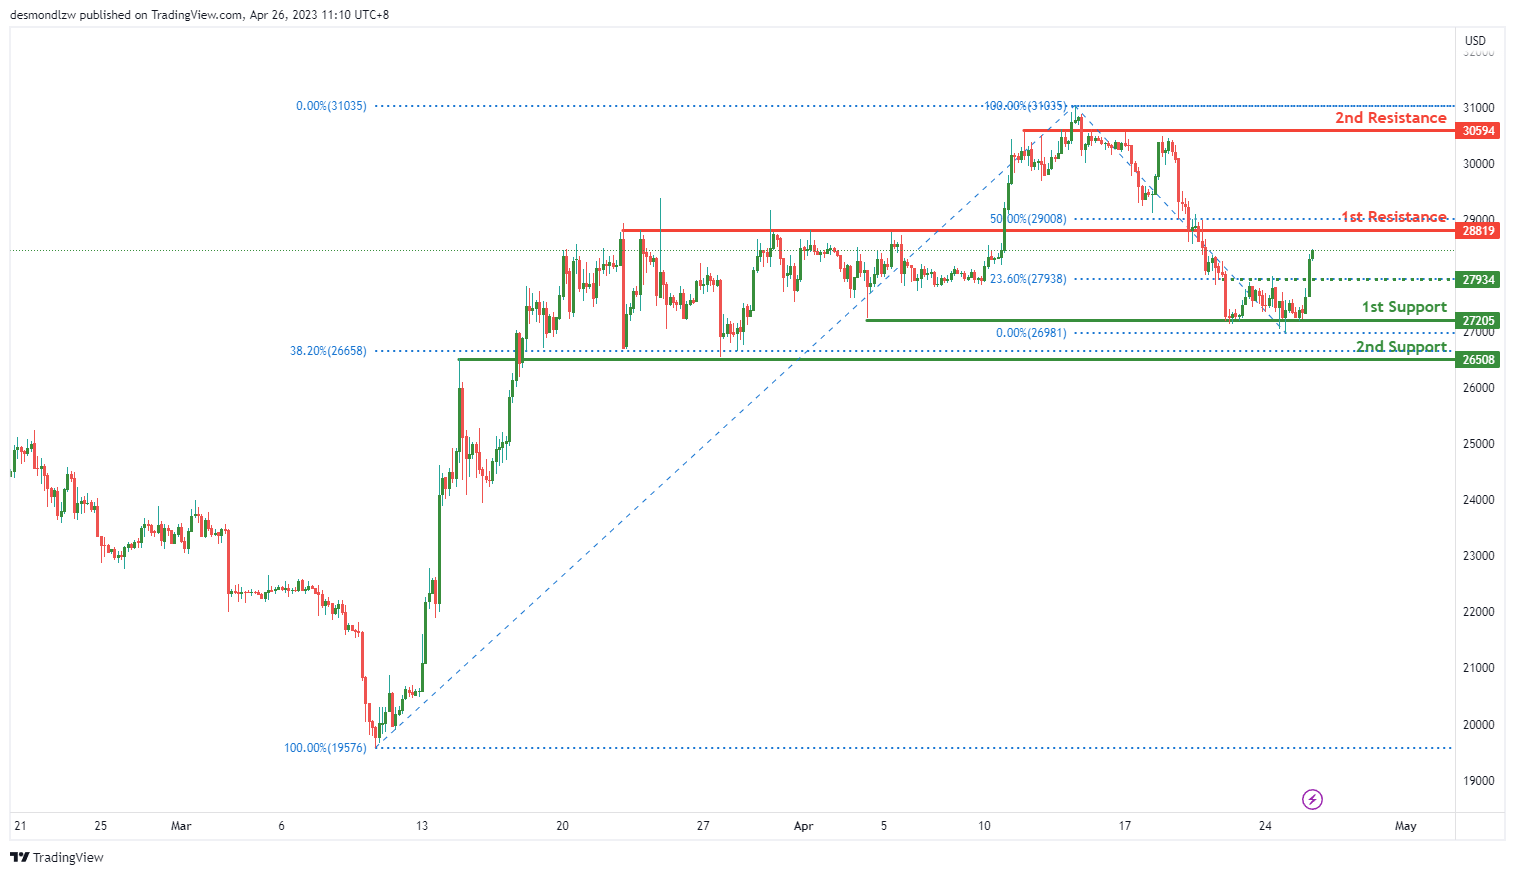
BTC/USD:
The current overall momentum of the chart for BTC/USD is showing strong bullishness with high confidence. Based on the current price action, Bitcoin has the potential to continue its bullish trend towards the first resistance level.
The first support level for BTC/USD is located at 27205.00, which is an overlap support level. This support level is expected to hold if the bullish trend continues. However, if the price drops below this level, the next support level is located at 26508.00, which is also an overlap support level and a 38.20% Fibonacci retracement level.
On the upside, the first resistance level is located at 28819.00, which is an overlap resistance level and a 50% Fibonacci retracement level. This level has the potential to attract sellers and push the price lower. However, if the price breaks above this level, the next resistance level is located at 30594.00, which is another overlap resistance level.
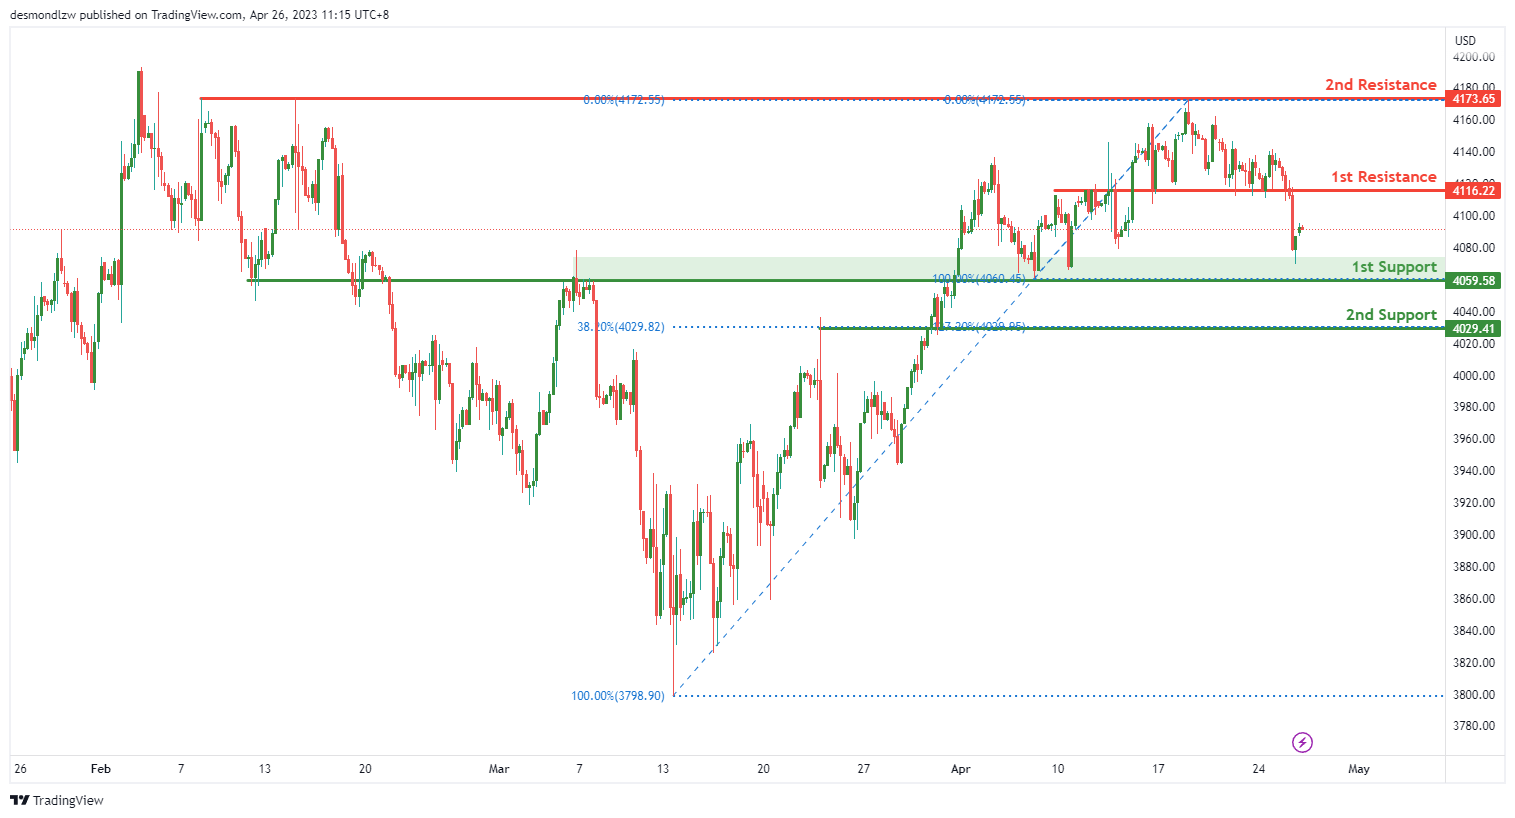
US500
The US500 is currently exhibiting neutral momentum. Based on the chart, price could potentially fluctuate between the 1st resistance and 1st support level.
The 1st support level is at 4059.58 and is considered good because it is an overlap support. The 2nd support level is at 4029.41 and is also a good support level because it coincides with the 38.20% Fibonacci retracement.
On the other hand, the 1st resistance level is at 4116.22, which is an overlap resistance. The 2nd resistance level is at 4173.65, which is also an overlap resistance.
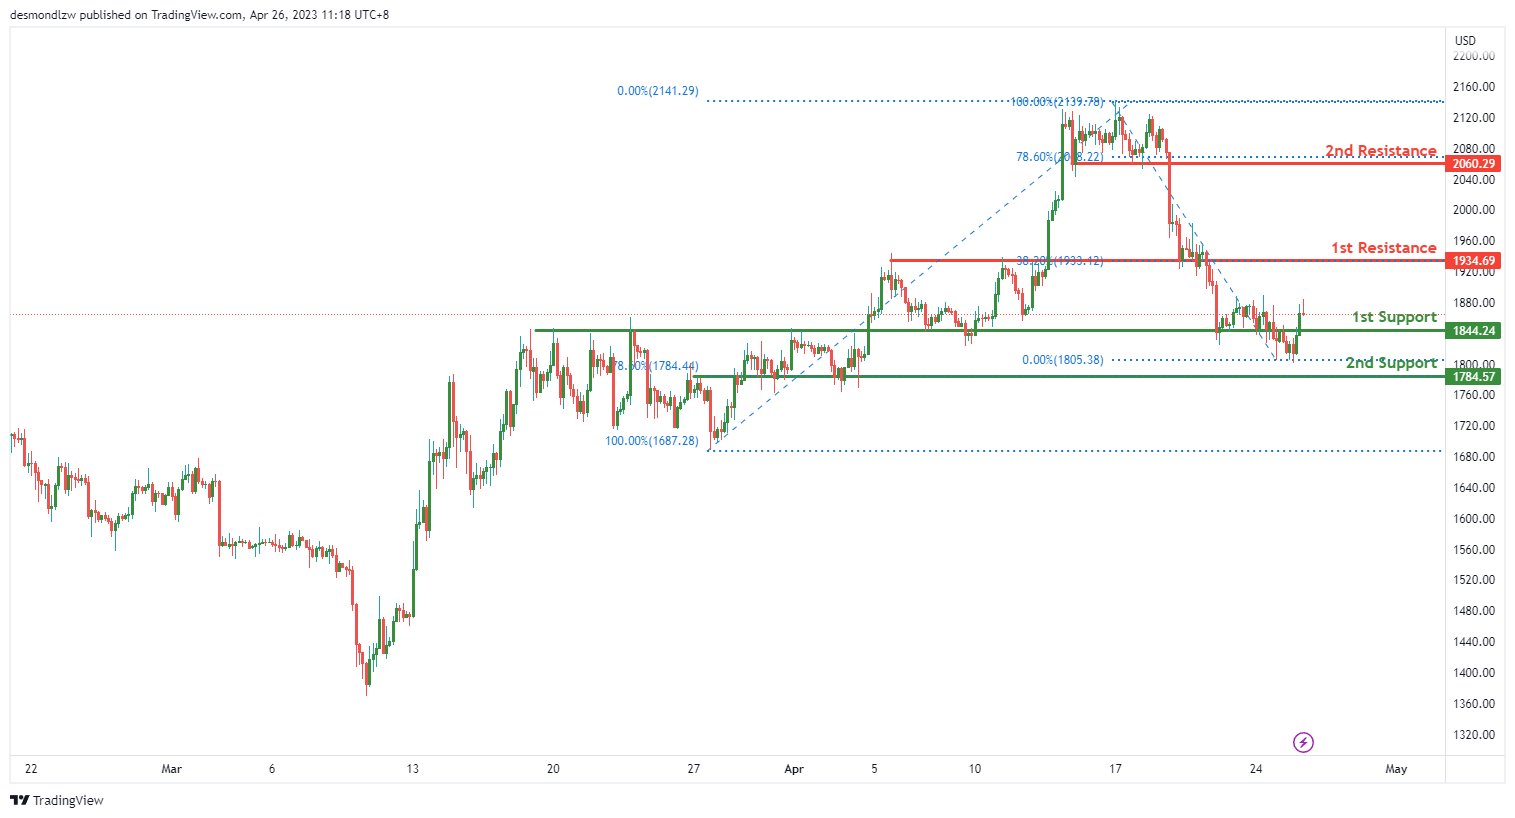
ETH/USD:
The chart of ETH/USD is currently showing signs of weakness with low confidence. The price could potentially continue its bearish move towards the first support level, which is located at 1844.24. This level is significant as it has acted as an overlap support in the past, which makes it more likely that it will provide a bounce for the price.
In case the price breaks below the first support level, it may continue to decline towards the second support level at 1784.57. This level is also significant as it represents the 78.60% Fibonacci retracement level of the recent bullish move, adding to its significance.
On the upside, the first resistance level at 1934.69 is significant as it has acted as an overlap resistance in the past. If the price manages to break above this level, it may head towards the second resistance level at 2060.29, which is also an overlap resistance and coincides with the 78.60% Fibonacci retracement level.
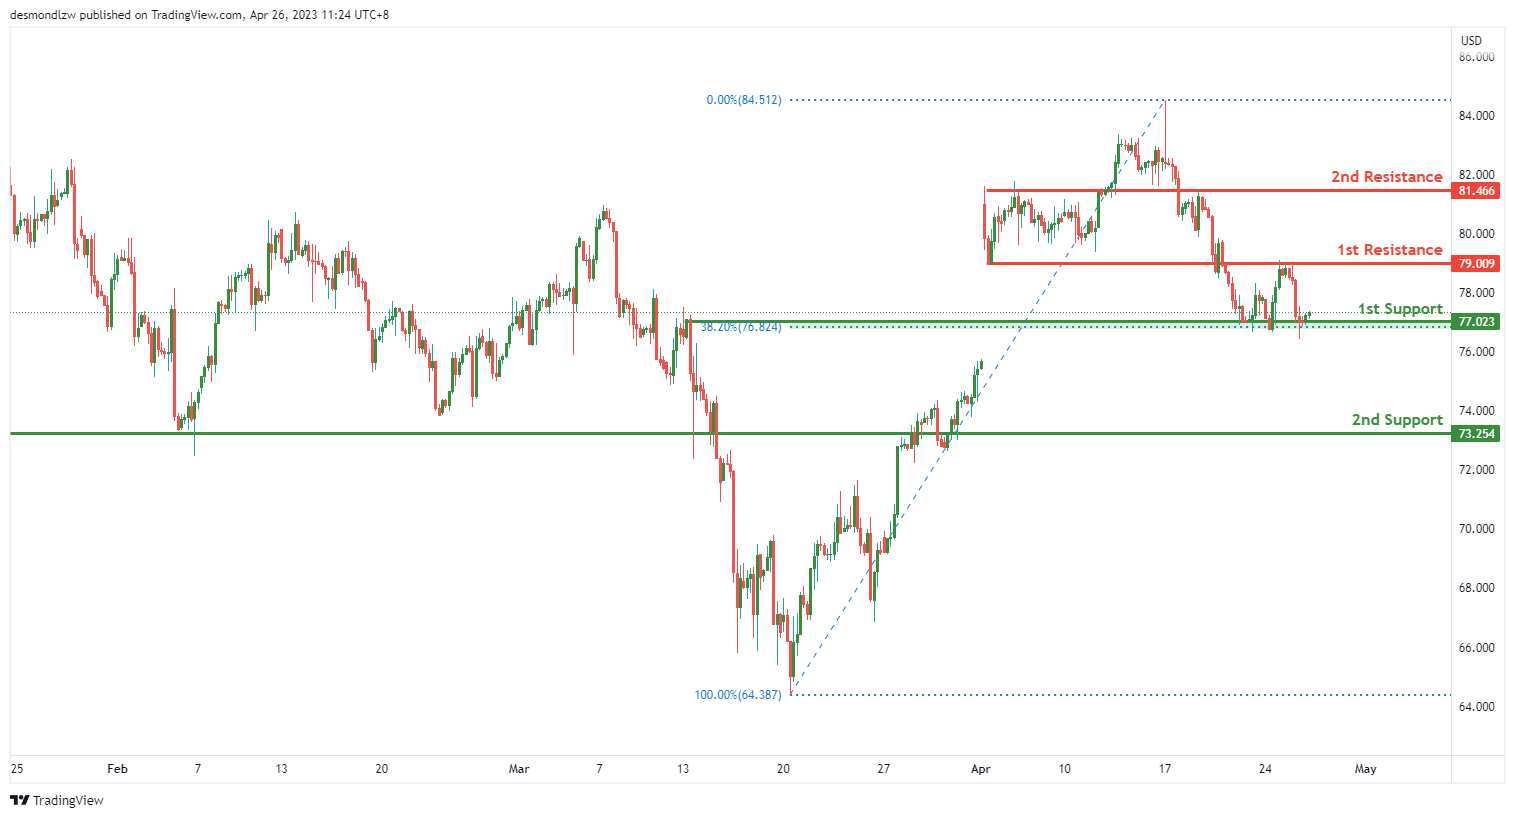
WTI/USD:
The overall momentum of WTI chart is currently bullish. The recent dip in price has provided a buying opportunity for traders as the price could potentially make a bullish bounce off the 1st support level and head towards the 1st resistance level.
The 1st support level is at 77.02 and it is a good support level as it is an overlap support level and also a 38.20% Fibonacci Retracement level. A bounce from this level could lead to a bullish momentum in price.
If the price fails to bounce off the 1st support level, it could potentially drop further to the 2nd support level at 73.25. This is also a good support level as it is an overlap support level.
On the other hand, the 1st resistance level is at 79.01 and it is a good resistance level as it is an overlap resistance level. If the price manages to break through this resistance level, it could potentially head towards the 2nd resistance level at 81.47.
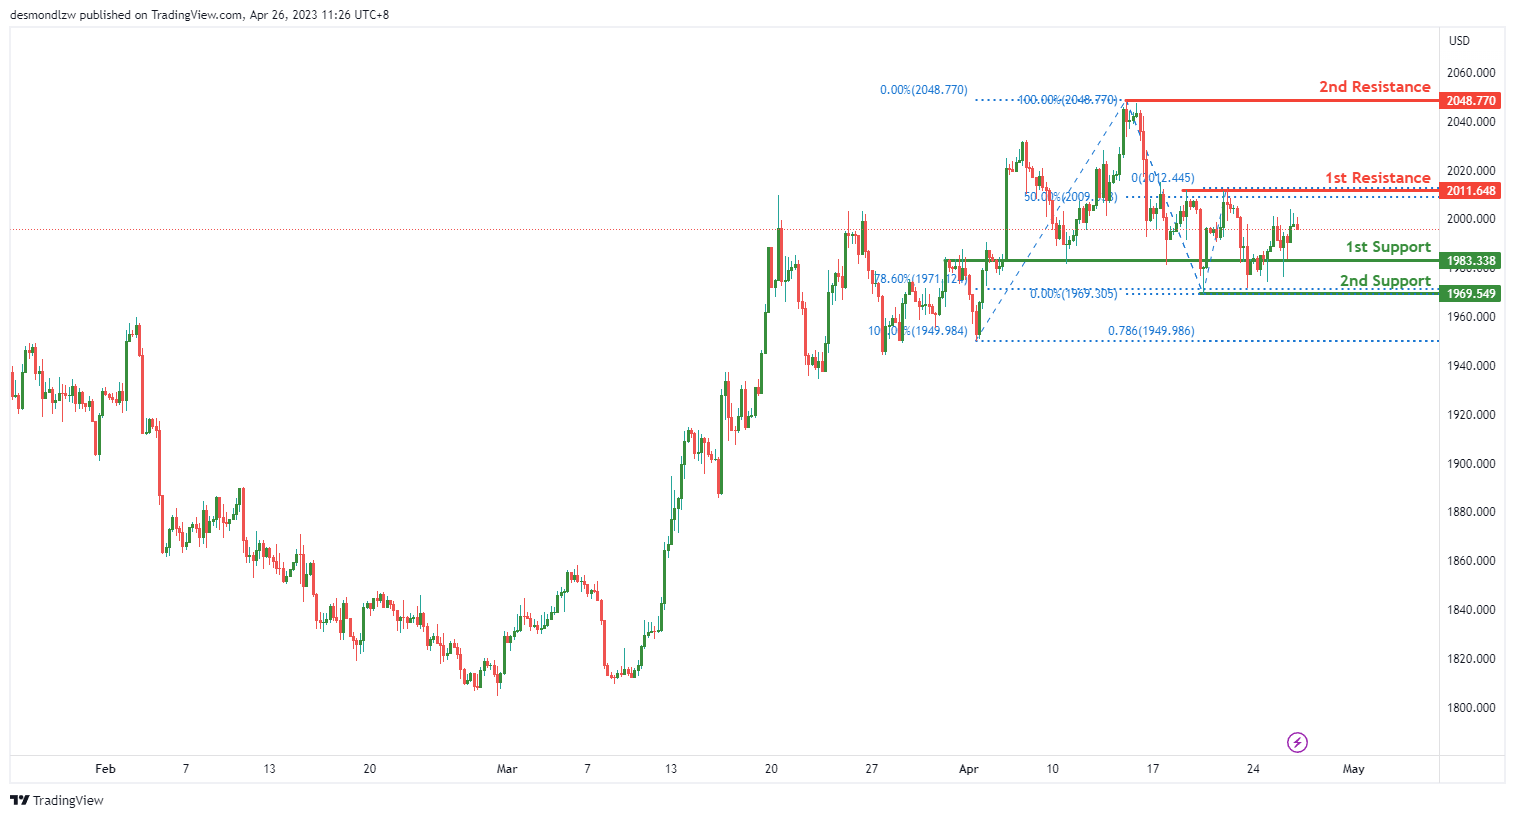
XAU/USD (GOLD):
The XAU/USD price has a weak bearish momentum with low confidence, and it could potentially make a bearish continuation towards the first support level before bouncing back up towards the first resistance level.
The first support level is at 1983.34, which is an overlap support. The second support level at 1969.55 is also an overlap support and is at 78.60% Fibonacci retracement.
On the other hand, the first resistance level at 2011.65 is an overlap resistance and is at 50% Fibonacci retracement. The second resistance level at 2048.77 is a swing high resistance.


