
- Conflicting macro news flow has capped gold in a short-term range-bound movement.
- 1-year rolling uptrend of gold versus most major fiat currencies remains intact.
- Lower 10-year US Treasury real yield may provide an impetus for gold bulls.
The recent movement in the price of gold has started to falter from its recent 52-week high of US$2,048 per ounce reached on 13 April 2023. So far, it has staged a pull-back of -3.8% to hit a recent low of US$1,969 and faced a bit of a struggle to trade above $2,010 which is also around its 20-day moving average.
There are a couple of reasons to explain the recent bout of short-term lackluster range-bound movement. Firstly, the current pull-back in gold from its US$2,048 recent high has taken shape right below the prior significant all-time high peaks of US$2,075 (7 Aug 2020) and US$2,070 (8 Mar 2022) which translates to lingering fear in the mindset of market participants that a failed third attempt to break above its prior significant peaks may lead to a potential major downside reversal for gold.
Secondly, conflicting macro news flow; the positive narratives that support bullish bias on gold such as heightened geopolitical risks that arise from the economic realm (US-China High Tech War, ramped-up discussions on de-dollarization and deglobalization) and ongoing territorial disputes between Russia and Ukraine plus more recent frequent “outbursts exchanges” between US and China officials on the status of Taiwan’s sovereignty.
On the flip side, the negative narrative will be a switch of demand from safe-haven assets such as gold to risk-on assets when the dovish Fed pivot materializes to kickstart a fresh interest rate cut cycle as soon as July based on expectations from interest rates futures.
Aside from these conflicting factors, other insightful elements are worth highlighting that may impact the prices of gold in the short to medium term.
Gold has continued to trend higher against most fiat currencies & XAU/USD plays a catch-up
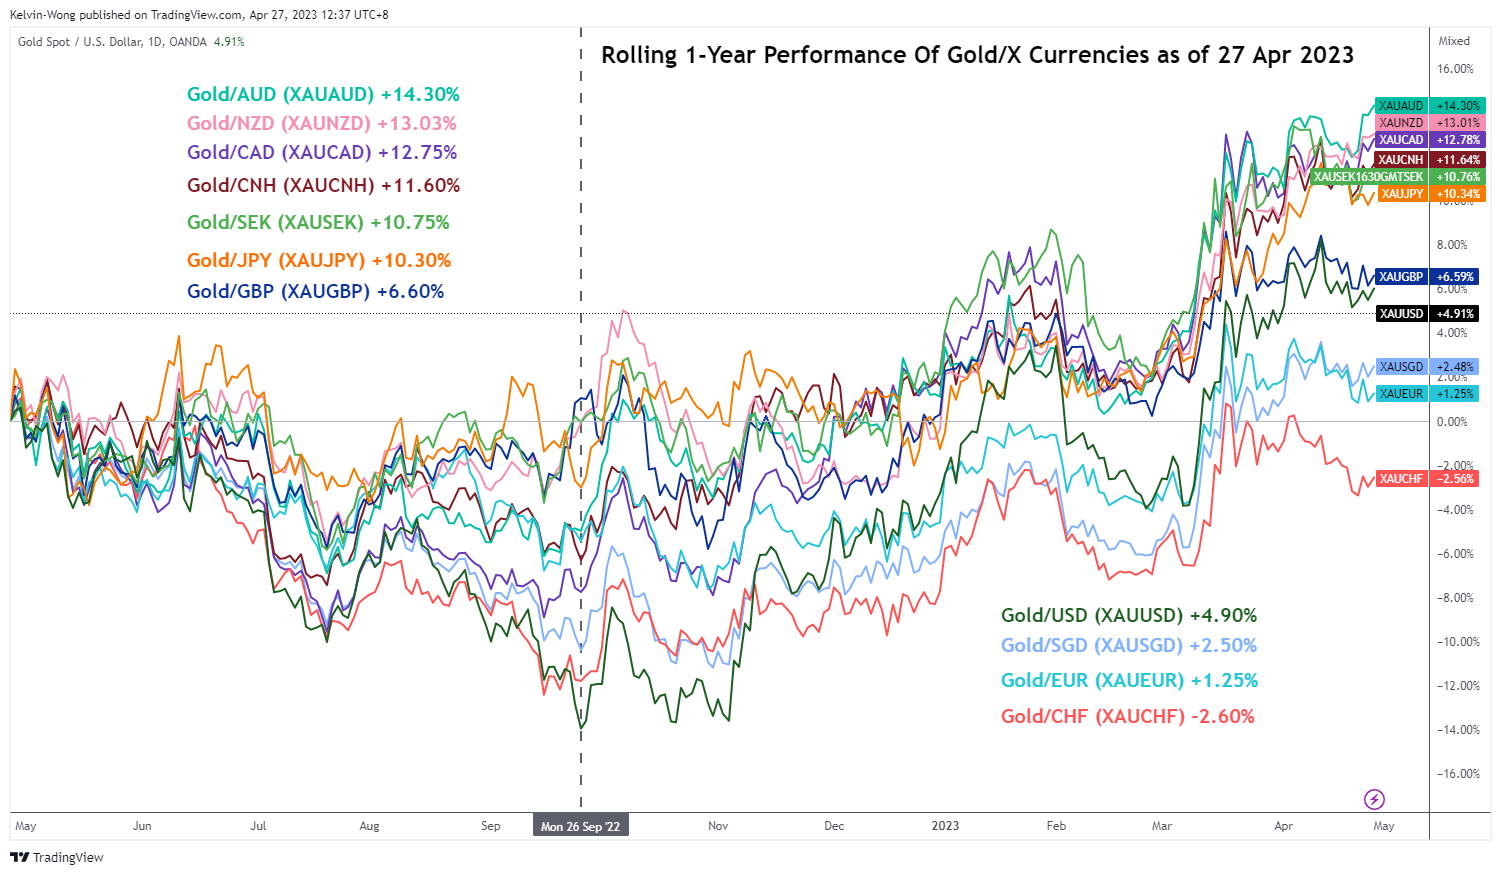
Fig 1: Gold vs. fiat currencies 1-year rolling performances as of 27 Apr 2023 (Source: TradingView, click to enlarge chart)
The performance of gold against other currencies such as JPY, AUD, CAD, NZD, and SEK) has led other XAU pairs and trended higher since the end of September 2022. Interestingly, one of the laggards, gold against USD (XAU/USD) has started to play catch-up since early March 2023 and recorded a rolling 1-year gain of +4.90% as of 27 April 2023.
If one has a staunch belief in the principle of “trend-following”, follow the major trend as they will advocate.
A further fall in US 10-year Treasury real yield may have a positive impact on gold
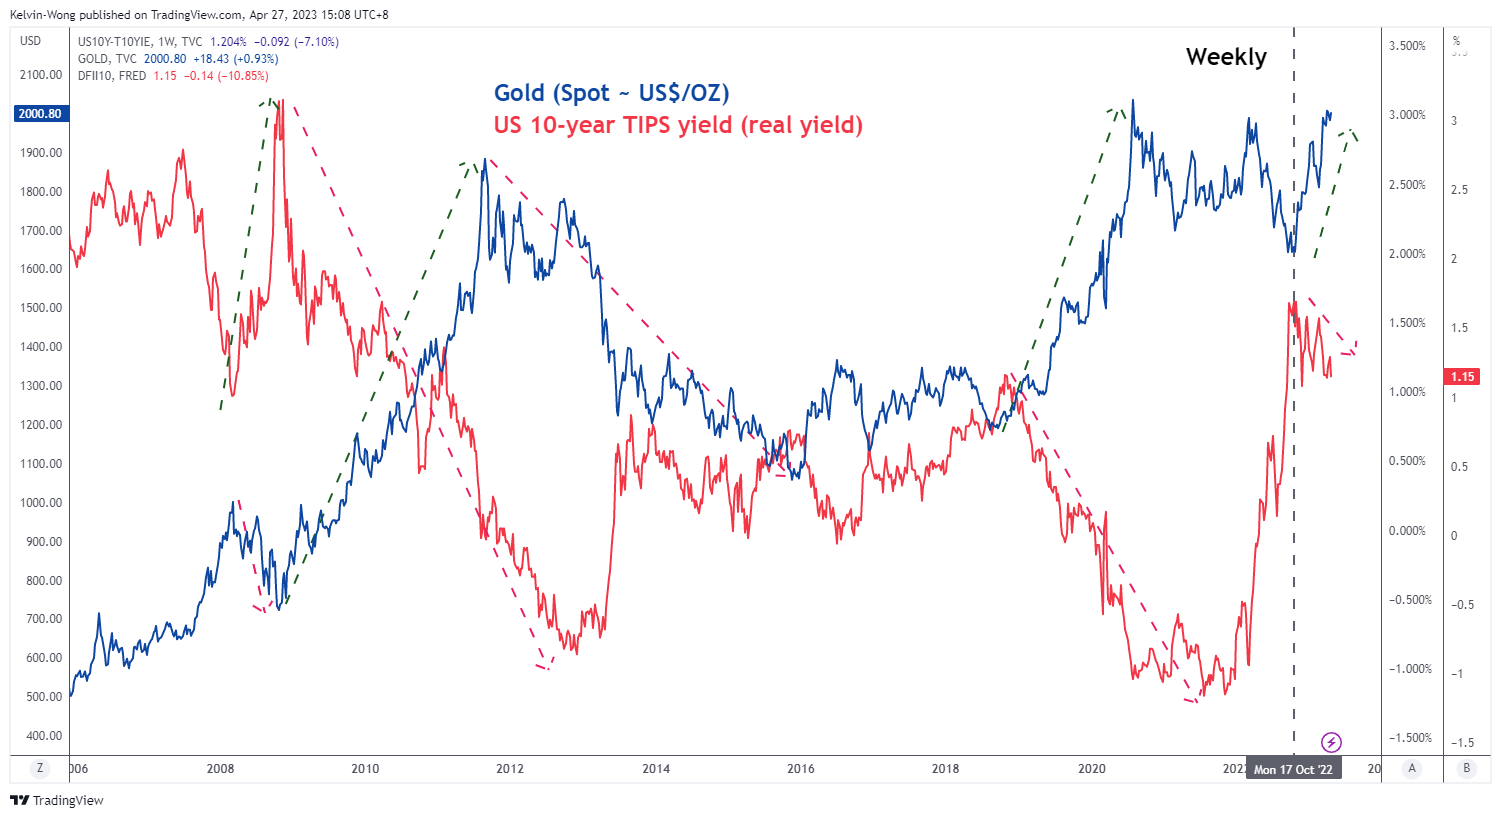
Fig 2: Correlation between Gold & US 10-YR Treasury real yield as of 27 Apr 2023 (Source: TradingView, click to enlarge chart)
Gold is a zero-yield asset as it does not generate recurring streams of cash inflows such as dividends and coupon payments from investing in equities and bonds respectively. Hence, if one establishes a long position in gold and held for some time, there will be opportunity costs incurred such as interest income forgone on coupon payments if invested in bonds. Hence, a higher bond yield translates to a higher opportunity cost for holding gold.
Based on a general correlation analysis since 2007 on the movement of a longer-term 10-year US Treasury real yield (excluding inflation effects) derived from the market price of the 10-year US Treasury inflation-protected securities with the price of spot gold (US$ per ounce), it has shown that prior significant up moves in gold have coincided with declines in the 10-year US Treasury real yield and vice versa when the real yield rallied.
Since Oct 2022, the 10-year US Treasury real yield has continued to inch lower and traced out a series of “lower highs” which in turn may support a further potential up move in gold.
Gold (XAU/USD) Technical Analysis – major uptrend intact, eyeing a retest at 2,075 all-time high
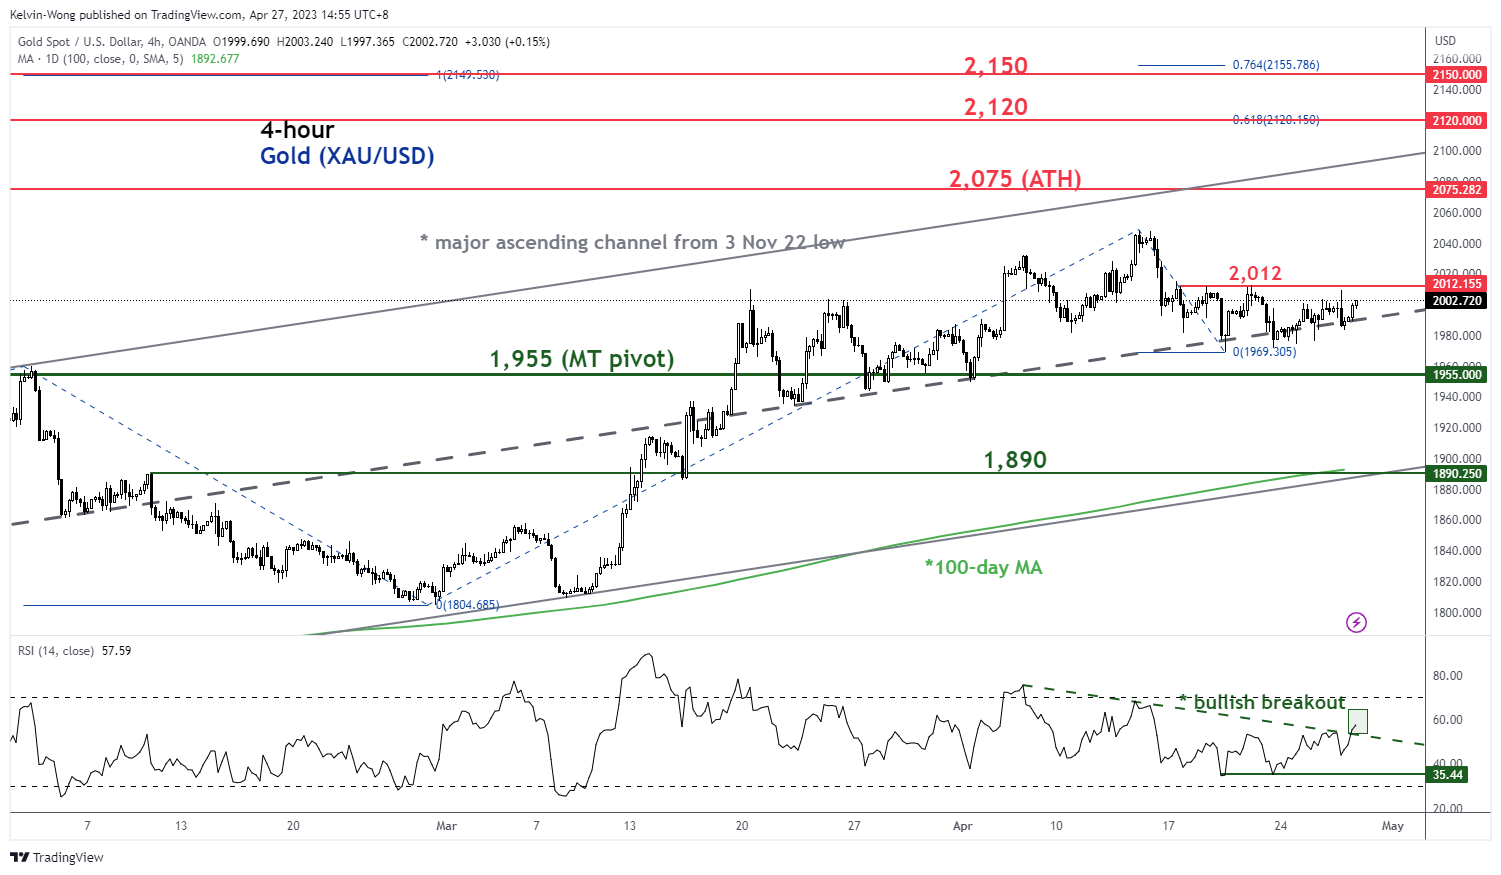
Fig 3: Gold (XAU/USD) trend as of 27 Apr 2023 (Source: TradingView, click to enlarge chart)
The recent -3.9% pull-back in gold (XAU/USD) from its 13 April 2023 high of 2,048 has managed to stall at the median line of the major ascending channel in place since the 3 November 2022 low.
The 4-hour RSI oscillator has just managed to stage a bullish breakout from its former corresponding descending resistance at the 55% level and has yet to reach its overbought region of above 70% which suggests a potential revival of short to medium-term upside momentum.
If the 1,955 key medium-term pivotal support holds and a break above the 2,012 intermediate resistance, XAU/USD may see a retest on its current all-time level of 2,075 printed on 7 August 2020. A clearance above 2,075 sees the next resistance coming in at 2,120 (upper boundary of the ascending channel & a key Fibonacci expansion level).
However, a break with a 4-hour close below 1,955 negates the bullish tone to expose the next support at 1,890 (100-day moving average & the lower boundary of the ascending channel).


