
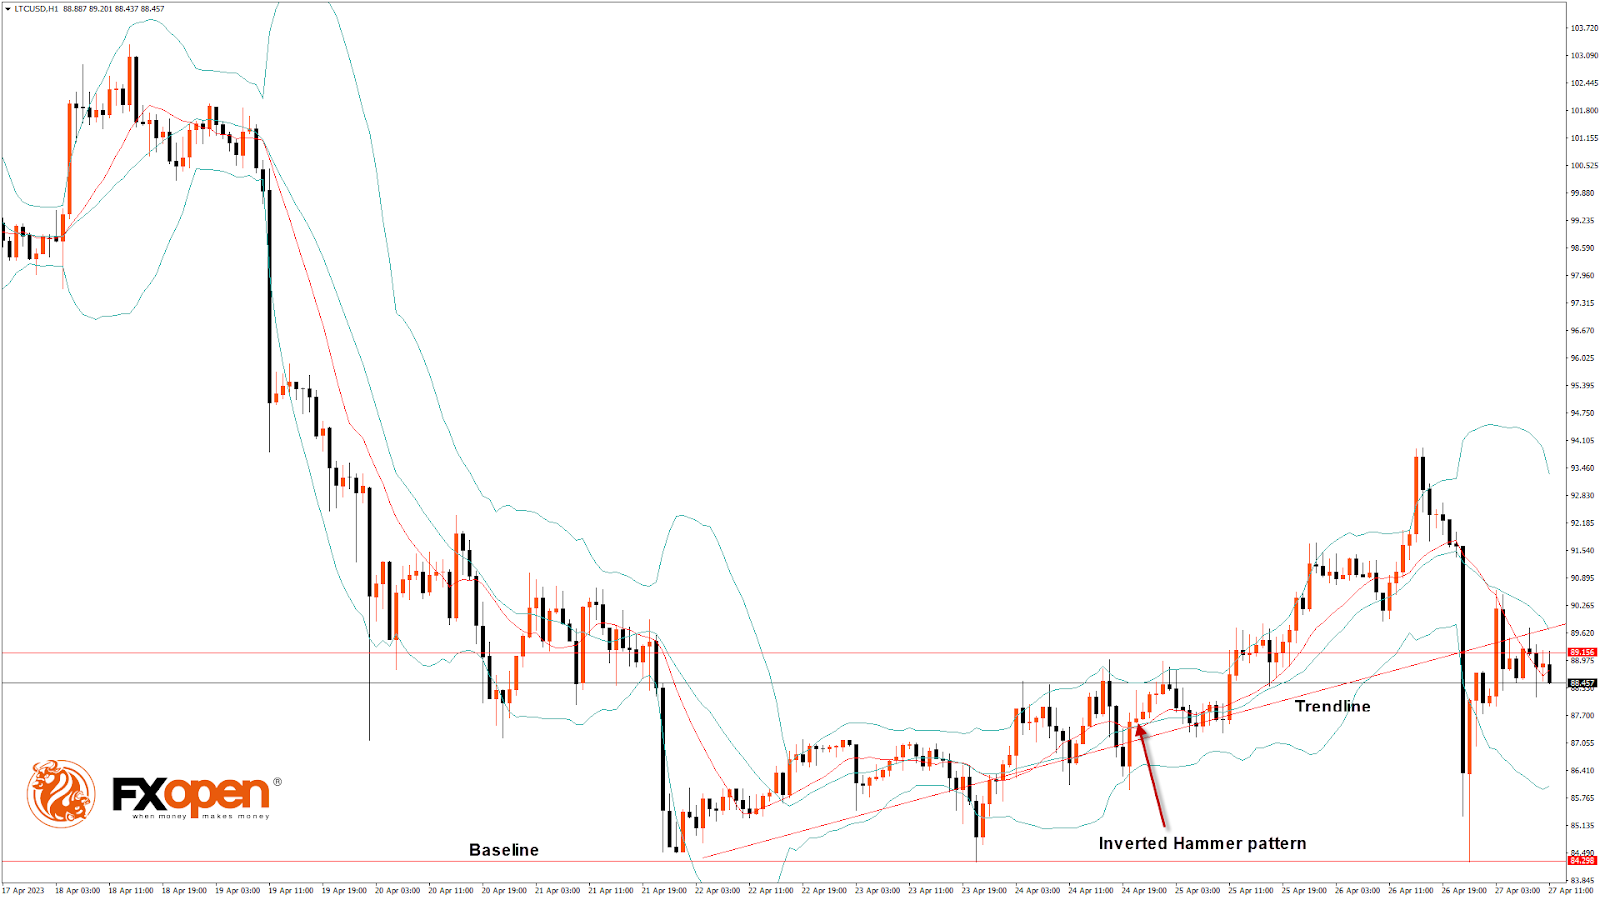
Bulls were able to take control of the market last week, and after touching a low of $84.29 on 26 April, the price started to correct upwards against the US Dollar.
There is an inverted hammer pattern above the $84.29 handle on the H1 timeframe. It signifies the end of a bearish phase and the start of a bullish phase in the market.
The momentum indicator is back over zero in the H1 timeframe, indicating a bullish trend. There is also an upside gap located in the 15-minutes timeframe, which indicates the bullish nature of the market. We can see the formation of the Doji candle in the D1 timeframe, indicating the neutral tone of the market.
Also, Litecoin is trading below its 100-hour simple moving average, 200-hour exponential moving average, and pivot level of $91.57.
The relative strength index is at 53.164, indicating a neural demand for Litecoin and the shift towards the consolidation zone in the markets.
Litecoin remains above some of the moving averages, which is a bullish signal at the current market level of $88.33.
The CCI is signaling neutral market conditions, which means that the price is expected to move in a narrow range in the short term.
The short-term outlook for Litecoin has turned mildly bullish.
- Some of the technical indicators are bullish.
- Litecoin bullish reversal is seen above the $84.39 level.
- The RSI is neutral.
- The average true range indicates high market volatility.
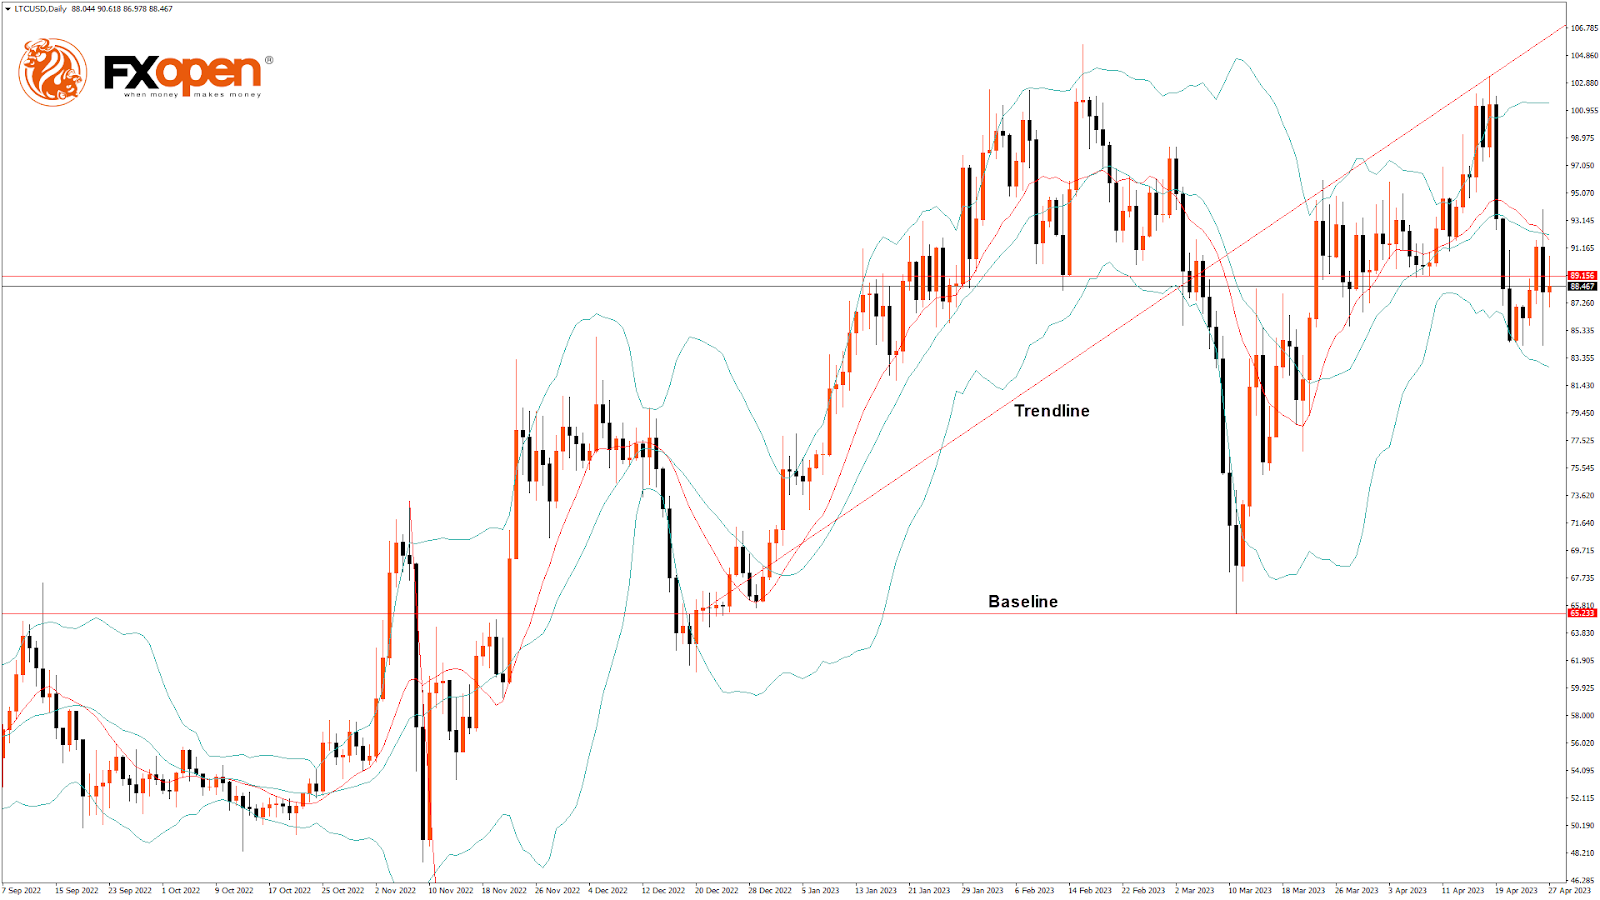
Litecoin Bullish Reversal is seen above $84.29
Litecoin continues to move in a mild bullish momentum after its recent decline below the $85.00 level.
As the prices are now moving into a narrow range, we can expect some bullish moves after the price crosses the $90.00 handle.
Some of the technical indicators are also giving a neutral tone present in the markets.
LTCUSD is about to break its classic resistance level of 89.41 and Fibonacci resistance level of 90.35, after which the path towards $95 will get cleared.
Litecoin faces resistance at $93.77, which is a 50% retracement from a 4-week High/Low, and at $96.43, at which the price crosses the 9-day moving average.
The Week Ahead
Litecoin has entered a consolidation zone, and further resistance levels are $90 and $95.
Most technical indicators are signaling bullish sentiment in the market.
Litecoin should stay above the important support level of $83.56, which is a 3-10 day MACD, and at $80.7, which is a 38.2% retracement from a 13-week low.
The short-term outlook for Litecoin has turned mildly bullish, the medium-term outlook is bullish, and the long-term outlook is neutral at present market conditions.
The weekly projection is $95, with a consolidation zone of $92.


