
- Since its 1 December 2022 high, the Dow Jones Industrial Average has evolved into a major “Expanding Wedge” range configuration.
- In the short-term, no clear signs of upside momentum as its price actions are being capped below the 20-day moving average.
- Key short-term resistance to watch will be at 33,580.
The Dow Jones Industrial Average (DJIA) is one of the underperforming major US stock indices together with the Russell 2000 so far with a recent weekly loss of -1.11% for the week of 8 May and a 2023 year-to-date return of 0.46% against the Nasdaq 100 (+0.61%/21.94%) and S&P 500 (-0.29%/7.41%).
DJIA Technical Analysis – Potential short-term weakness below 33,580 key resistance
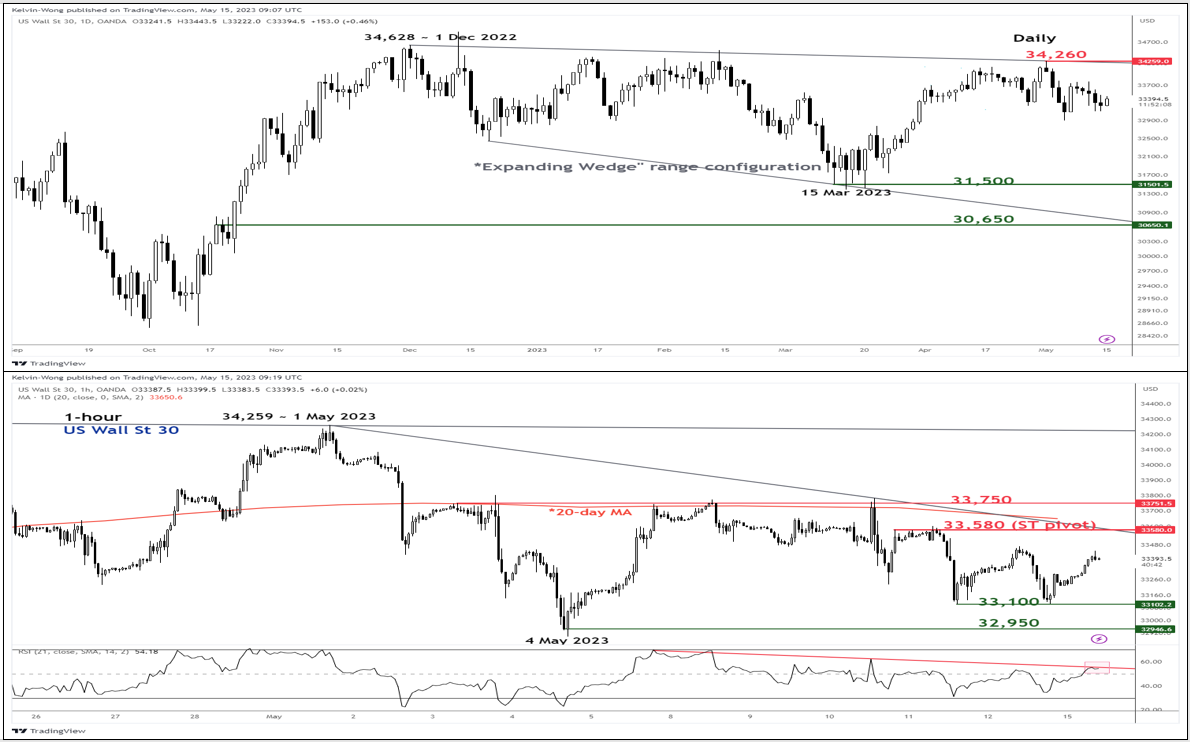
Fig 1: DJIA trend as of 15 May 2023 (Source: TradingView, click to enlarge chart)
Since its 1 December 2022 high of 34,628, the US Wall St 30 Index (proxy of the Dow Jones Industrial Average futures) has started to evolve into a major “Expanding Wedge” range configuration as depicted on the daily chart.
An important point to note is that the Dow Jones Industrial Average is one of the underperforming major US stock indices together with the Russell 2000 so far with a recent weekly loss of -1.11% for the week of 8 May and a 2023 year-to-date return of 0.46% against the Nasdaq 100 (+0.61%/21.94%) and S&P 500 (-0.29%/7.41%).
On a shorter-term frame, using the 1-hour chart, the Index has so far failed to make any headways above its slightly downward-sloping 20-day moving average now acting as a resistance at around 33,580 since the recent break below it on 2 May 2023. In addition, the 1-hour RSI oscillator has remained below a corresponding descending resistance at around the 56% level.
These observations suggest a potential build-up in short-term downside momentum. A break below minor support at 33,100 may expose the 4 May 2023 swing low area at 32,950. On the other hand, a clearance with an hourly close above the 33,580 key short-term pivotal resistance negates the bearish tone to see the next resistance coming in at 33,750 (minor swing high areas of 3 May/8 May/10 May 2023).


 is one of the underperforming major US stock indices together with the Russell 2000 so far with a recent weekly loss of -1.11% for the week of 8 May and a 2023 year-to-date return of 0.46% against the Nasdaq 100 (+0.61%/21.94%) and S&P 500 (-0.29%/7.41%).)