
Key Highlights
- Gold price started a downside correction from the $2,050 resistance zone.
- A major bearish trend line is forming with resistance near $2,015 on the 4-hour chart.
- EUR/USD is consolidating above the 1.0840 support.
- GBP/USD might continue to move down below the 1.2440 support.
Gold Price Technical Analysis
Gold price started a downside correction from the $2,050 zone against the US Dollar. The price traded below the $2,020 support to move into a short-term bearish zone.
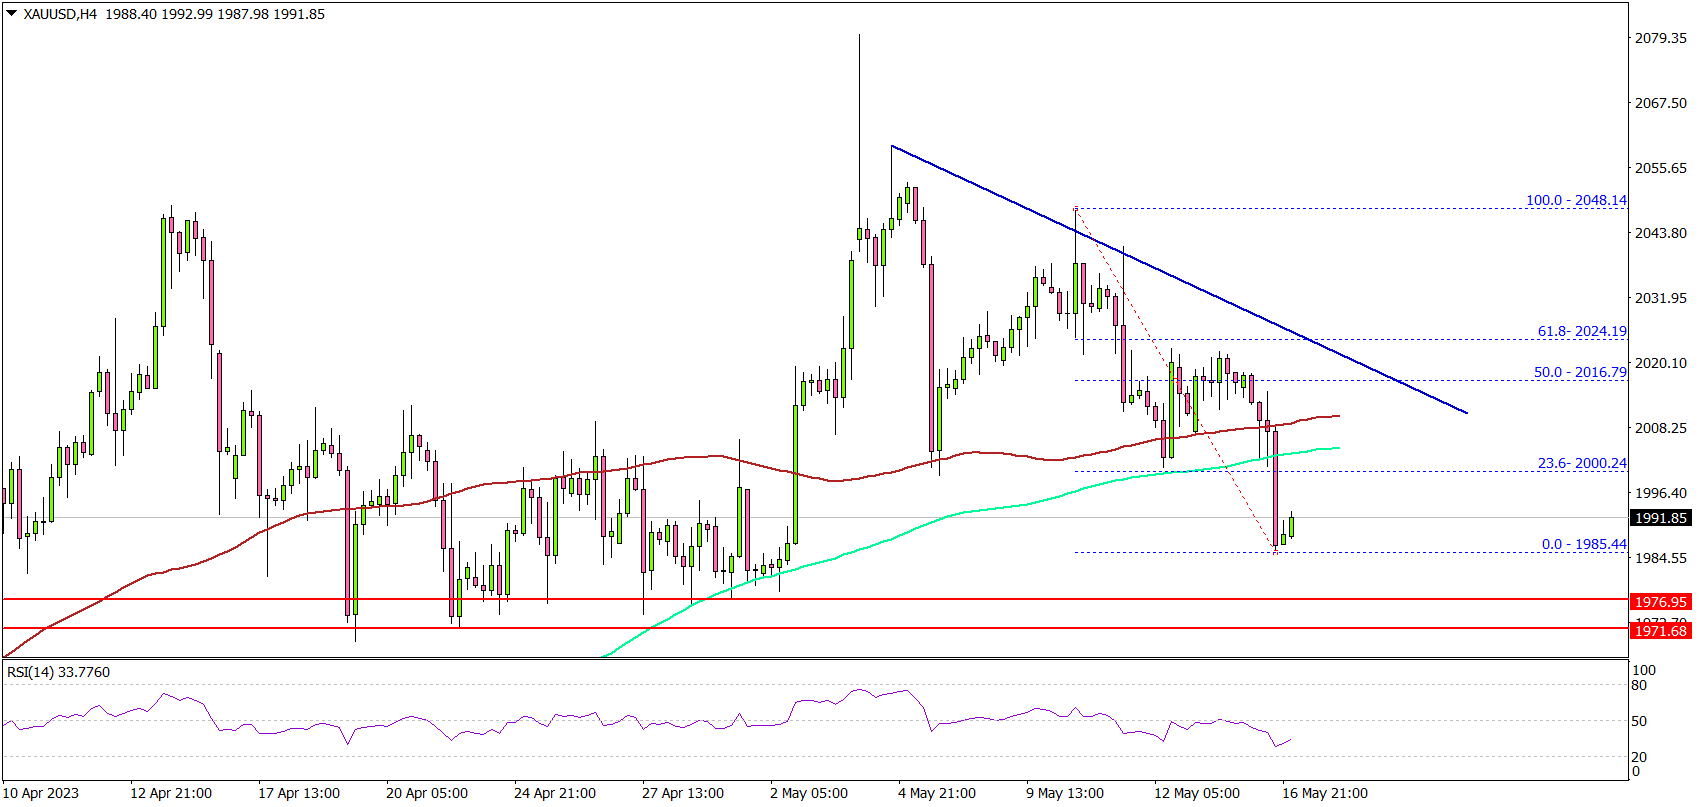
The 4-hour chart of XAU/USD indicates that the price traded below the $2,000 support, the 200 Simple Moving Average (green, 4 hours), and the 100 Simple Moving Average (red, 4 hours).
It seems to be approaching major support near the $1,975 level. If the bulls fail to protect the $1,975 support, there is a risk of a major decline. In the stated case, the price could decline toward the $1,950 level.
Immediate resistance near the $2,008 level. The next major resistance is near the $2,015 level. There is also a major bearish trend line forming with resistance near $2,015 on the same chart.
Any more gains might send the price toward the $2,020 resistance level. A close above $2,020 might start a fresh increase toward the $2,050 resistance level.
Looking at EUR/USD, the pair tested the 1.0840 support and is currently consolidating losses with a risk of more losses.
Economic Releases to Watch Today
- Euro Zone CPI for April 2023 (YoY) – Forecast +7%, versus +7% previous.
- Euro Zone CPI for April 2023 (MoM) – Forecast +0.7%, versus +0.7% previous.


