
DXY:
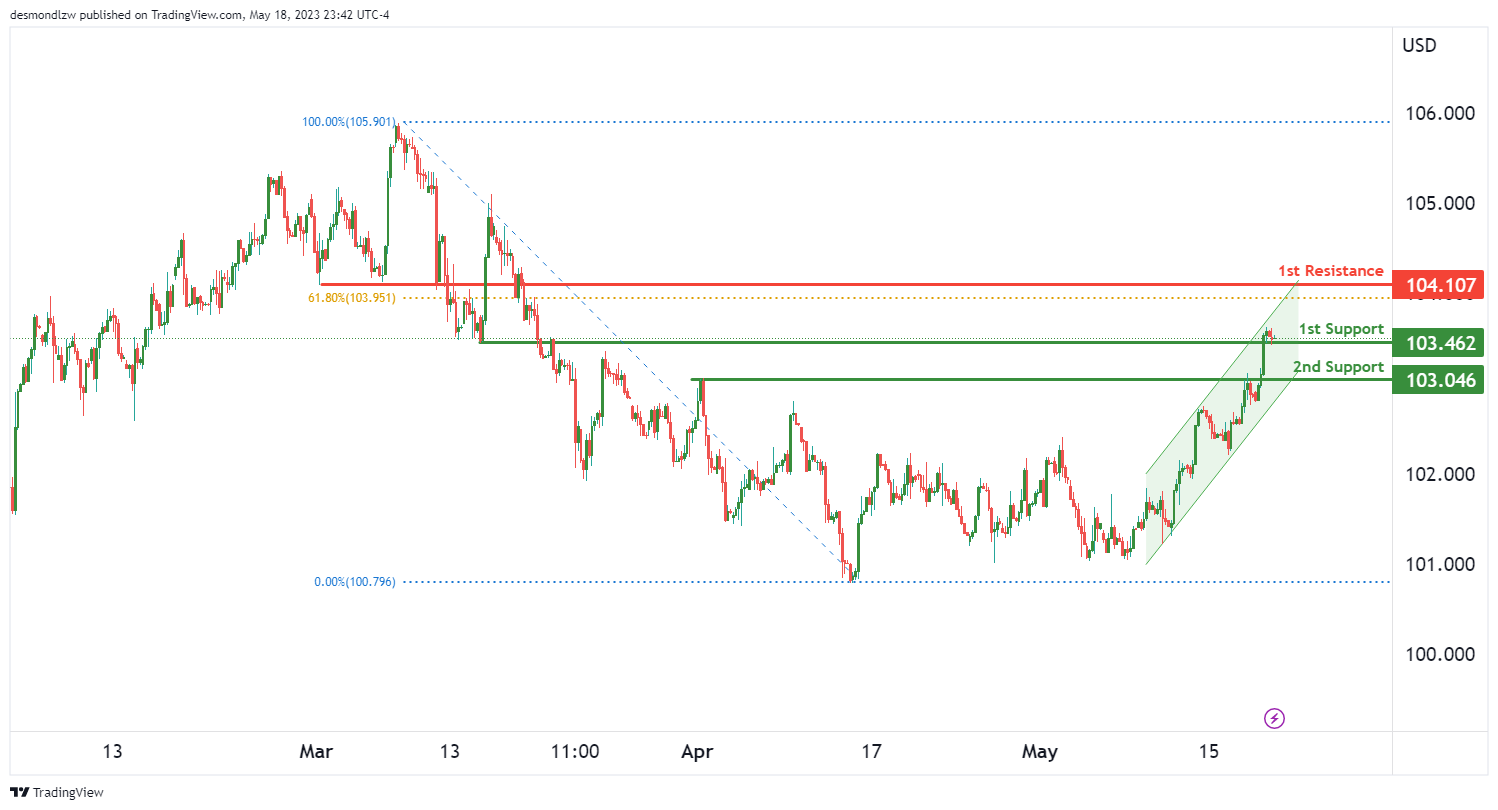
The current momentum of the DXY chart is weakly bullish, but with low confidence. The price movement within a bullish ascending channel contributes to this weak bullish outlook, and we could potentially see a continuation of this upward trend towards the 1st resistance.
The 1st support level is positioned at 103.46 and is considered an overlap support. This type of support is often formed by a price reversal area and can represent a strong buying interest that could potentially prevent a downward movement.
Beneath this, we find the 2nd support level at 103.04. It’s classified as a pullback support. This level could provide an additional barrier for any potential bearish price action and can serve as a backup if the price fails to maintain above the 1st support level.
The 1st resistance level is located at 104.10. This level is known as a pullback resistance, and it aligns with the 61.8% Fibonacci retracement level. It can act as a potential hurdle for the price and could attract selling interest, potentially limiting any further bullish progression.
EUR/USD:
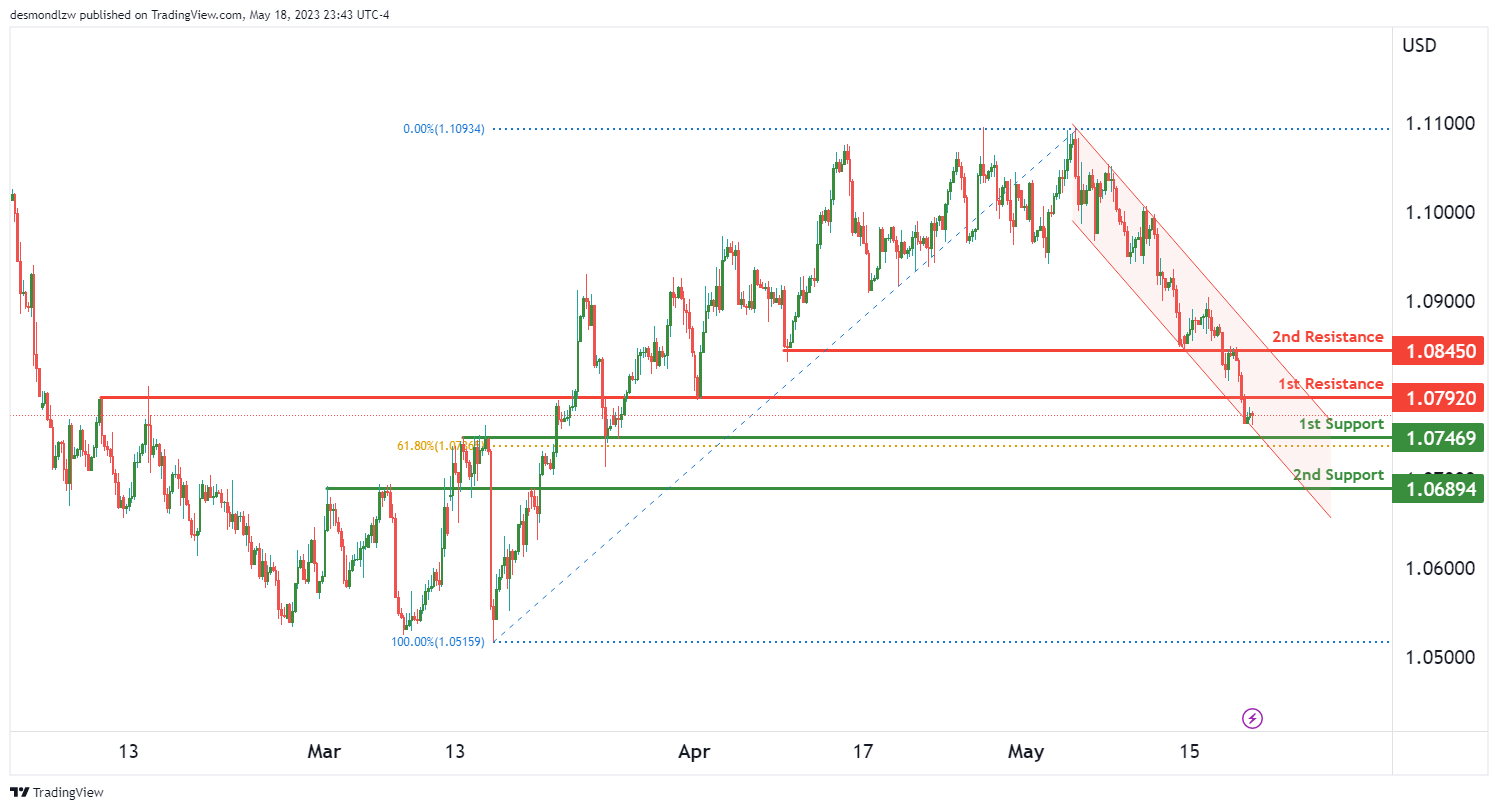
The current momentum of the EUR/USD chart is weakly bearish, but with low confidence. The price is moving within a bearish descending channel, suggesting the potential for further downward movement. It is likely that the price could react bearishly off the 1st resistance and drop towards the 1st support level.
The 1st support level is located at 1.0746, identified as an overlap support and coincides with the 61.8% Fibonacci retracement level. Overlap supports often form at price reversal areas and represent strong buying interest, providing a potential barrier to downward price action.
Further below, the 2nd support is found at 1.0689. This pullback support could offer an additional level of protection against further downward movement. If the price breaks below the first support, this level could act as a backup.
The 1st resistance is located at 1.0792. This overlap resistance could potentially limit upward price action, possibly attracting selling interest.
Above that, the 2nd resistance is at 1.0845. This is another overlap resistance that could provide a significant challenge for any bullish movement.
GBP/USD:
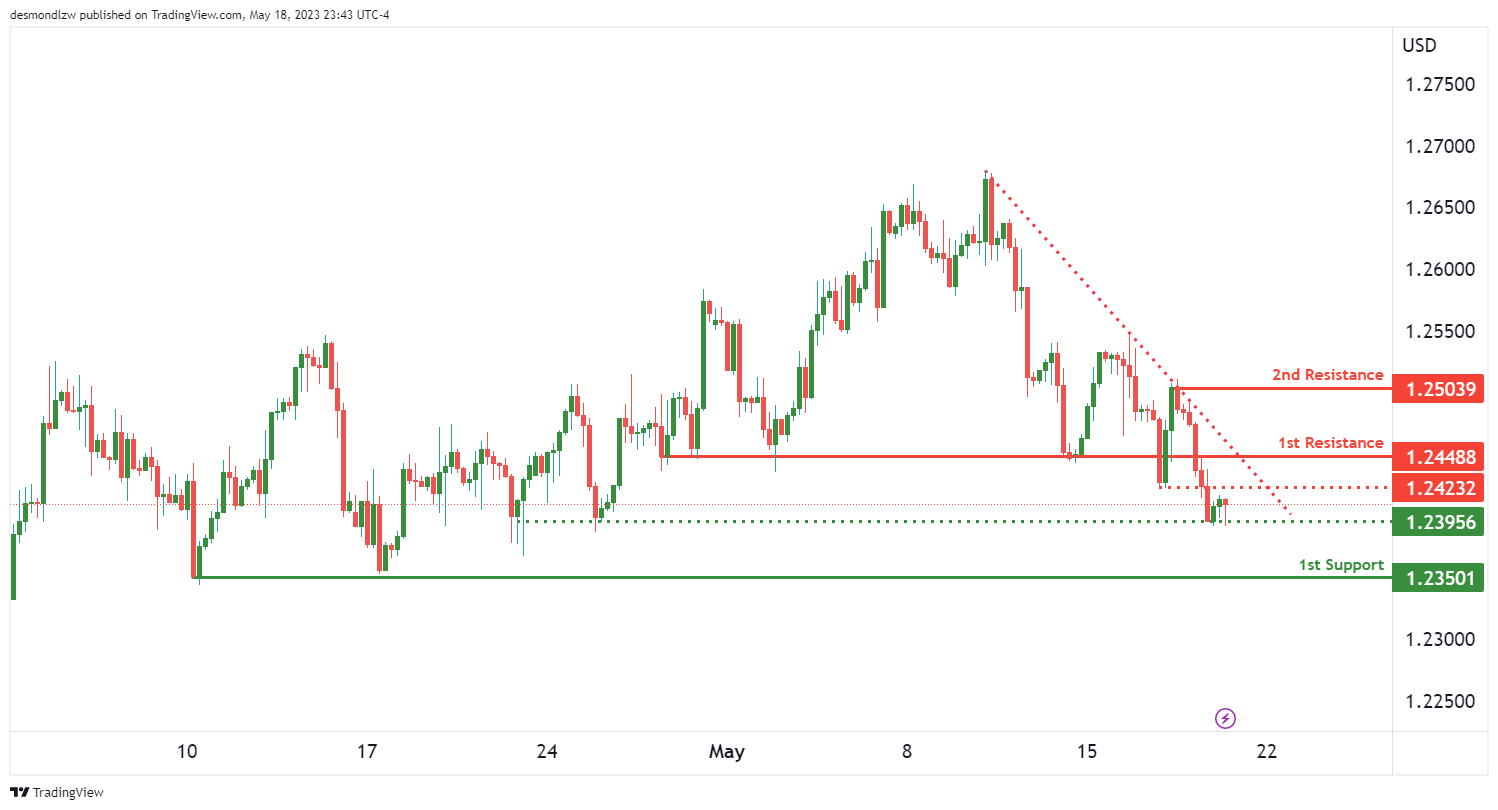
The GBP/USD chart is exhibiting a bearish momentum, with the price below a major descending trend line, suggesting potential continuation of the bearish trend.
The price could potentially make a continuation towards the 1st support level. The 1st support is located at 1.2350, which is considered a strong level as it has served as multi-swing low support in the past.
Below that, the intermediate support is at 1.2395, which is also multi-swing low support, signifying its potential strength in holding the price from falling further.
The 1st resistance is located at 1.2448. This pullback resistance could potentially limit upward price action and may attract selling interest. Above that, the intermediate resistance level is at 1.2423. As pullback resistance, it could limit any bullish move.
Further above, the 2nd resistance is at 1.2503. This swing high resistance level might serve as a significant barrier to the price if it attempts to move upward.
In a bearish environment, these resistance levels might act as potential targets for short positions, while support levels might act as levels where the price could bounce or slow its bearish momentum.
USD/CHF:
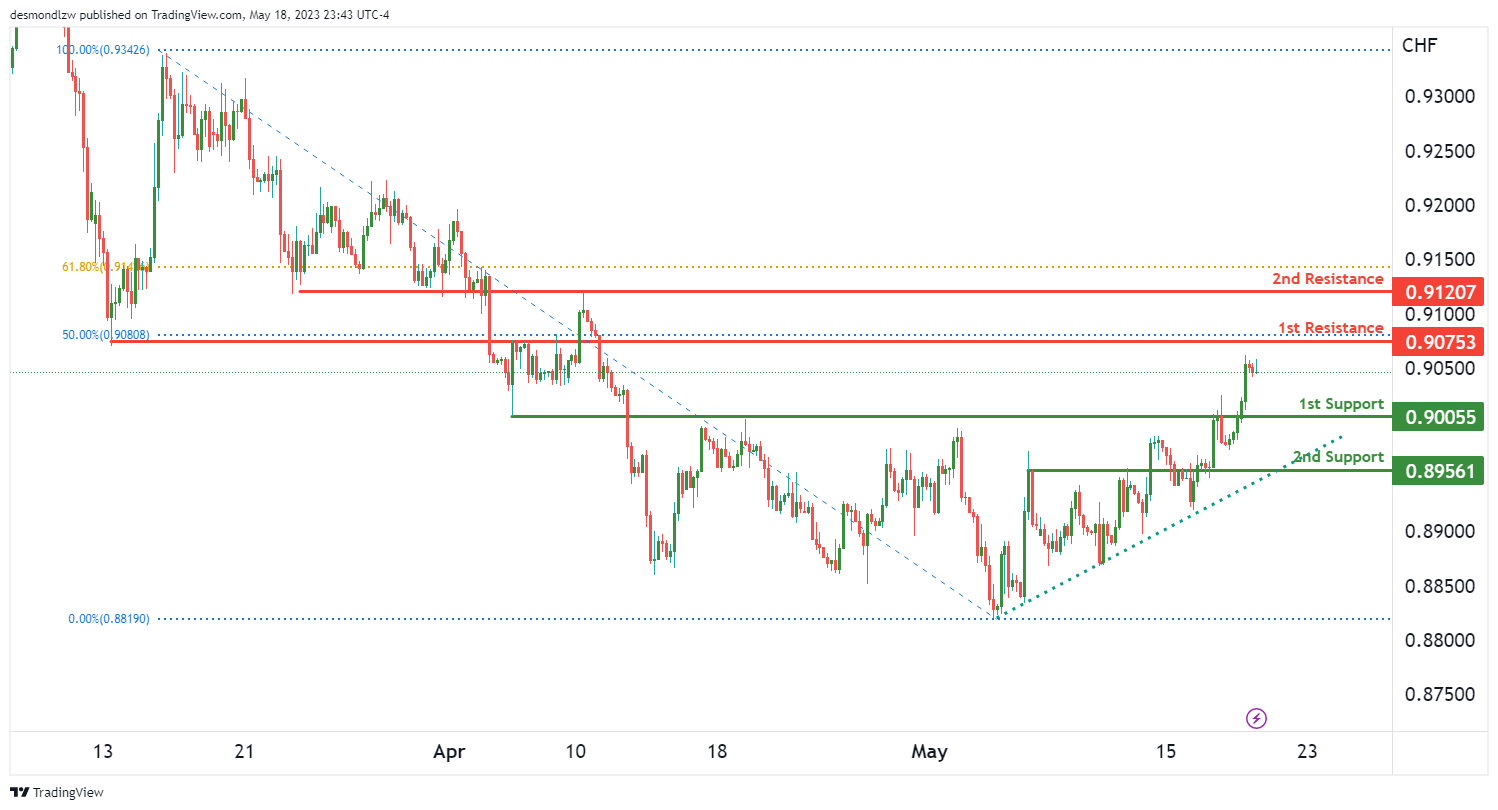
The USD/CHF pair, it becomes clear that the overall momentum of the chart is bullish. An important factor contributing to this momentum is the price’s position above a major ascending trend line. This indicates that further bullish momentum may be on the horizon.
Despite the overall bullish momentum, there’s potential for a short-term drop to the 1st support at 0.9005 before price makes a bounce back upwards. This support level is an overlap support, providing a solid base for a potential rebound.
However, should the price break below the 1st support, it might seek the next level of support at 0.8956. This level is also an overlap support, and could serve as a fallback for the price, providing additional support should the price continue its short-term decline.
Looking upwards, the first resistance to keep in mind is at 0.9075. This level serves as a pullback resistance and also aligns with a 50% Fibonacci retracement. Should the price bounce from the 1st support and rally upwards, this resistance level could pose a significant barrier.
If price successfully overcomes the 1st resistance, it could then aim for the 2nd resistance up at 0.9120. This level is not only an overlap resistance but also lines up with a 61.8% Fibonacci retracement, making it a significant barrier for the price
USD/JPY:
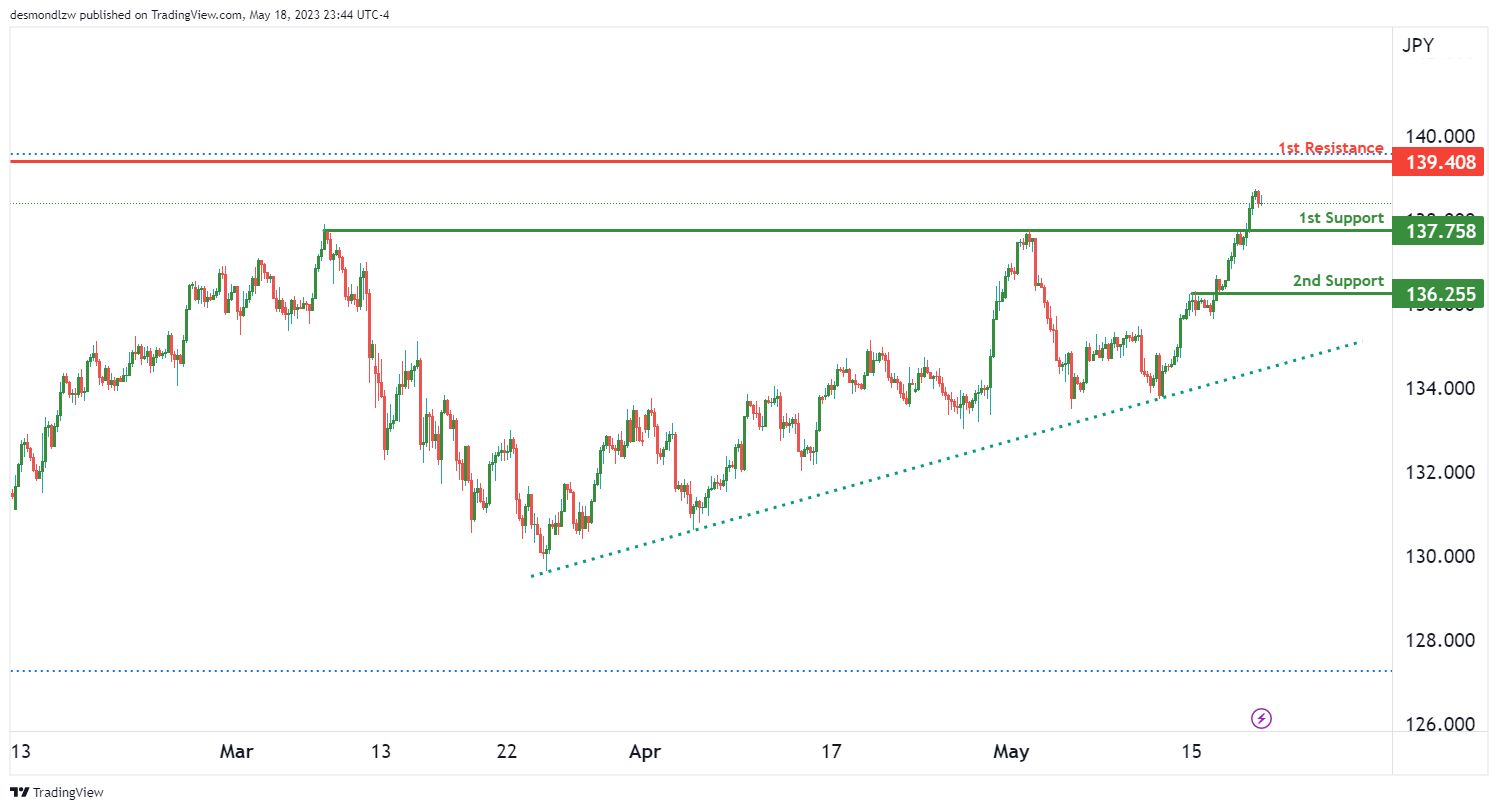
The USD/JPY pair clearly showcases a bullish overall momentum. One of the significant factors contributing to this momentum is the fact that the price is currently positioned above a major ascending trend line. This suggests that there may be more bullish momentum to come.
In terms of potential price movement, it seems possible that we may witness a bullish continuation towards the first resistance level.
Looking downwards, the first support level to keep an eye on is at 137.75. This level has been identified as a pullback support, suggesting it may hold strong against a potential price dip.
If, however, the price does descend further, the next significant support level would be at 136.25. This level is recognized as an overlap support and could provide an additional safety net should the price continue to fall.
On the flip side, if the price continues its upward trajectory, the first significant resistance to be mindful of is at 139.40. This level has been marked as a swing high resistance, indicating it may serve as a significant barrier to a continued rise in price.
In light of the current bullish momentum, traders may be anticipating a climb in price from the support level to the resistance level. As with any financial market analysis, however, these scenarios are based on current conditions and may change with the evolution of the market
AUD/USD:
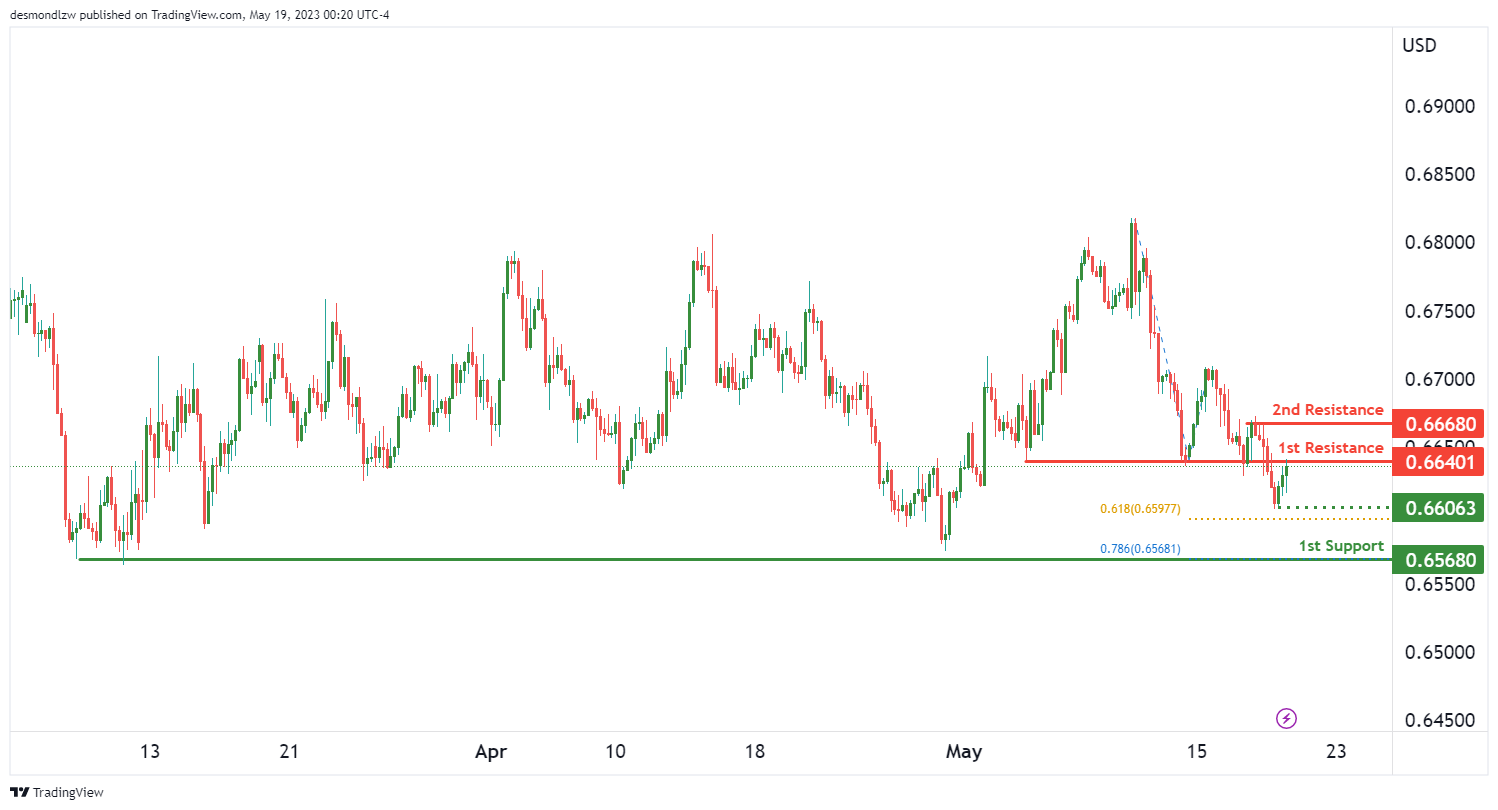
The AUD/USD pair has been exhibiting a distinct bearish momentum of late. Based on the chart analysis, we anticipate the possibility of a bearish reaction off the 1st resistance, leading to a drop down to the 1st support level.
Looking downwards, the first level of support to watch is 0.6568. This level has proven to be a multi-swing low support, adding to its credibility. Further enhancing its significance, it aligns with a 61.8% Fibonacci projection.
In the event of a steeper descent, we can look towards an intermediate support at 0.6606. This level, marked as a swing low support, aligns with a 78.6% Fibonacci projection, adding further weight to its potential role in offering price support.
Conversely, if the price was to rebound upwards, we have marked the first resistance at 0.6640. This level has acted as an overlap support in the past, indicating it could now offer resistance to a rising price.
Should the price manage to surpass the 1st resistance, the next challenge would come at the 2nd resistance level of 0.6668. This level is a multi-swing high resistance and is anticipated to offer a substantial barrier to further price increases.
NZD/USD
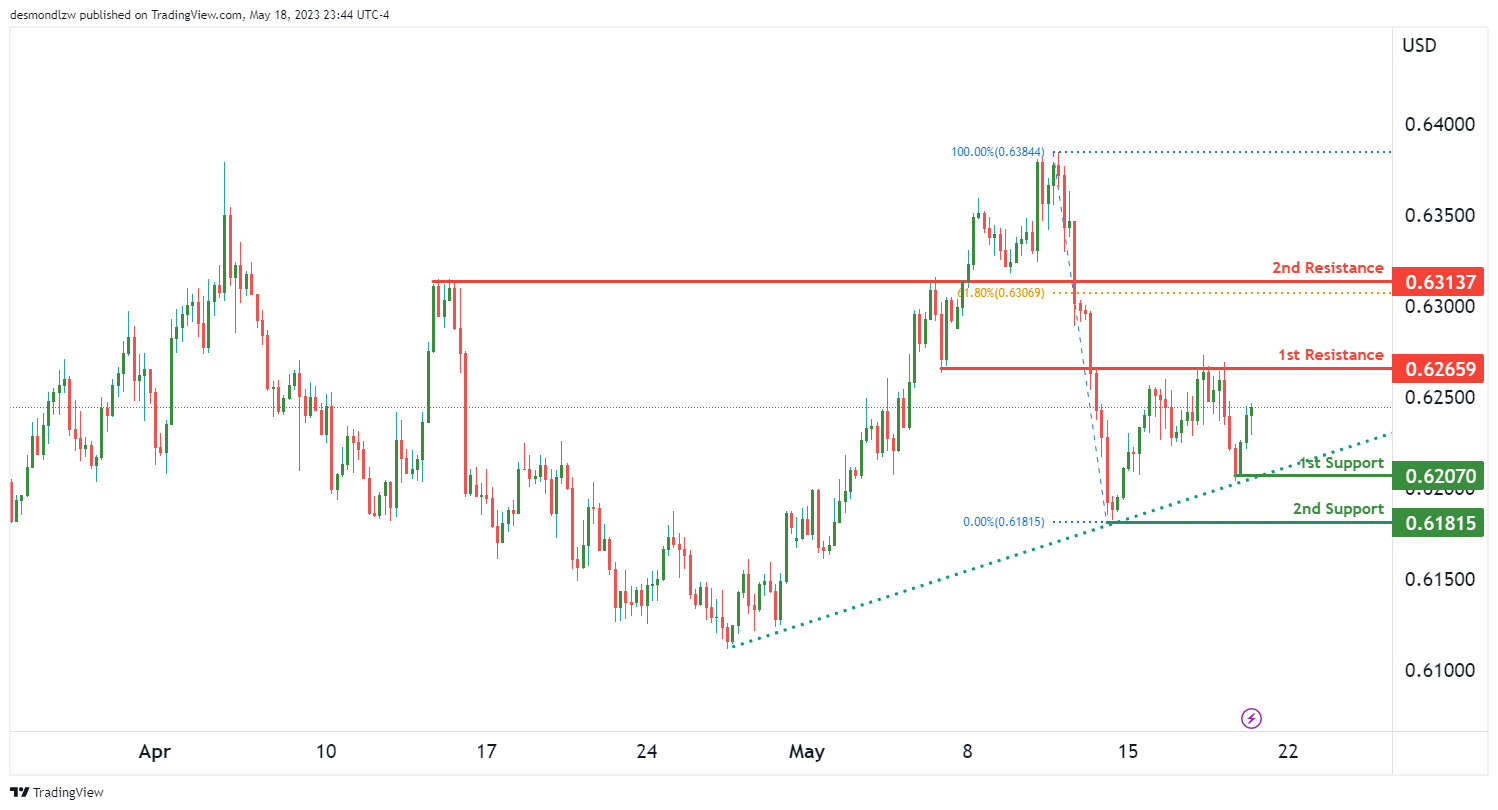
The NZD/USD pair is currently displaying a bullish momentum on the chart. This momentum is largely due to the price positioning itself above a major ascending trend line, which suggests the potential for further bullish momentum.
In the foreseeable future, there could potentially be a bullish continuation towards the 1st resistance level.
In terms of downward possibilities, the 1st support level lies at 0.6207. This point has been identified as a swing low support, and could provide a solid base should there be a temporary downturn in the upward trend.
Should the price fall below the 1st support, it could seek solace at the 2nd support level of 0.6181. This level, recognized as a swing low support, could serve as a safety net for further price drops.
On the upside, the 1st resistance stands at 0.6265. This level, noted as an overlap resistance, could potentially limit upward movement in price.
If the price manages to break through the 1st resistance, the next significant level would be the 2nd resistance at 0.6313. Not only does this level serve as a pullback resistance, it also lines up with a 61.8% Fibonacci retracement, giving it added importance.
USD/CAD:
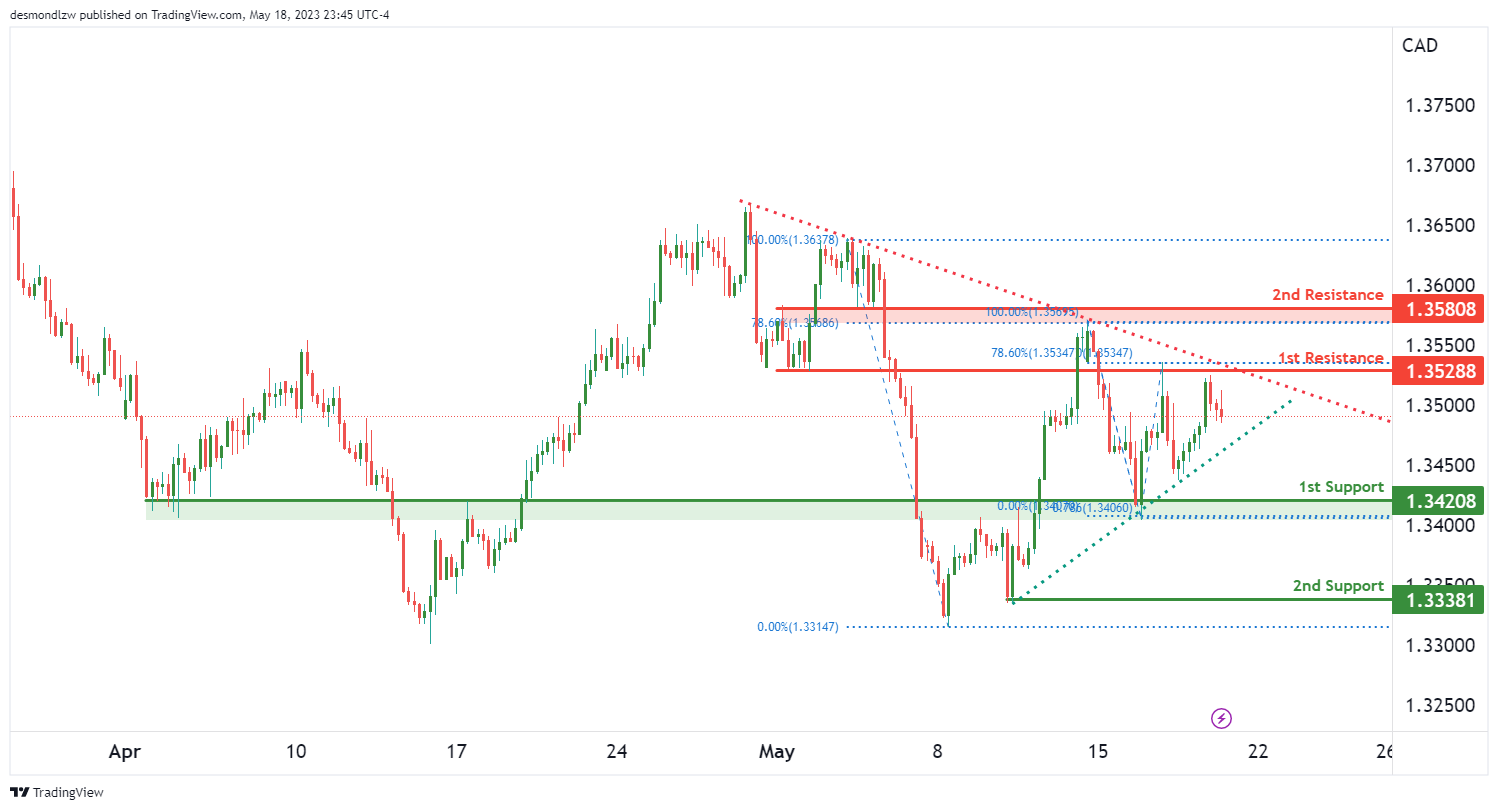
Currently, the USD/CAD pair is exhibiting a bearish momentum on the chart. In light of this, we could potentially expect a bearish continuation towards the 1st support level.
Examining the lower side, the 1st support is positioned at 1.3420. This point has been identified as an overlap support, a factor that could bolster its ability to curb a downward price movement.
Should the price slide beyond the 1st support, it could find a footing at the 2nd support level of 1.3338. Recognized as a swing low support, this level could serve as a safety net for further price descents.
Contrarily, if the price were to rally, the 1st resistance level stands at 1.3528. Not only does this level present as an overlap resistance, it also aligns with a 78.6% Fibonacci retracement, enhancing its potential to limit an upward price push.
If the price manages to break through the 1st resistance, the subsequent challenge would come at the 2nd resistance level of 1.3580. This level, also an overlap resistance, coincides with a 78.6% Fibonacci retracement, reinforcing its possible role as a barrier to further price ascents.
An additional feature of note in the chart is a symmetrical triangle pattern. This pattern represents a period of consolidation before the price is forced to breakout or breakdown. A break above the upper trendline of the pattern could signal a bullish breakout, while a break below the lower trendline might indicate a bearish breakdown.
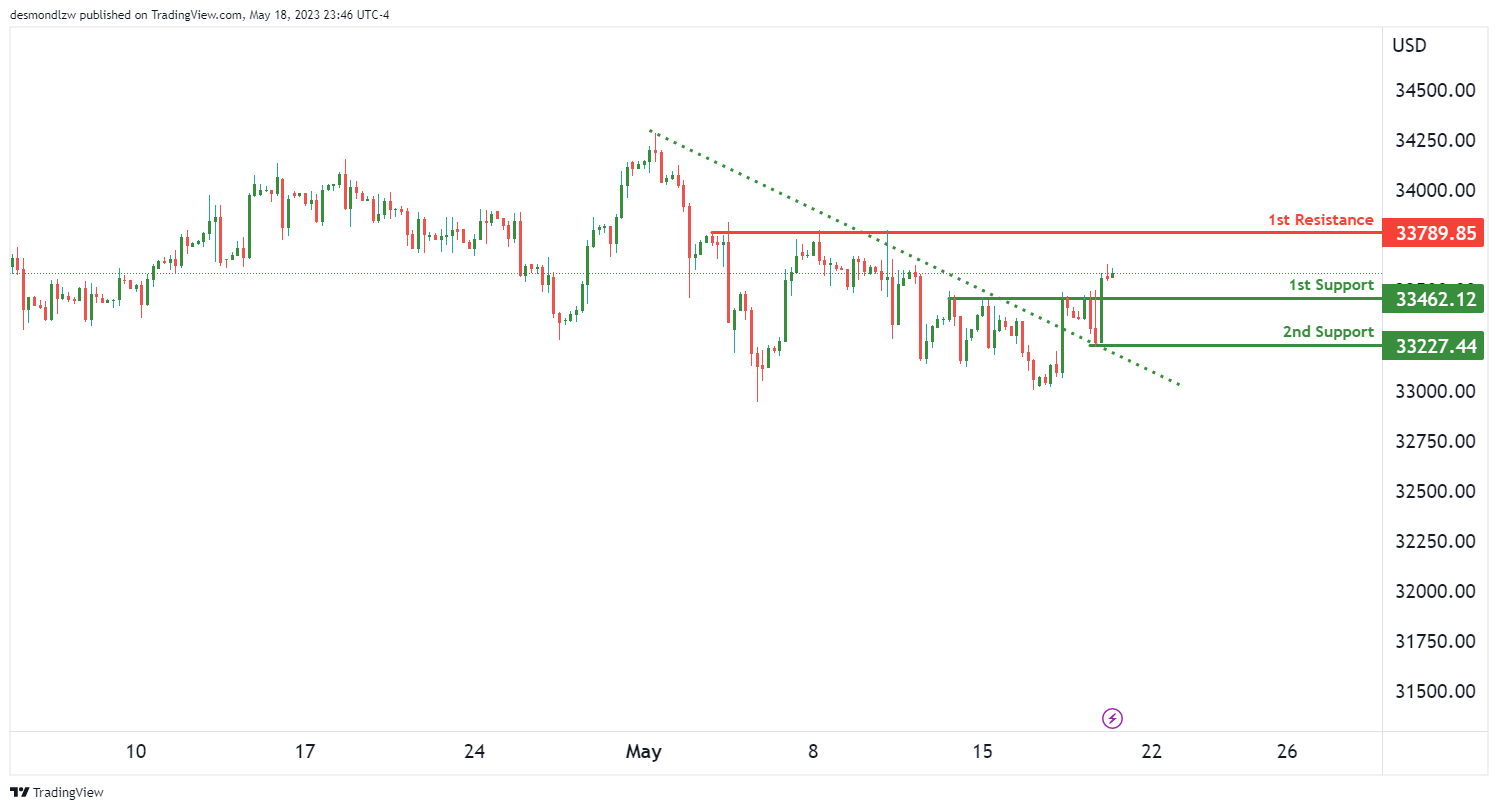
DJ30:
The DJ30 index chart is presently exhibiting a bullish momentum. A significant factor contributing to this momentum is that the price has broken above a descending resistance line, triggering a potential bullish move.
Given the current momentum, we could potentially anticipate a bullish continuation towards the 1st resistance level.
On the lower side, the 1st support is positioned at 33462.12. Identified as a pullback support, this level could offer a strong base, aiding in slowing down any potential downward reversals.
Should the price fall below the 1st support, it could find a footing at the 2nd support level of 33227.44. Recognized as a swing low support, this level might act as an additional buffer against further price declines.
On the flip side, if the price continues its upward trajectory, it will encounter the 1st resistance at 33789.85. This level serves as a multi-swing high resistance, suggesting its potential to limit upward price movements.
Given the prevailing bullish momentum, traders could expect an upward movement from support to resistance. However, these are potential scenarios, not guarantees. As always, traders are advised to keep a close eye on these crucial levels and adjust their trading strategies accordingly.
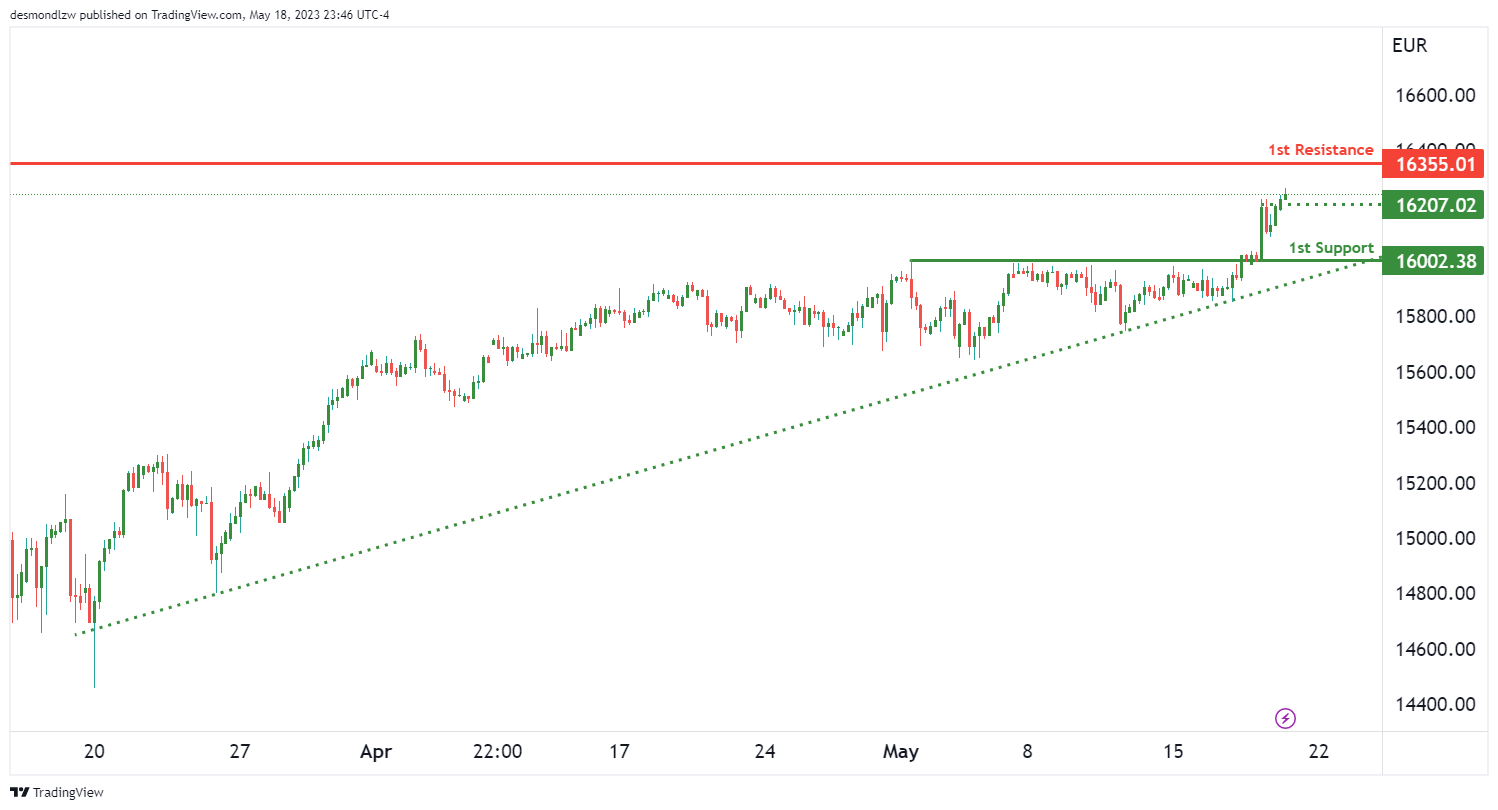
GER30:
Currently, the GER30 index chart is demonstrating a bullish momentum. A significant contributing factor is that the price remains above a major ascending trend line, suggesting potential for additional bullish momentum in the future.
If this trend continues, we might anticipate a bullish continuation towards the 1st resistance level.
On the downside, the 1st support level is situated at 16002.38. Recognized as a pullback support, it could provide a robust cushion to mitigate any potential downward retracements.
An intermediate support is located at 16207.02. This level, also identified as a pullback support, might offer an additional layer of protection against potential price dips.
On the upward trajectory, the 1st resistance is positioned at 16355.01. This level, a multi-swing high resistance, could potentially limit further price ascensions.
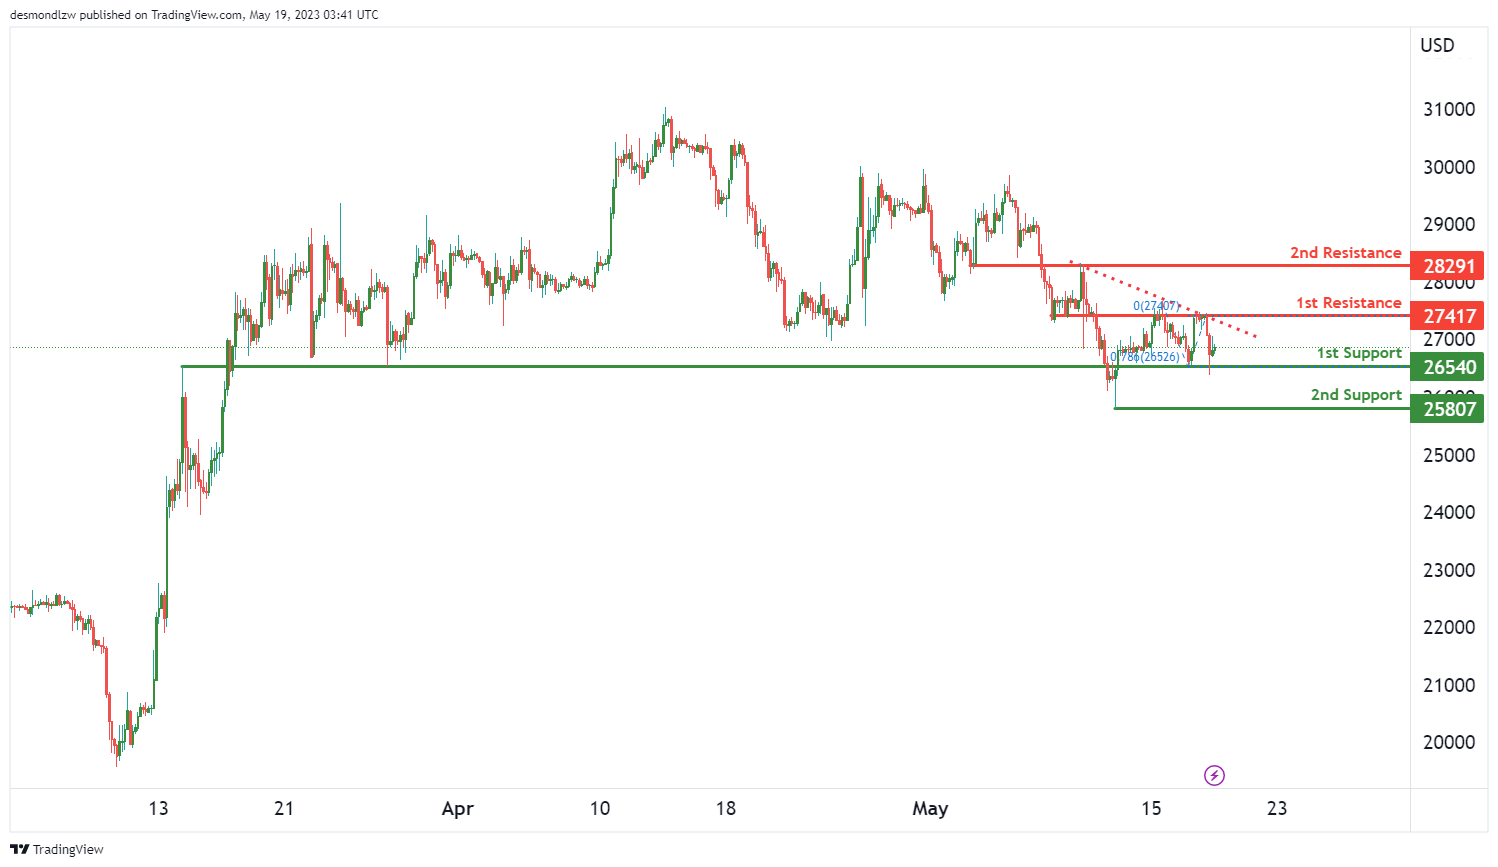
BTC/USD:
The current BTC/USD chart is signalling a bearish momentum. The key factor contributing to this is that the price lies below a major descending trend line, suggesting a bearish continuation is on the horizon.
If this trend persists, we might anticipate a bearish reaction off the 1st resistance, which could potentially push the price down to the 1st support level.
The 1st support level is found at 26540. This level, recognised as an overlap support, might serve as a solid platform to mitigate any potential bearish retracements.
Further down, the 2nd support level is identified at 25807. As a swing low support, it could provide an additional cushion against potential price drops.
On the upside, the 1st resistance is set at 27417. This overlap resistance could possibly curb further price increases.
Further up, the 2nd resistance level is at 28291. This level, also an overlap resistance, might offer additional resistance to any bullish movements.
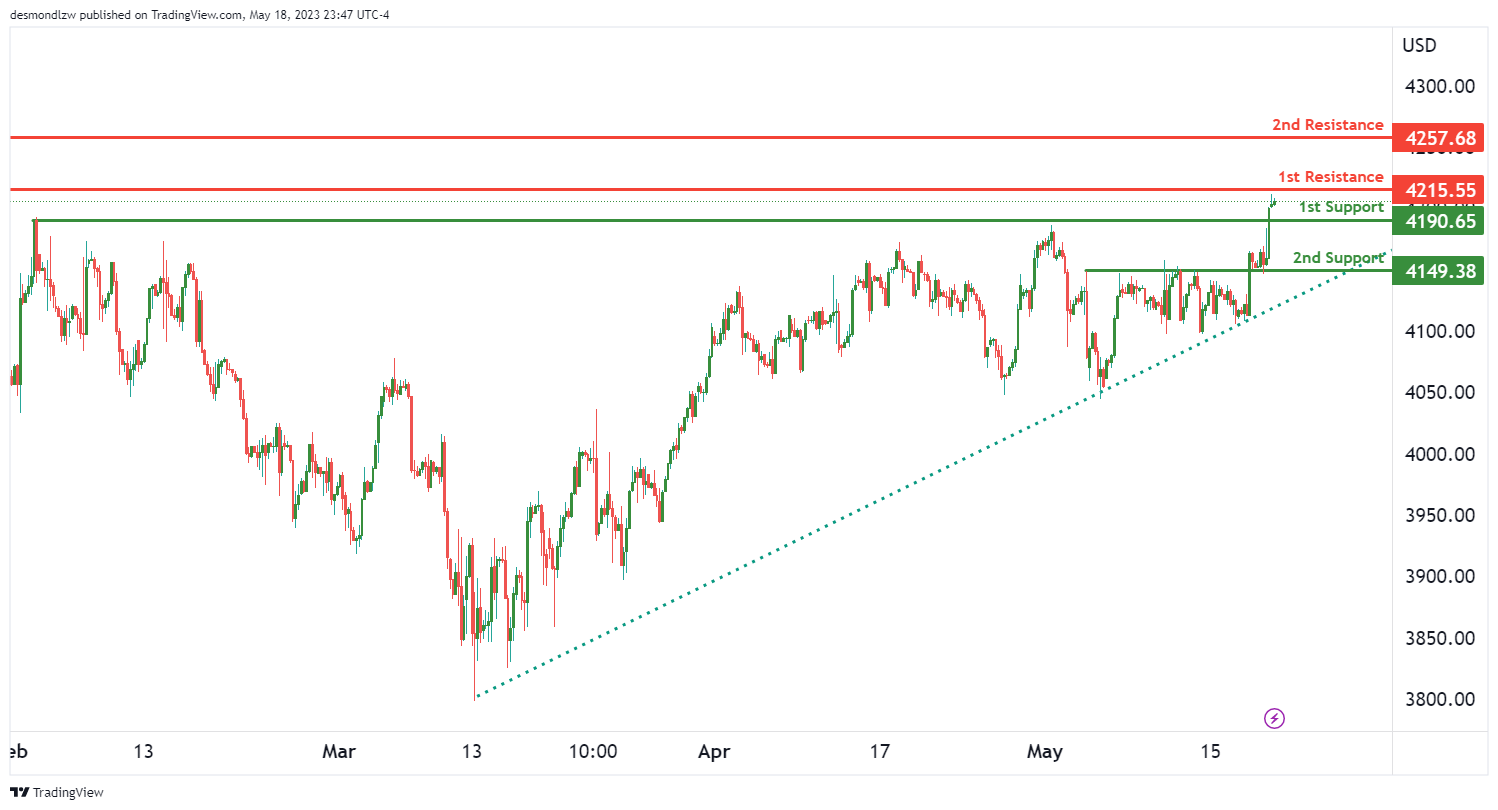
US500
The US500 chart, a bullish momentum can be discerned. The primary factor feeding this momentum is the price position above a major ascending trend line, indicating potential continuation of this bullish trend.
In the short term, the price could potentially drop further to the 1st support level before experiencing a bounce back, leading to a rise towards the 1st resistance level.
The 1st support level is currently at 26540. This level acts as a pullback support, serving as a reliable platform to absorb potential bearish retracements.
Further below, the 2nd support level stands at 4149, identified as an overlap support. This could provide an additional buffer against potential price decreases.
On the upside, the 1st resistance is found at 4126. This swing high resistance could act as a cap to further bullish advancements.
Moreover, the 2nd resistance level is set at 4258, also a swing high resistance, potentially offering additional resistance against bullish movements.
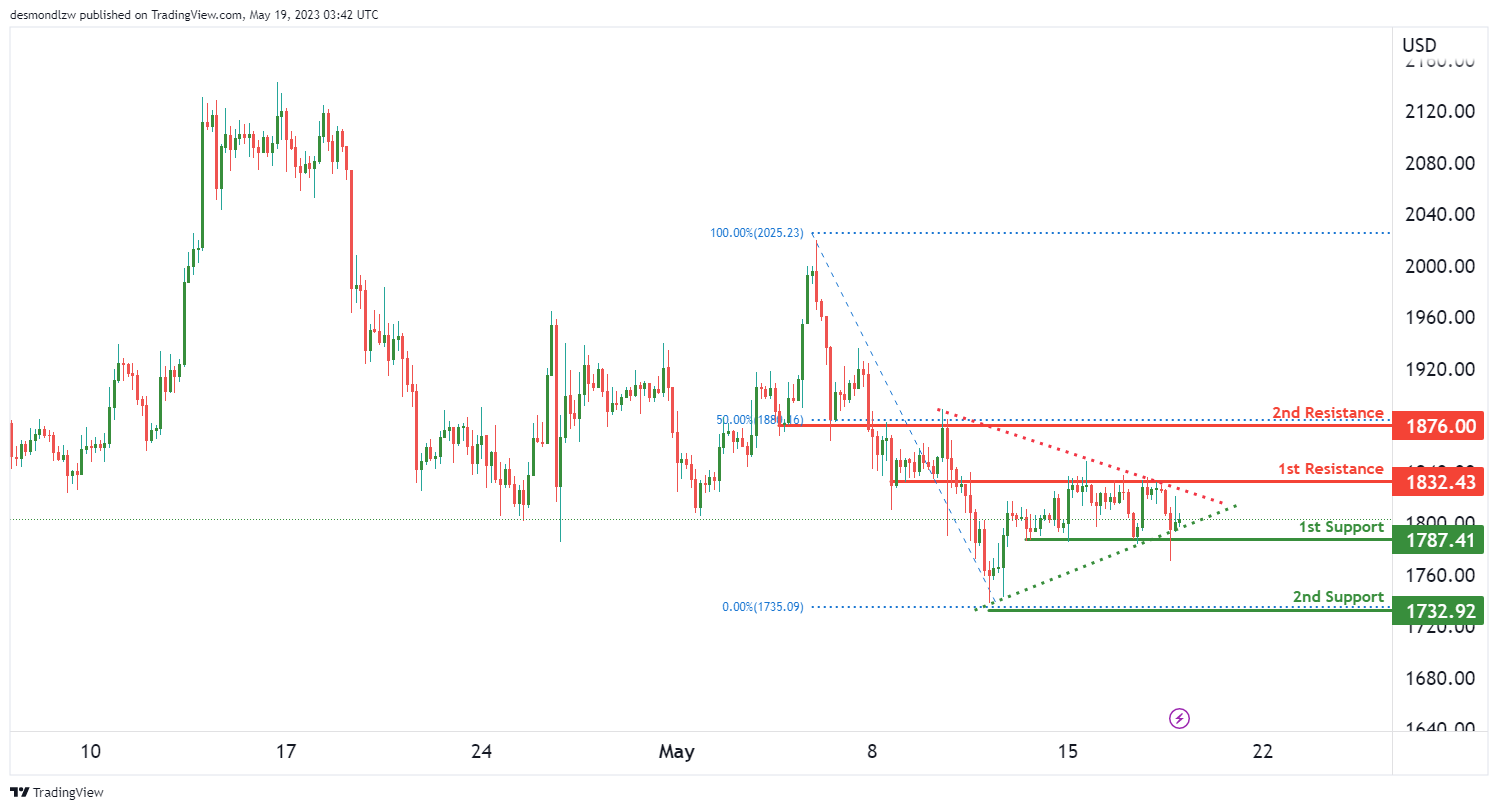
ETH/USD:
The ETH/USD chart, we’re currently witnessing a neutral trend. The price has been oscillating without a clear direction and could potentially fluctuate between the 1st resistance and 1st support level, indicating a period of indecision in the market.
The 1st support level is marked at 1787.41, serving as a multi-swing low support, which means it has been tested multiple times, enhancing its reliability as a robust buffer against bearish movements.
Below this, the 2nd support level at 1732.92 acts as an overlap support. It is another essential level that could prevent further price declines.
On the flip side, the 1st resistance level is situated at 1832.43. This overlap resistance could provide a ceiling to any immediate bullish surge.
The 2nd resistance level is slightly higher, at 1876.00. It’s noteworthy because it’s an overlap resistance as well as a 50% Fibonacci retracement level, indicating a potential area where the price might face difficulty in breaking through.
Interestingly, the price action is currently forming a symmetrical triangle chart pattern, often associated with a period of consolidation before a breakout or breakdown occurs. This pattern could lead to a bullish breakout if the price breaks above the upper trendline, or a bearish breakdown if the price dips below the lower trendline.
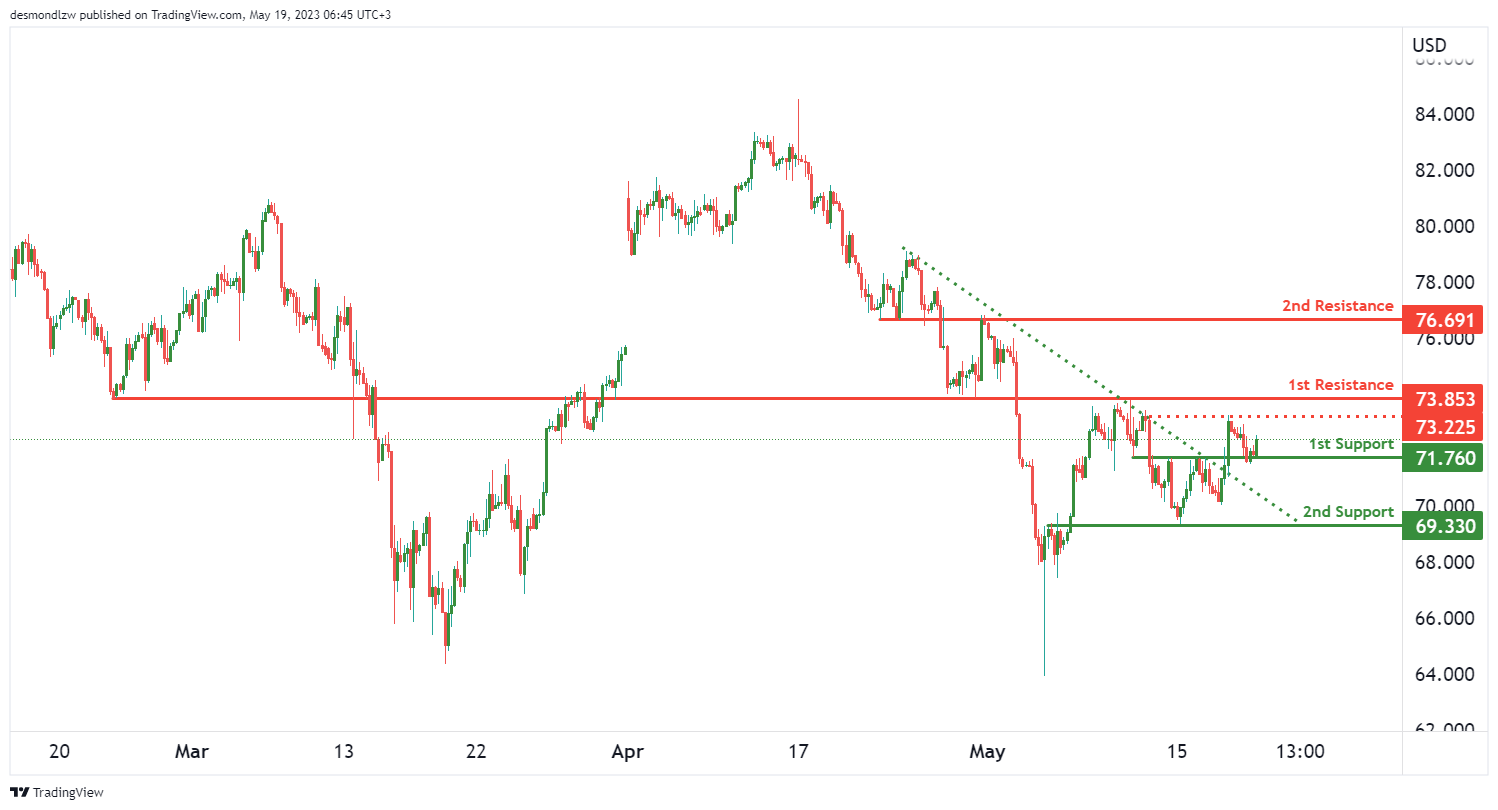
WTI/USD:
The WTI chart, we observe a bullish momentum. A key factor contributing to this positive trend is the price’s break above a descending resistance line, triggering a potential bullish move.
The current situation suggests that there could potentially be a bullish continuation towards the 1st resistance.
The 1st support level is established at 71.76, which is considered an overlap support. This level represents a price at which the market has previously shown significant buying interest, and it may serve as a critical barrier against a downward price movement.
Further down, we have the 2nd support level at 69.33, another overlap support. This level marks a further zone where buyers might show up in force to prevent a deeper price decline.
On the resistance side, the 1st resistance level is set at 73.85. This overlap resistance could potentially slow down or halt any immediate bullish advances.
Higher still, we have the 2nd resistance level at 76.69. This level is also an overlap resistance and could serve as an obstacle to further bullish momentum.
In between the two primary resistance levels, we find the intermediate resistance at 73.22. This multi-swing high resistance could provide some temporary resistance to the price during its upward journey.
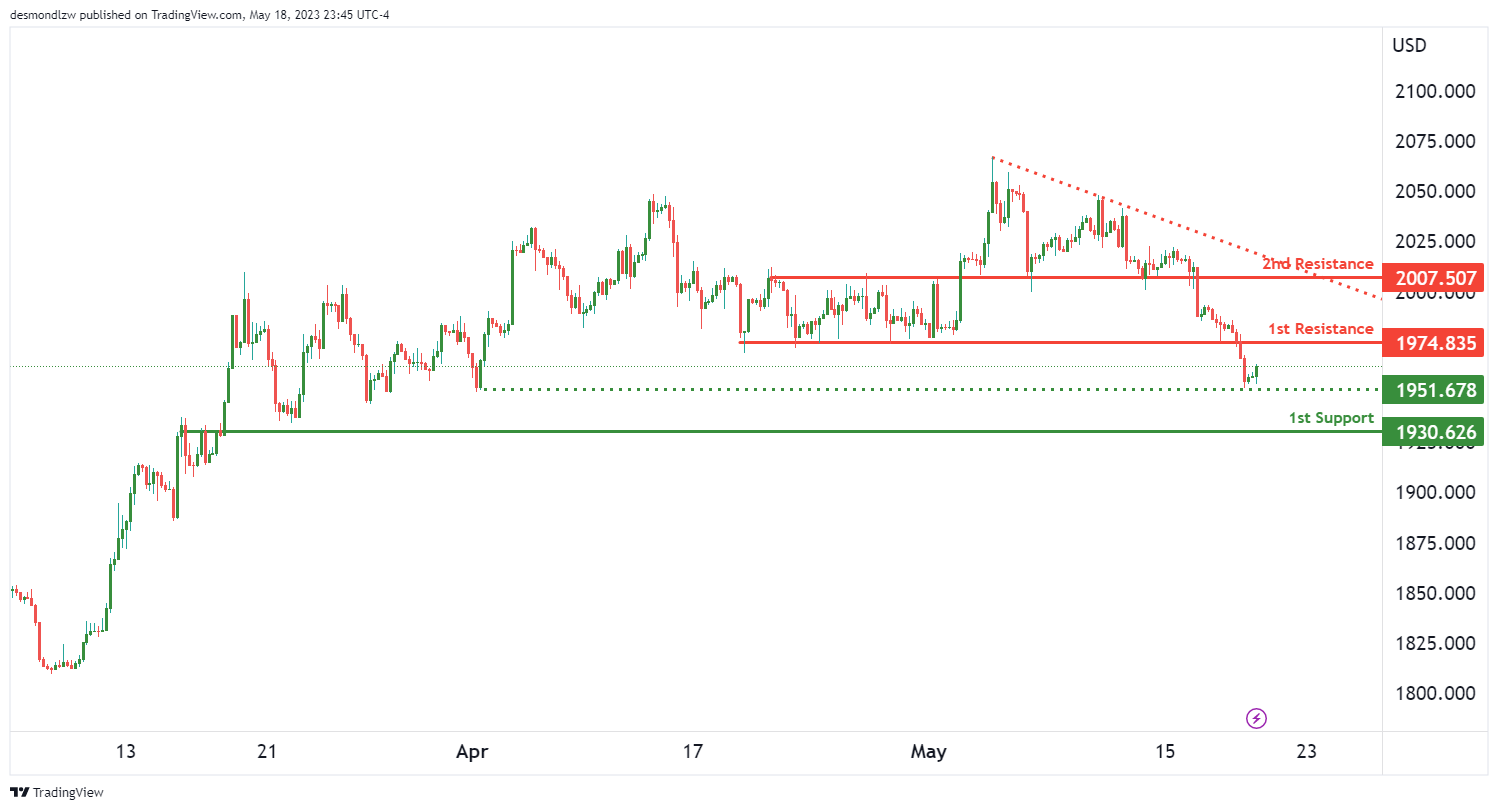
XAU/USD (GOLD):
The XAU/USD chart indicates a bearish momentum. The price positioning below a major descending trend line suggests that bearish momentum is in play and could potentially lead to further decline.
Under this bearish outlook, we could witness a bearish reaction off the 1st resistance level, causing the price to drop to the 1st support level.
The 1st support level is found at 1930.62, classified as an overlap support. This level is significant as it has previously shown a substantial buyer response that could potentially halt or slow down any further downward momentum.
Above this, there’s the intermediate support level at 1951.67, distinguished as a multi-swing low support. This level could serve as a temporary halt to a potential decline, possibly attracting buying interest.
In terms of resistance, the 1st resistance level is at 1974.83, which is considered a pullback resistance. This level represents a barrier that the price may struggle to surpass in its current trajectory.
Higher up, we find the 2nd resistance level at 2007.50, also viewed as a pullback resistance. This level could provide further hindrance to any possible short-term bullish attempts.


