
EUR/USD started a fresh increase above the 1.0740 resistance. USD/JPY is consolidating and facing hurdles near the 140.45 level.
Important Takeaways for EUR/USD and USD/JPY Analysis Today
- The Euro is rising and trading well above the 1.0740 resistance zone.
- There is a key bullish trend line forming with support near 1.0785 on the hourly chart of EUR/USD at FXOpen.
- USD/JPY is trading in a positive zone above the 139.65 and 139.15 levels.
- There was a break above a bearish trend line with resistance near 139.65 on the hourly chart at FXOpen.
EUR/USD Technical Analysis
On the hourly chart of EUR/USD at FXOpen, the pair started a fresh increase from the 1.0670 zone. The Euro climbed above the 1.0710 resistance zone against the US Dollar.
The pair even settled above the 1.0740 resistance and the 50-hour simple moving average. Finally, the bears appeared near the 1.0820 zone. A high is formed near 1.0818 and the pair is now consolidating gains.
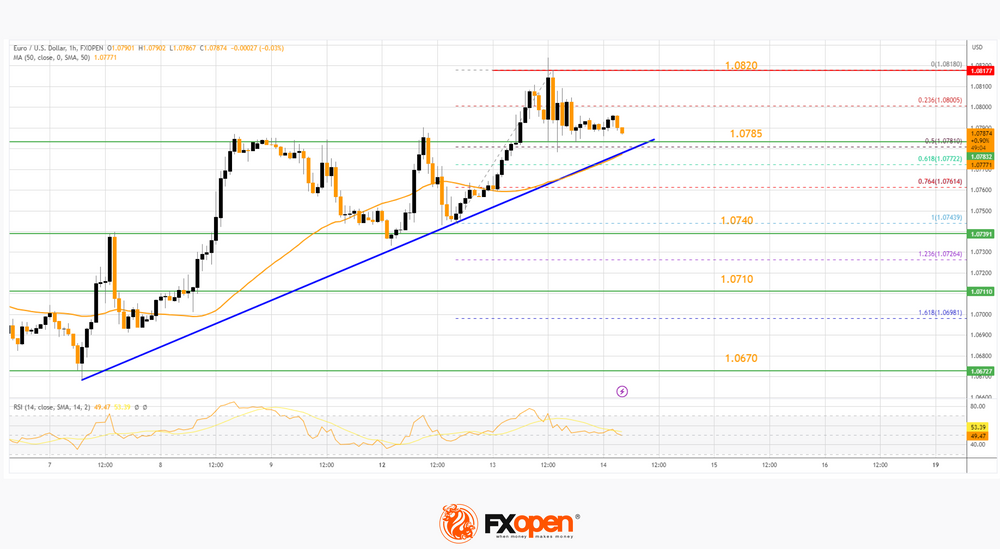
It traded below the 23.6% Fib retracement level of the upward move from the 1.0743 low to the 1.0818 high. The first major support is near a key bullish trend line at 1.0785 and the 50-hour simple moving average.
The trend line is close to the 50% Fib retracement level of the upward move from the 1.0743 low to the 1.0818 high. If there is a downside break below 1.0785, the pair could drop toward the 1.0740 support. The next major support on the EUR/USD chart is near 1.0710, below which the pair could start a major decline.
On the upside, the pair is now facing resistance near 1.0820. The next major resistance is near the 1.0850 level. An upside break above 1.0850 could set the pace for another increase. In the stated case, the pair might visit 1.0920.
USD/JPY Technical Analysis
On the hourly chart of USD/JPY at FXOpen, the pair started a fresh increase from the 139.00 zone. It gained bullish momentum and was able to clear the 139.50 resistance.
There was also a break above a bearish trend line with resistance near 139.65 and the 50-hour simple moving average. However, the bears are active near the 140.25 resistance zone. A high was formed near 140.30 before the pair corrected lower.
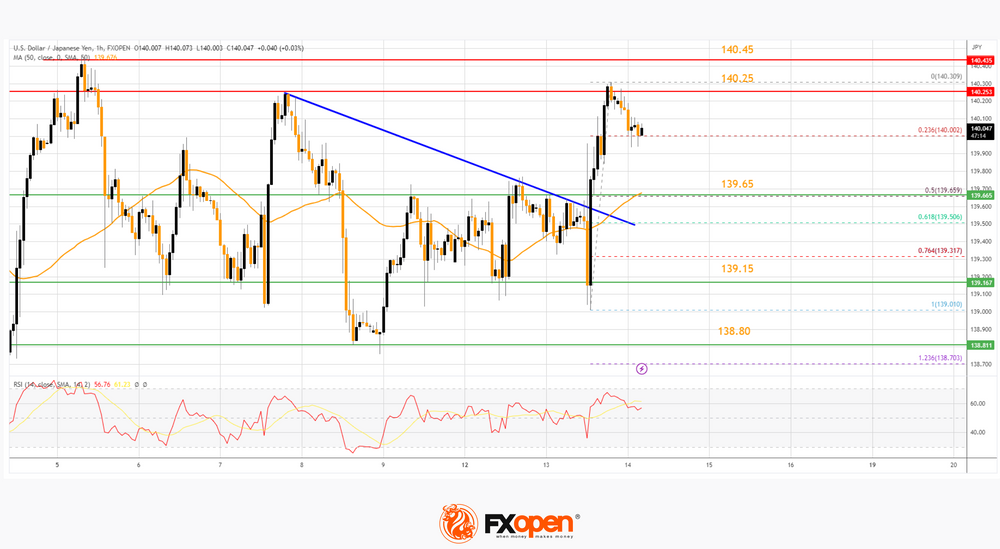
The pair is now trading near the 23.6% Fib retracement level of the upward move from the 139.01 swing low to the 140.30 high.
The first major support on the USD/JPY chart is near the 50-hour simple moving average at 139.65. It is close to the 50% Fib retracement level of the upward move from the 139.01 swing low to the 140.30 high. The next major support is near the 139.15 level, below which the pair could decline steadily. In the stated case, the pair might dive toward the 138.8 support.
On the upside, the pair is facing resistance near the 140.25 level. The first major resistance is near the 140.45 level. If there is a close above the 140.45 level and RSI moves above 65, the pair could rise toward 141.20. The next major resistance is near 141.50, above which the pair could test 142.00.


