
- EUR/GBP has continued to trade lower, now at 0.8520, its lowest level since Aug 2022 ahead of UK inflation data (Wed,21 Jun) & BoE monetary policy decision (Thurs, 22 Jun).
- Short-term downtrend for EUR/GBP remains intact since the 26 Apr high of 0.8875.
- Key short-term resistance to watch will be at 0.8580 to maintain bearish momentum.
Last week, the EUR/GBP cross rate recorded its third consecutive weekly loss and traded below its former medium-term range support of 0.8580 (swing low areas of October/December 2022) which was broken down in the week of 5 June 2023. At this time of writing, the EUR/GBP has continued to trade on a bearish bias at 0.8520, its lowest level since August 2022.
From a news flow/economic data and events standpoint, we have two key data/events this week for the UK; the inflation data for May out on Wednesday, 21 June, and the Bank of England’s (BoE)’s monetary policy decision on Thursday, 22 June.
The expectation of further rate hikes from BoE is being priced in the interest rate futures market where participants expect a 25 basis points (bps) hike this Thursday to bring the policy bank rate to 4.75%, follow by a potential series of five further rate hikes next of 25 bps each to reach a terminal rate of 6%. That’s a more hawkish stance than ECB if such a trajectory of hikes from the BoE turns out as expected.
Fig 1: EUR/GBP long-term & major trends as of 19 Jun 2023 (Source: TradingView, click to enlarge chart)
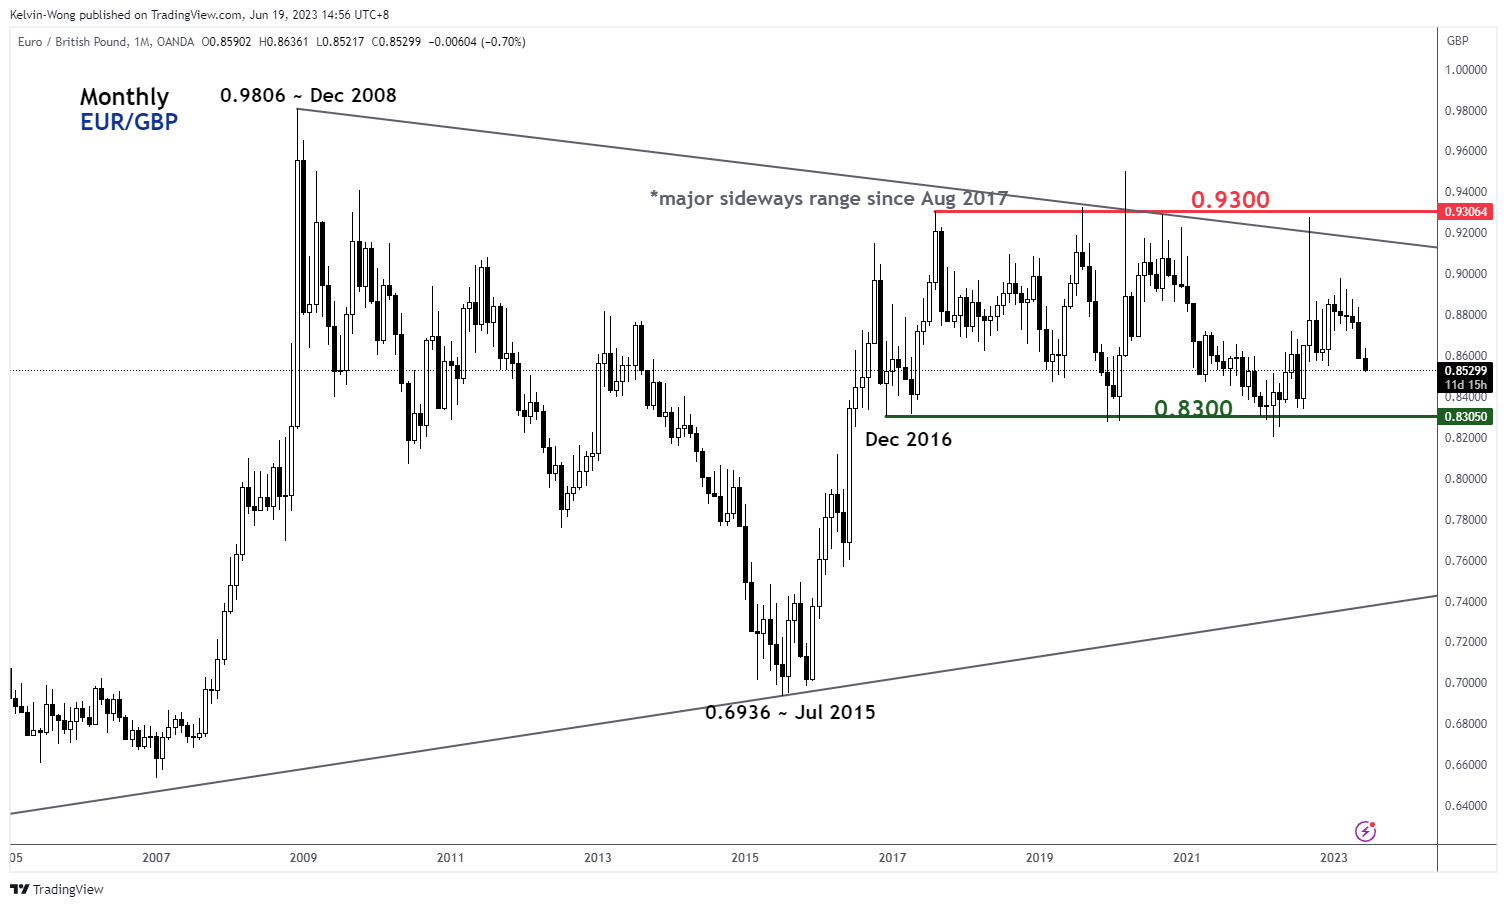
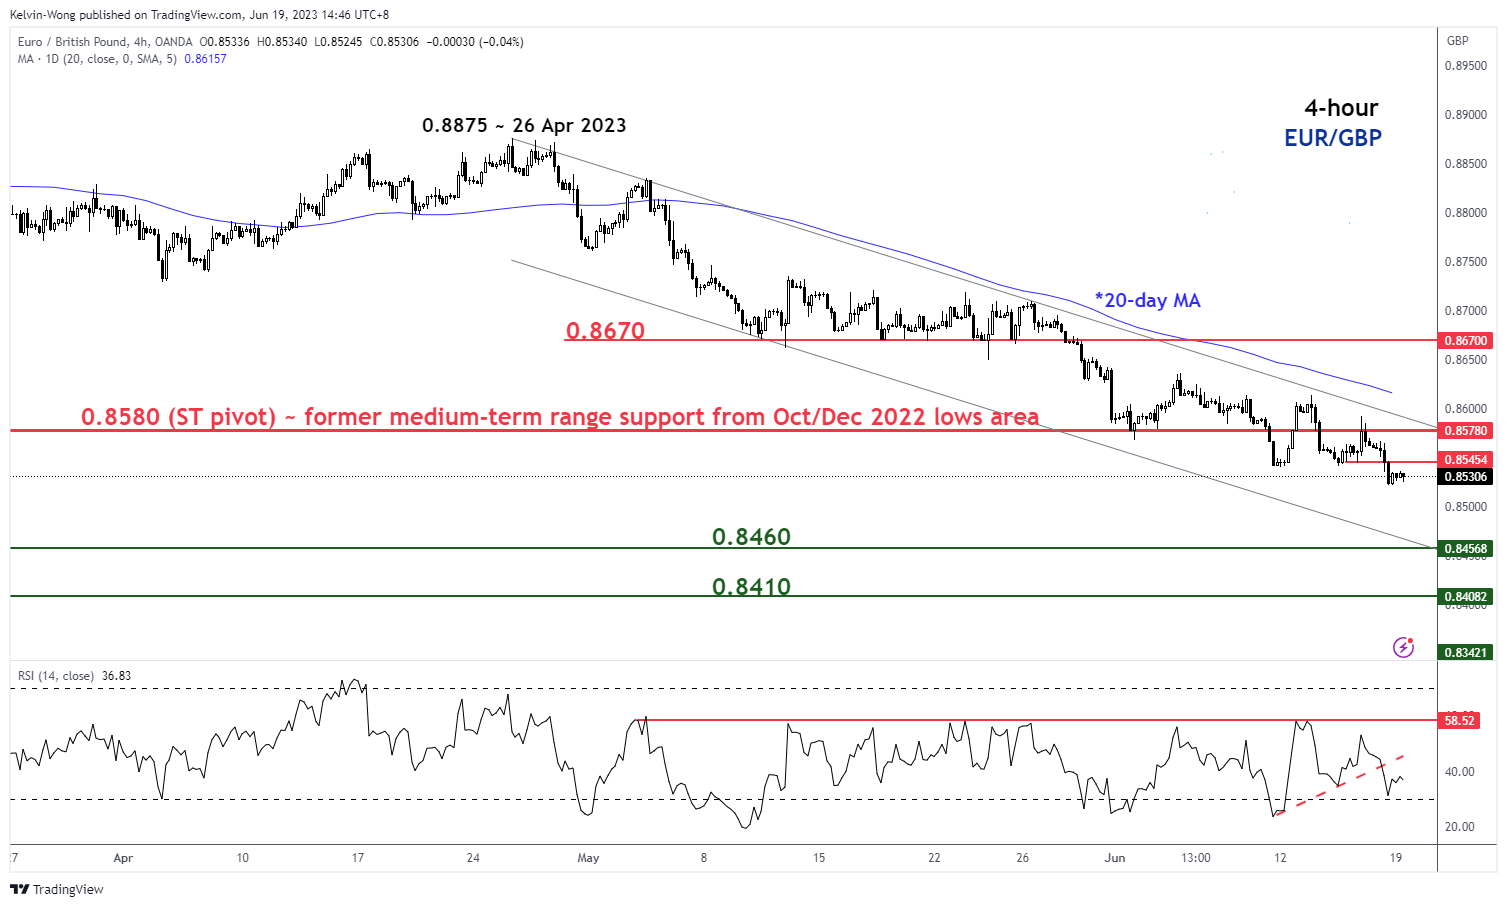
Fig 2: EUR/GBP minor short-term trend as of 19 Jun 2023 (Source: TradingView, click to enlarge chart)
The long-term secular trend remains sideways
Since Aug 2017 major swing high, the EUR/GBP is trapped within a major sideway range configuration with its key resistance and support at 0.9300 and 0.8300 respectively (see monthly chart).
The short-term downtrend remains intact
Price actions of the EUR/GBP have continued to evolve with a short-term descending channel in place since its 26 April 2023 high of 0.8875 as well as remained below its downward sloping 20-day moving average since 3 May 2023 (see 4-hour chart).
Momentum remains bearish in the short-term
The 4-hour RSI oscillator has broken below its corresponding ascending support at the 41% level last Friday, 16 June, and has yet to reach an extremely oversold level of 23.90% that was last seen on 1 May 2023.
Key short-term pivotal resistance will be at 0.8580 which is also defined by the upper boundary of the short-term descending channel with near-term supports coming in at 0.8460 and 0.8410 (24 August 2022 low, lower boundary of the short-term descending channel & a Fibonacci retracement/extension cluster).
On the flip side, a clearance above 0.8580 damages the short-term downtrend to expose the next resistance at 0.8670 (former minor range support of 10 May/25 May 2023).


 which was broken down in the week of 5 June 2023. At this time of writing, the EUR/GBP has continued to trade on a bearish bias at 0.8520, its lowest level since August 2022.)