
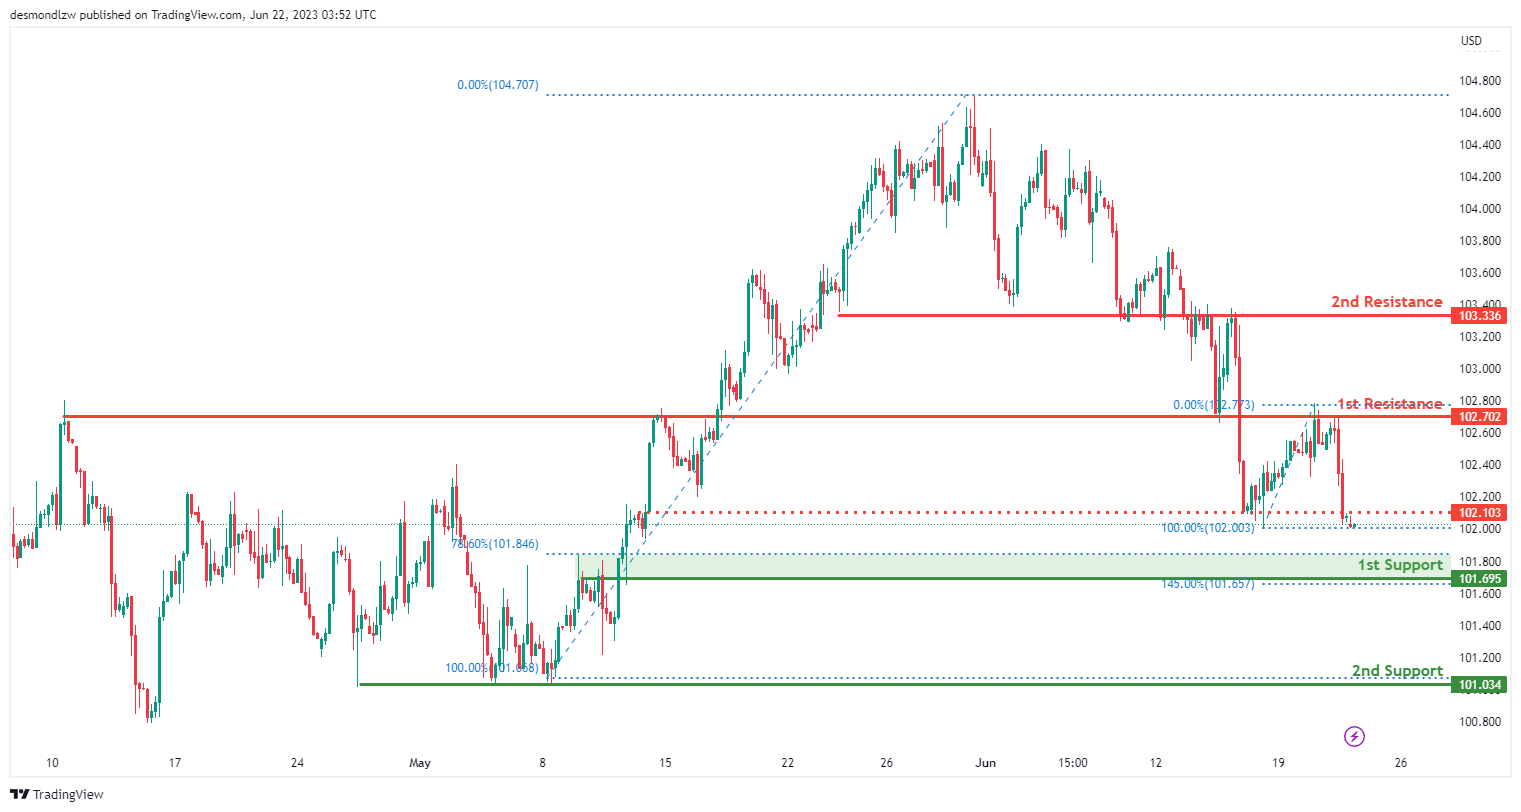
DXY:
The DXY chart exhibits a bearish momentum, indicating a downward trend in the market. There is a possibility of a bearish continuation towards the first support level at 101.69, which is a significant overlap support and aligns with the 145.00% Fibonacci Extension. Additionally, the second support level at 101.03 serves as a multi-swing low support. On the upside, the first resistance at 102.70 represents an overlap resistance, while the second resistance at 103.33 is identified as another overlap resistance. Furthermore, an intermediate resistance at 102.10 is recognized as a pullback resistance.
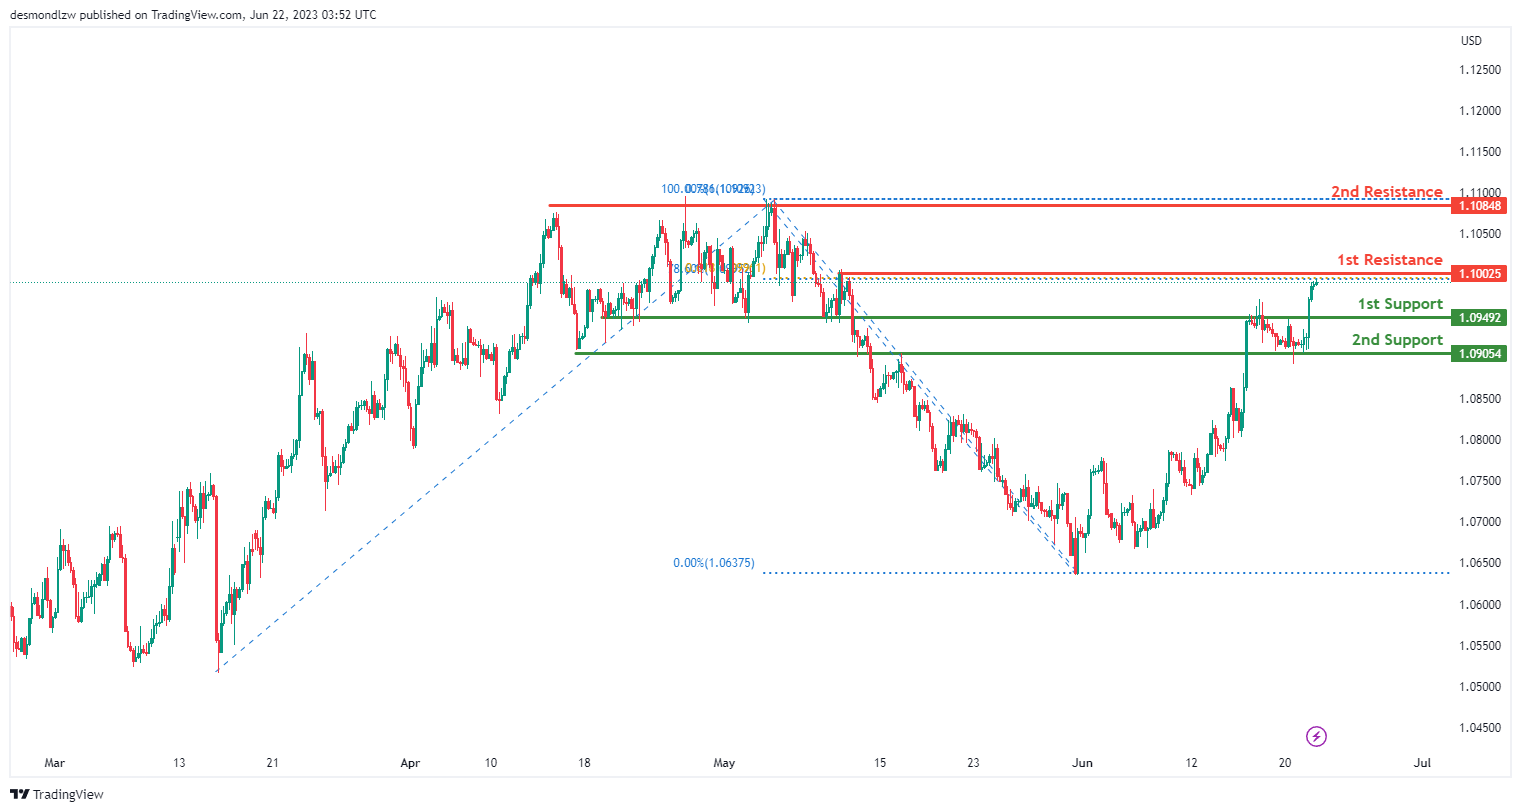
EUR/USD:
The EUR/USD chart demonstrates a bullish momentum, indicating an upward trend in the market. There is a potential for a short-term drop towards the first support level at 1.0949, which serves as a pullback support. Additionally, the second support level at 1.0905 is identified as an overlap support, coinciding with the 61.80% Fibonacci Projection and the 78.60% Fibonacci Retracement (Fibonacci confluence).
On the upside, the first resistance level at 1.1002 represents a swing high resistance, while the second resistance level at 1.1084 is identified as a multi-swing high resistance.
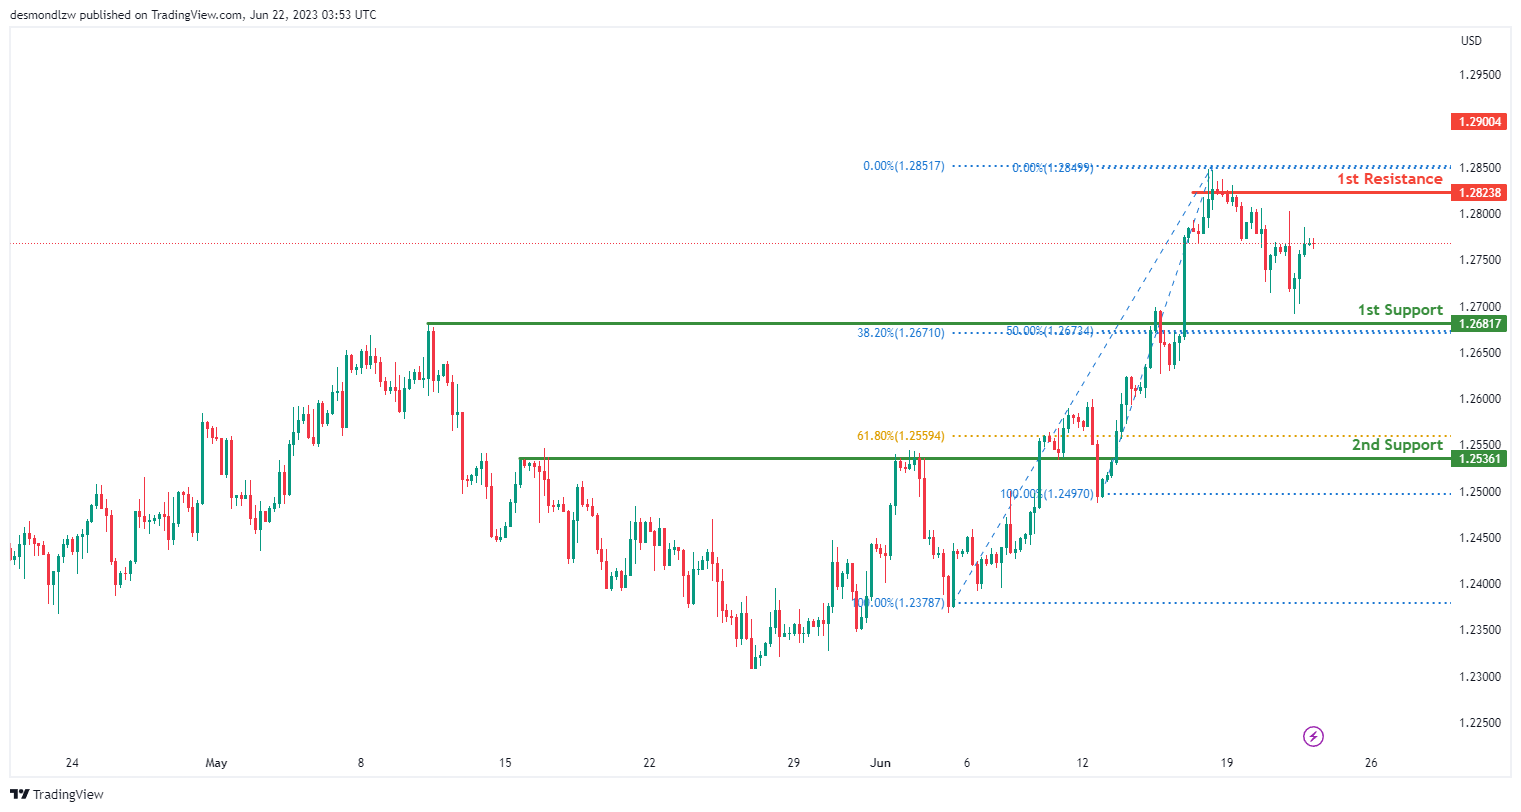
GBP/USD:
The GBP/USD instrument currently exhibits a bullish overall momentum on the chart. There is a potential for a short-term drop towards the first support level before bouncing from there and rising towards the first resistance level.
The first support level at 1.2681 is significant as it is supported by overlap support, a 38.20% Fibonacci retracement, and a 50% Fibonacci retracement, which adds to its reliability. The second support level at 1.2536 provides strong overlap support.
On the upside, the first resistance level at 1.2823 is characterised by a swing high resistance. It is likely that the price will experience rejection near the first resistance rather than breaking through it.
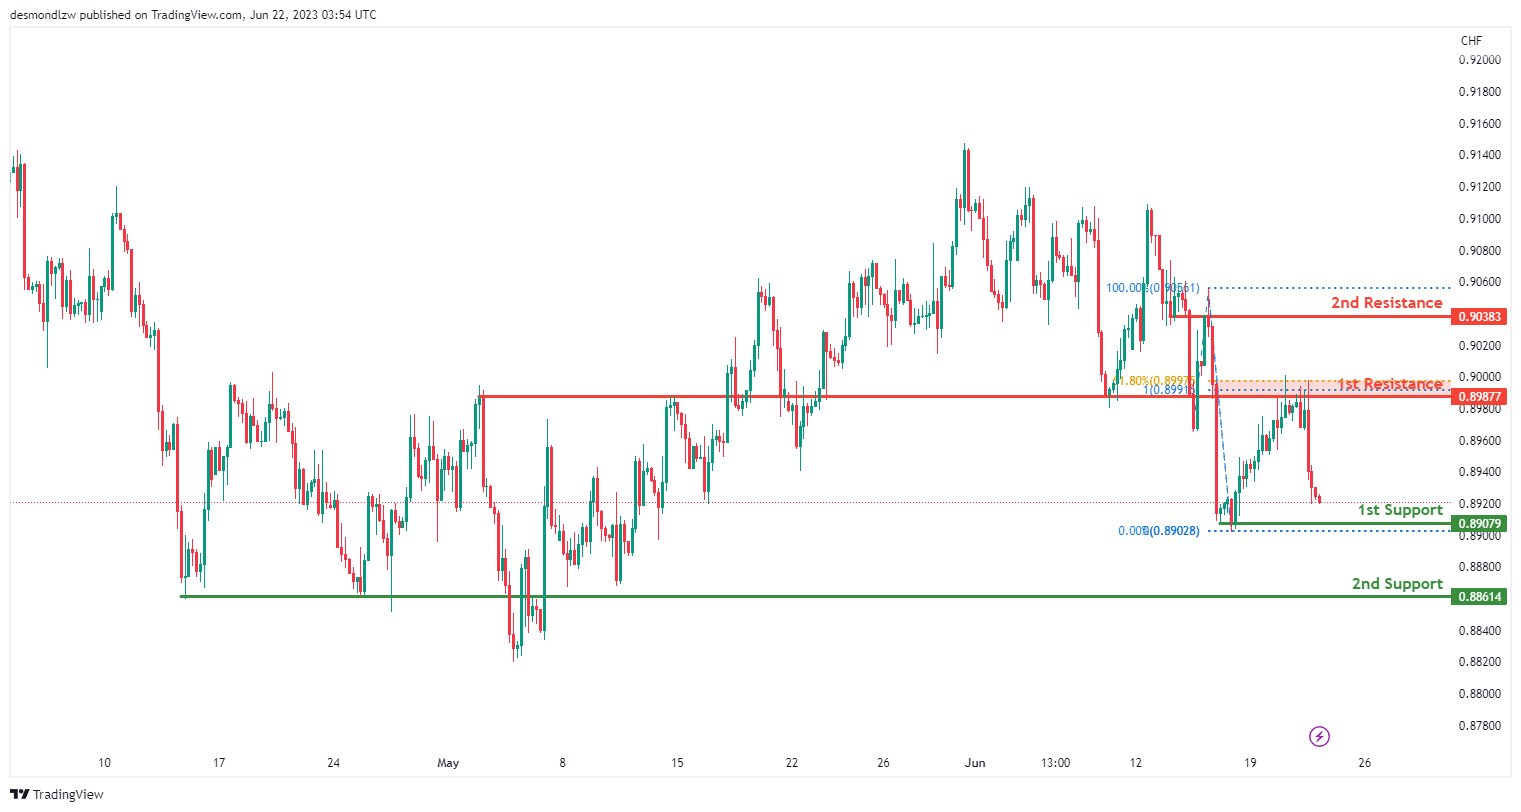
USD/CHF:
The USD/CHF instrument currently displays a bearish overall momentum on the chart. However, there is a possibility for a bullish bounce off the 1st support that could steer the price towards the 1st resistance.
The 1st support level is at 0.8907, offering a strong swing low support, whereas the 2nd support level, positioned at 0.8861, is characterised by an overlap support.
In terms of resistance, the 1st resistance is at 0.8987, defined by an overlap resistance, and the 2nd resistance, situated at 0.9038, is similarly marked by an overlap resistance, indicating their sturdy levels of resistance.
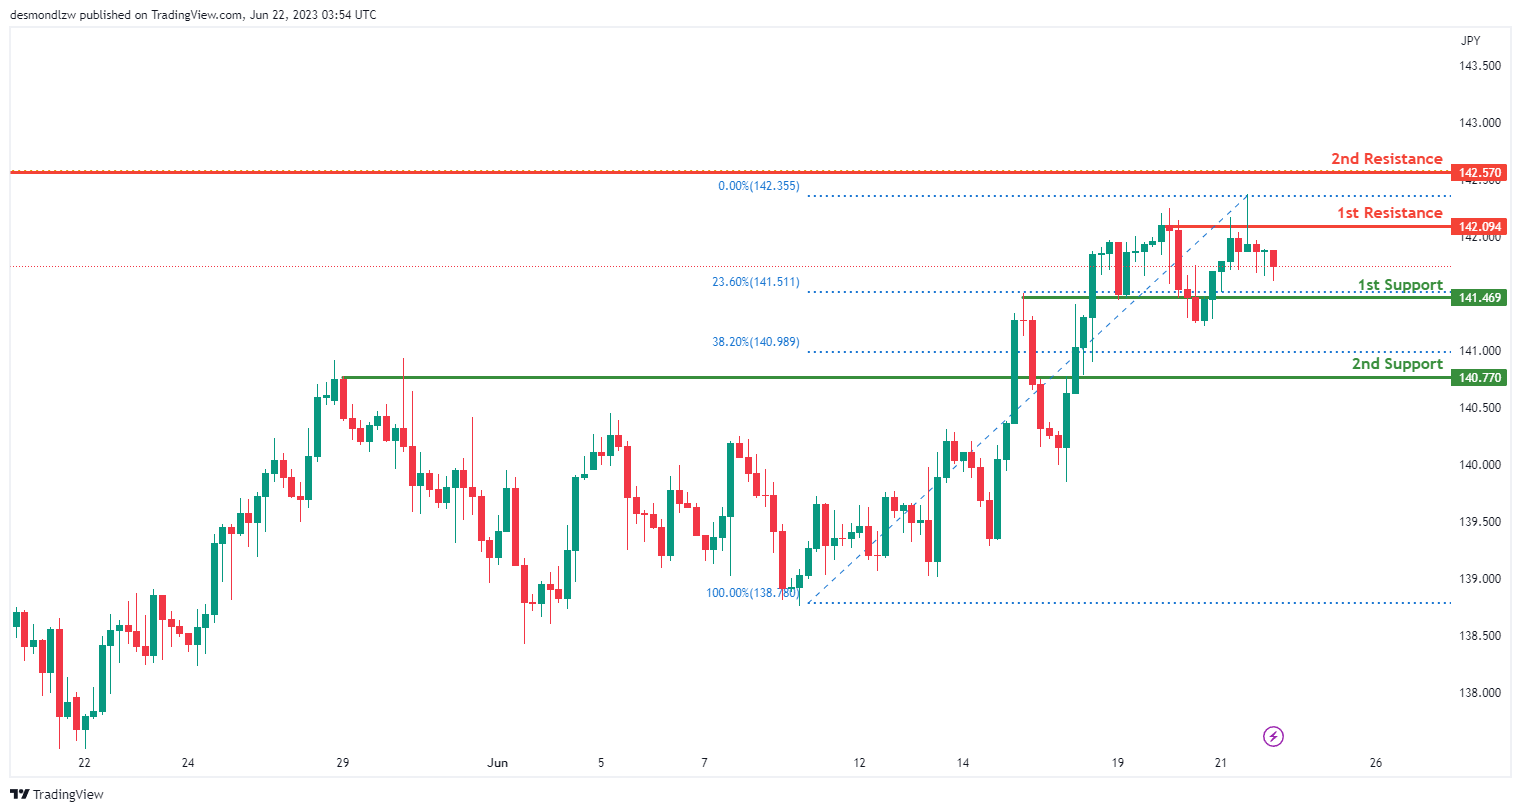
USD/JPY:
The USD/JPY chart demonstrates a bearish momentum, indicating a downward trend in the market.
There is a possibility of a short-term rise towards the first resistance level at 142.57, followed by a reversal and a drop towards the first support level at 141.46.
The first support at 141.46 is considered significant as it represents an overlap support, while the second support at 140.77 acts as a pullback support.
On the upside, the first resistance level at 142.57 is notable, coinciding with the 61.80% Fibonacci Retracement level. Additionally, the intermediate resistance at 142.20 functions as a swing high resistance.
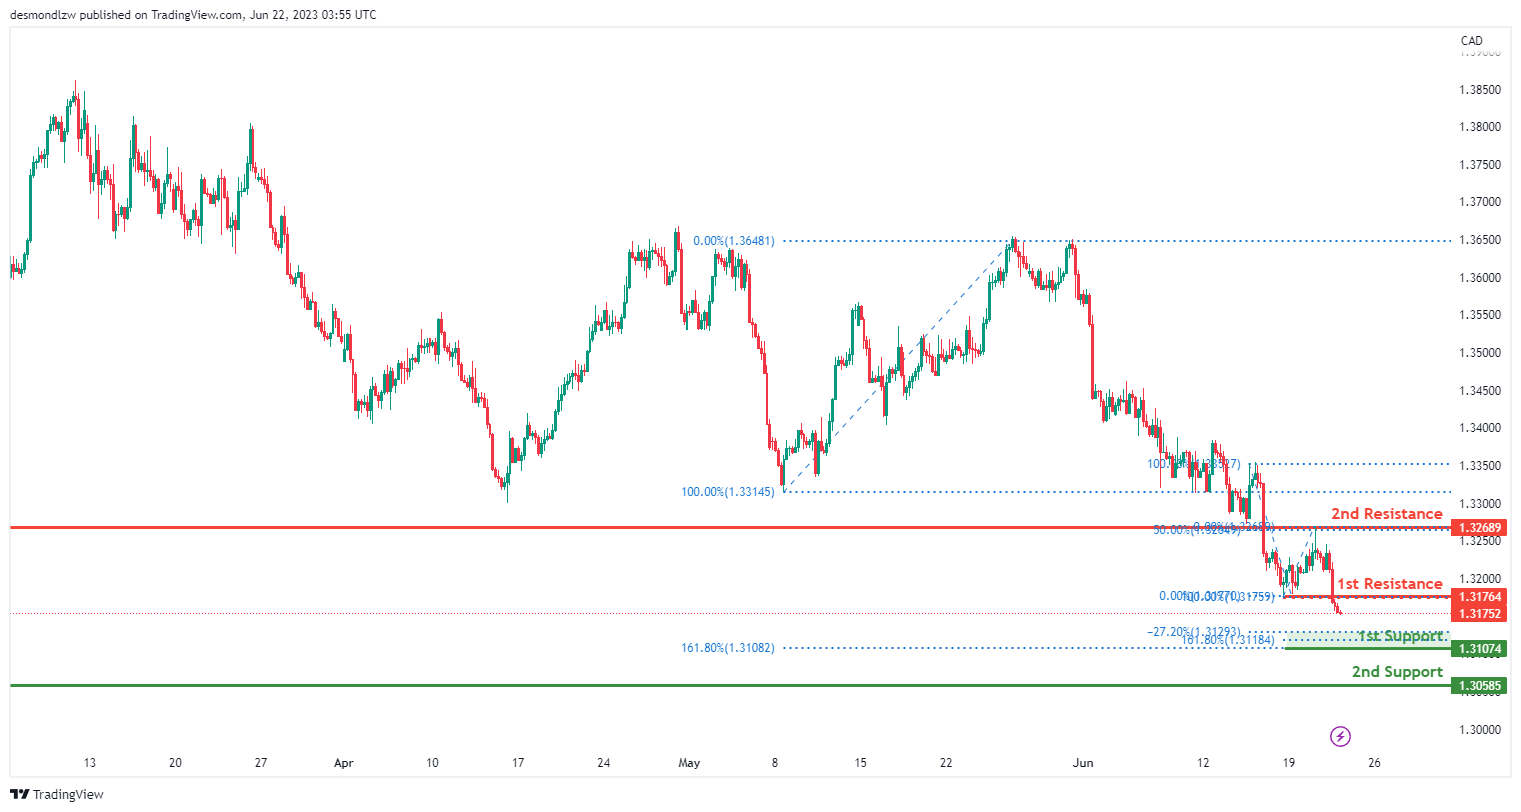
USD/CAD:
The USD/CAD chart exhibits a bearish momentum, indicating a downward trend in the market. There is a potential for a bearish continuation towards the first support level at 1.3107, which is significant as it aligns with the 161.80% Fibonacci Extension and the -27% Fibonacci Expansion. The second support level at 1.3058 serves as a pullback support.
On the upside, the first resistance level at 1.3176 represents a pullback resistance. Additionally, the second resistance level at 1.3268 is identified as an overlap resistance, coinciding with the 50% Fibonacci Retracement.
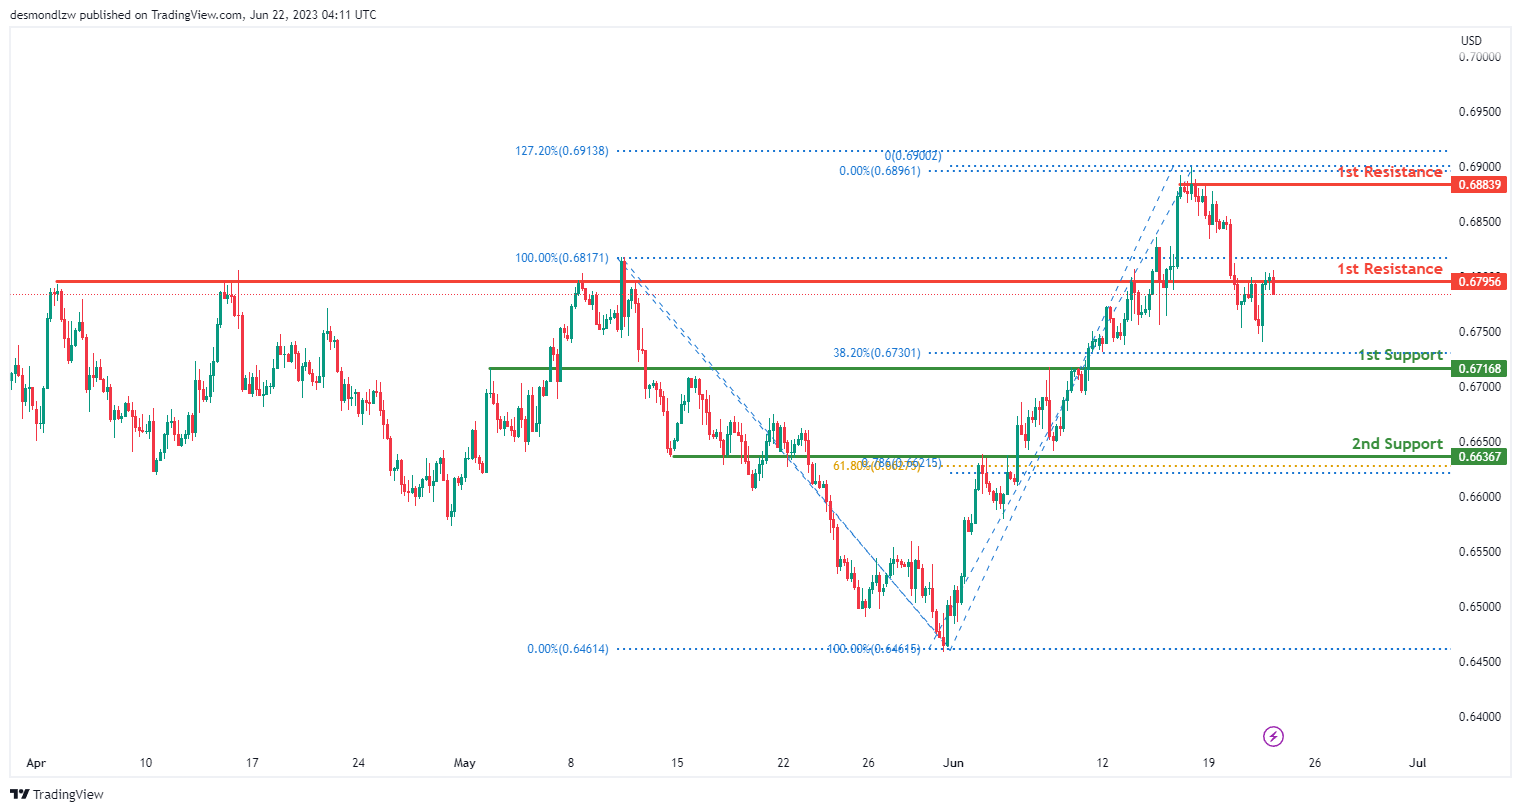
AUD/USD:
The AUD/USD chart indicates a bearish momentum, suggesting a downward trend in the market. There is a possibility of a bearish break off the first support level at 0.8795, which is identified as a pullback support and coincides with the 23.60% Fibonacci Retracement. The price could potentially drop towards the second support level at 0.6721, which serves as another pullback support and aligns with the 38.20% Fibonacci Retracement.
On the upside, the first resistance level at 0.6883 represents a swing high resistance. Additionally, the second resistance level at 0.6916 is identified as a level of interest, coinciding with the 127.20% Fibonacci Extension.
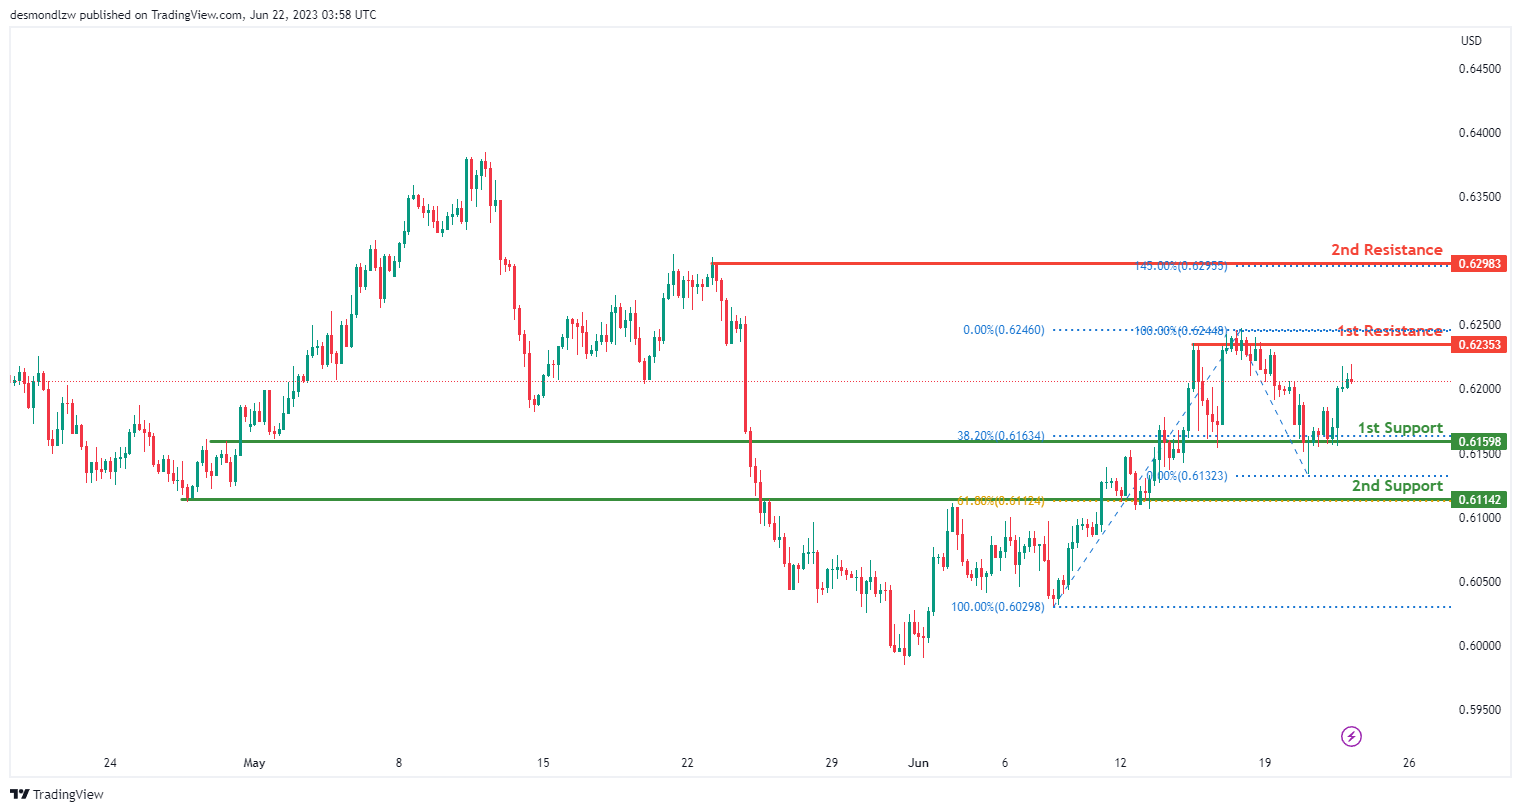
NZD/USD
The NZD/USD chart exhibits a bullish momentum, suggesting an upward trend in the market. There is a possibility of a bullish continuation towards the first resistance level at 0.6235, which is identified as a pullback resistance. Additionally, the second resistance level at 0.6298 acts as a swing high resistance.
On the downside, the first support level at 0.6159 represents an overlap support and aligns with the 38.20% Fibonacci Retracement. Furthermore, the second support level at 0.6114 serves as another overlap support and coincides with the 61.80% Fibonacci Retracement.
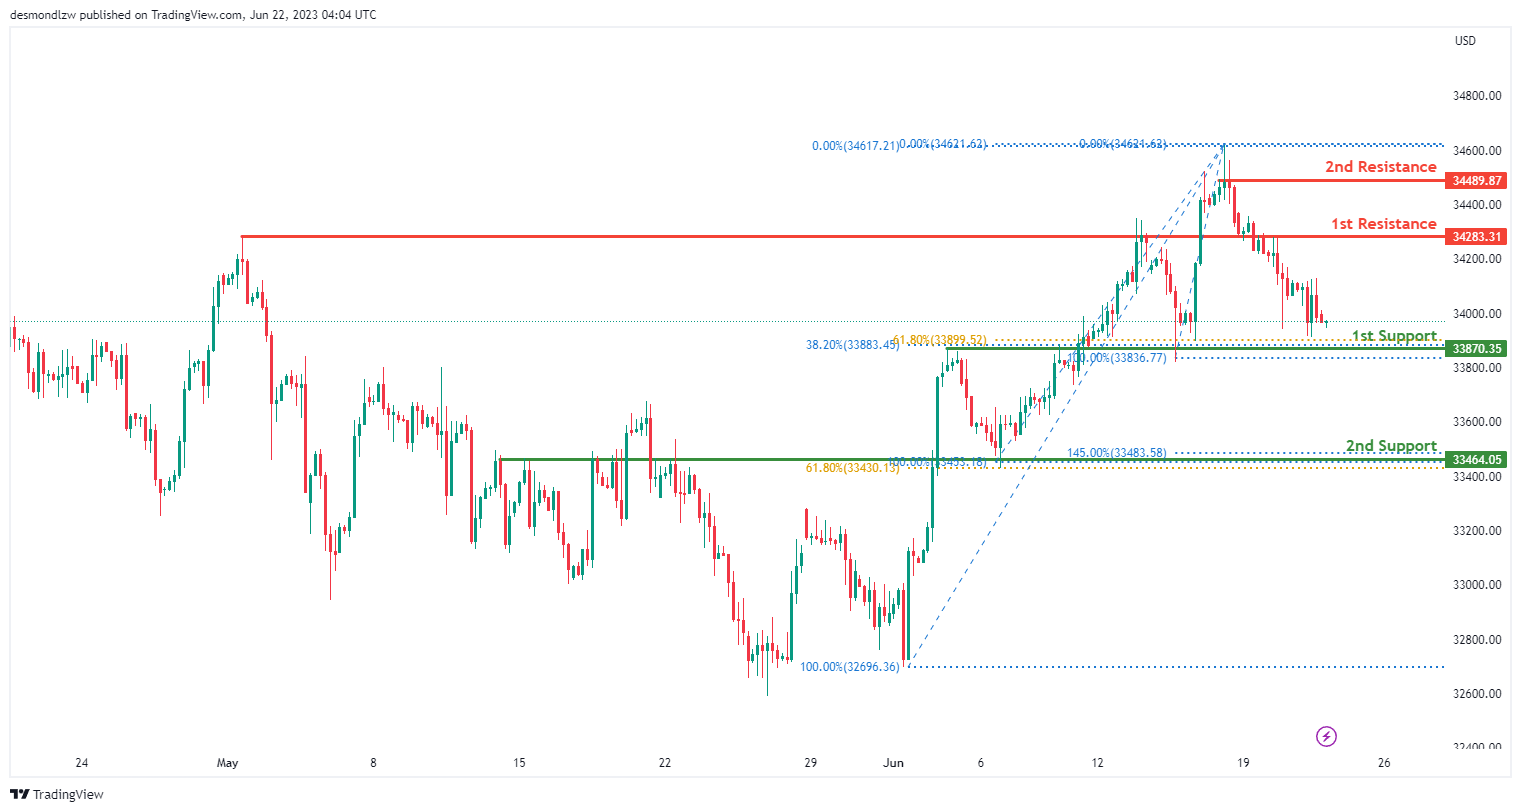
DJ30:
The DJ30 chart demonstrates a bullish momentum, indicating an upward trend in the market. There is a potential for a bullish bounce off the first support level at 33870.35, which is an overlap support and aligns with both the 38.20% and 61.80% Fibonacci Retracement. Additionally, the second support level at 33464.05 serves as another overlap support and coincides with the 61.80% Fibonacci Retracement and 145.00% Fibonacci Extension.
On the upside, the first resistance level at 34283.31 represents an overlap resistance. Furthermore, the second resistance level at 34489.87 is identified as a swing high resistance.
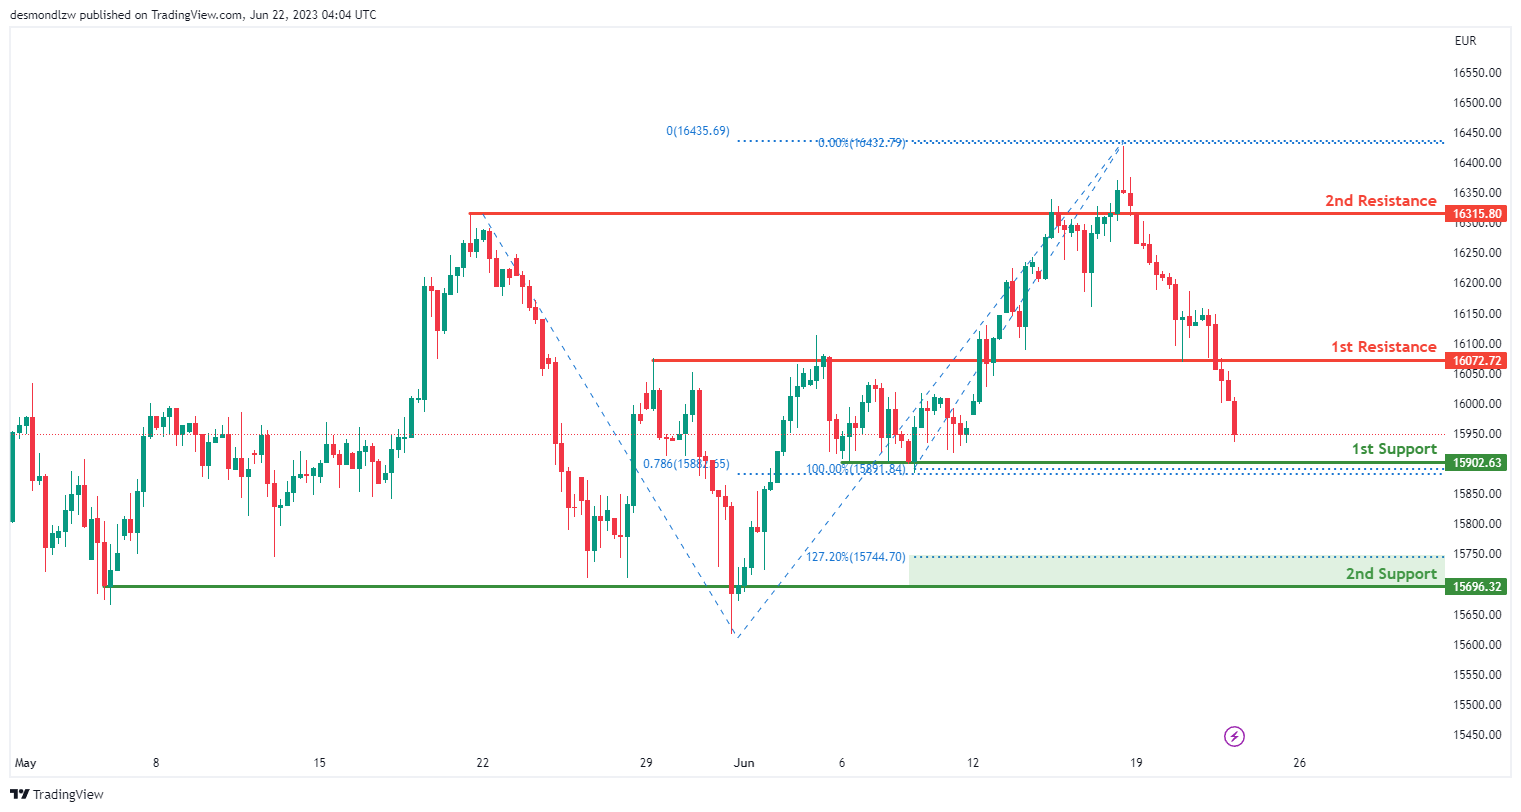
GER30:
The GER30 chart indicates a bearish momentum, suggesting a downward trend in the market. There is a potential for a bearish continuation towards the first support level at 15902.63, which is a multi-swing low support and aligns with the 78.60% Fibonacci Projection. Additionally, the second support level at 15696.32 serves as another multi-swing low support and coincides with the 127.20% Fibonacci Extension.
On the upside, the first resistance level at 16072.72 represents a pullback resistance. Furthermore, the second resistance level at 16315.80 is identified as a pullback resistance.
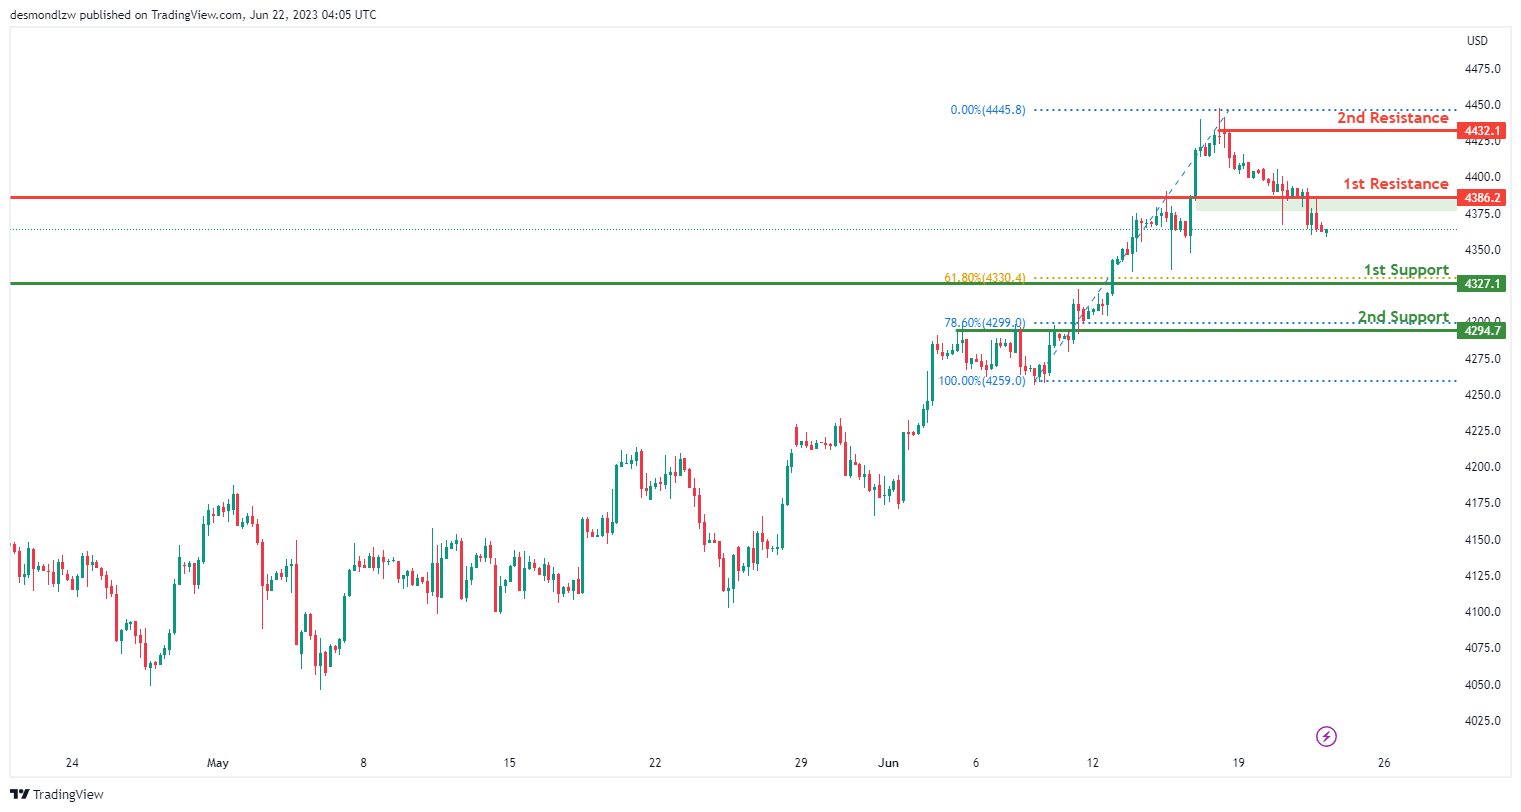
US500
The US500 chart demonstrates a bearish momentum, indicating a downward trend in the market. There is a possibility of a bearish continuation towards the first support level at 4327.1, which serves as a pullback support and aligns with the 61.80% Fibonacci Retracement. Additionally, the second support level at 4294.7 acts as an overlap support and coincides with the 78.60% Fibonacci Retracement.
On the upside, the first resistance level at 4386.2 represents an overlap resistance. Furthermore, the second resistance level at 4432.1 is identified as a swing high resistance.
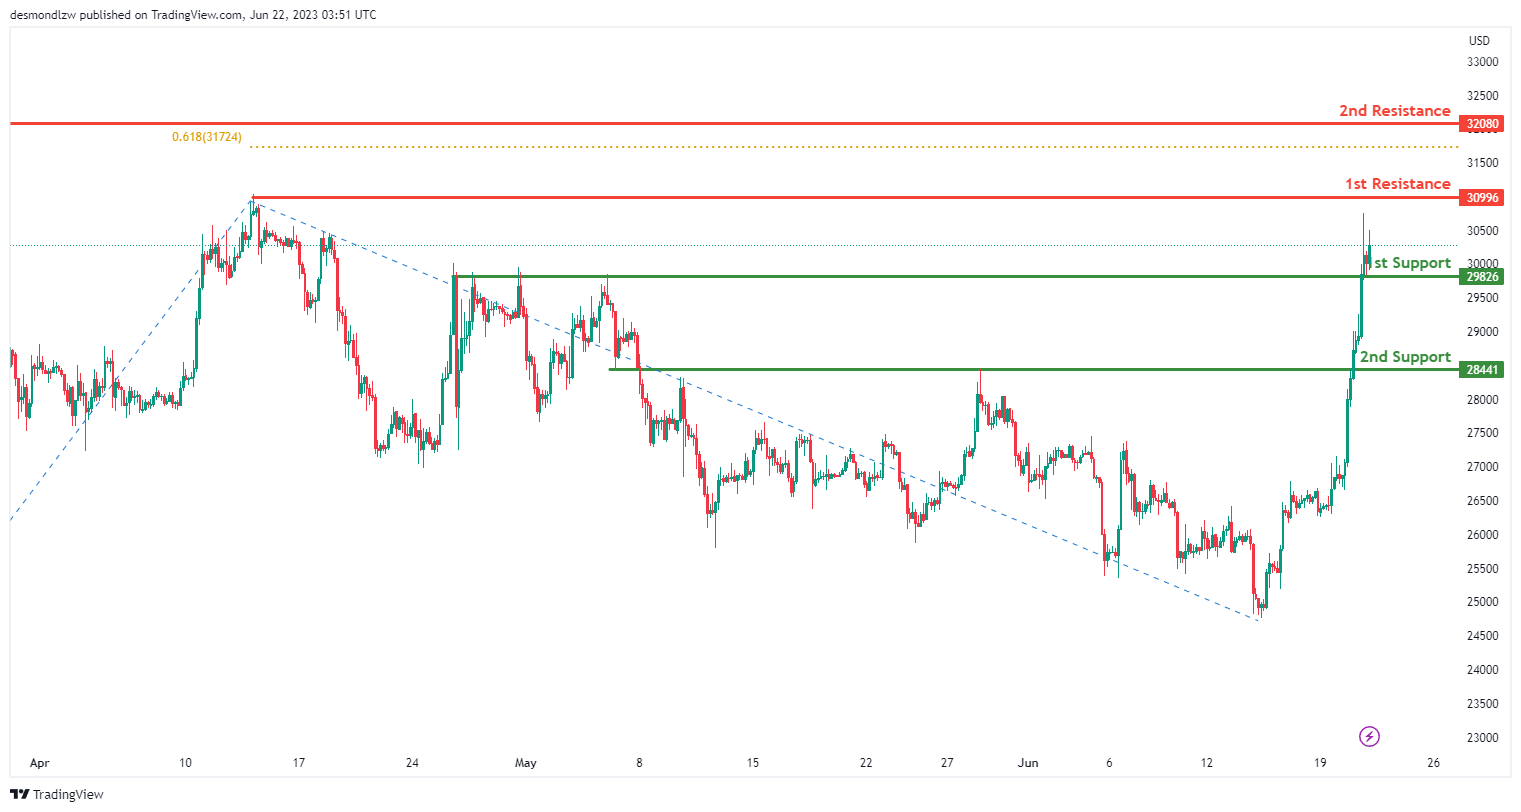
BTC/USD:
The BTC/USD chart indicates a bullish momentum, suggesting an upward trend in the market. There is a potential for a bullish continuation towards the first resistance level at 30996, which represents a swing high resistance.
On the downside, the first support level at 29826 serves as a pullback support, while the second support level at 28441 acts as an additional pullback support. Furthermore, the second resistance level at 32080 is identified as a swing high resistance, coinciding with the 61.80% Fibonacci Projection.
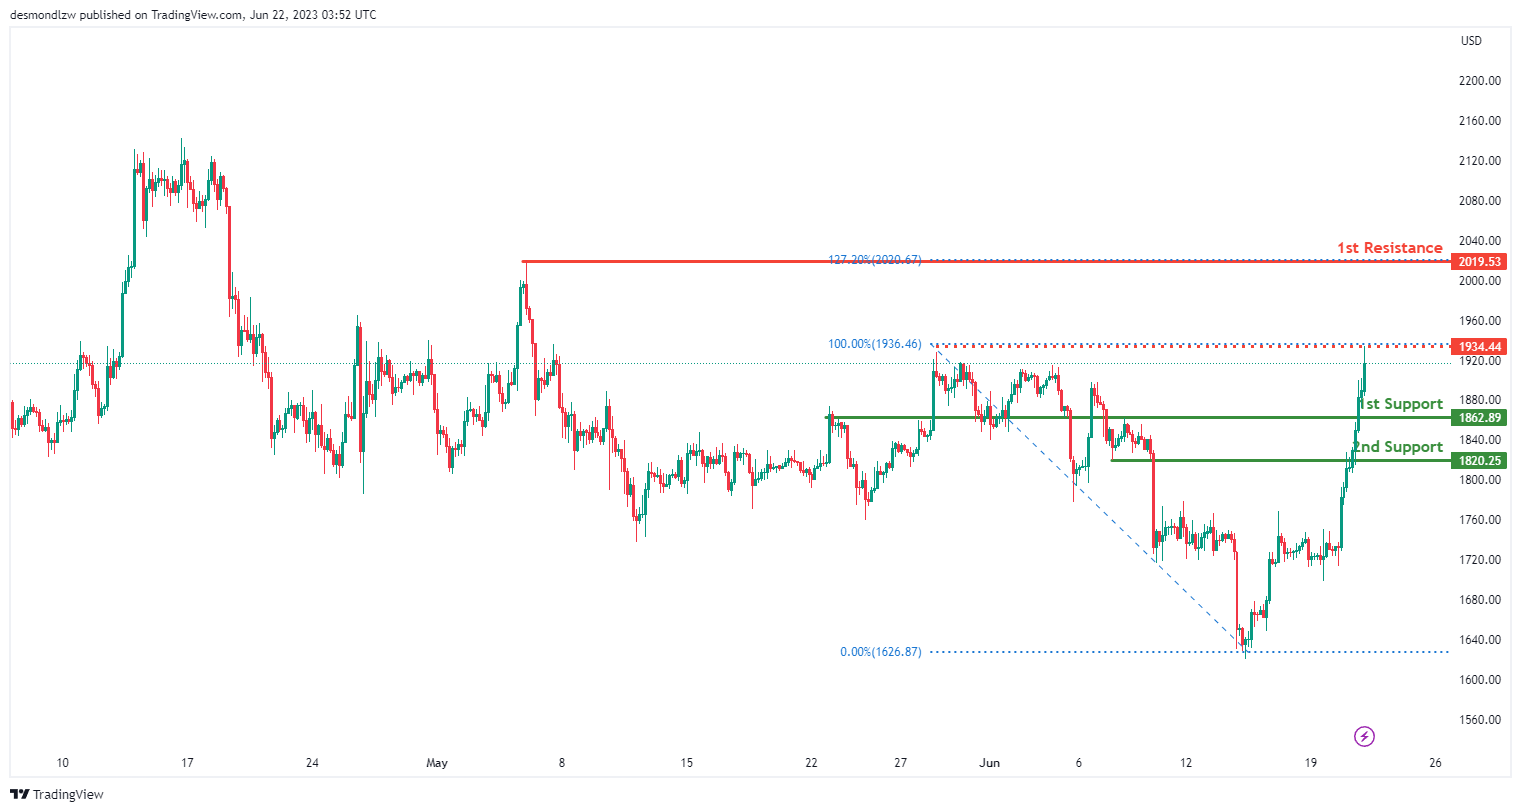
ETH/USD:
The ETH/USD chart demonstrates a bullish momentum, indicating an upward trend in the market. There is a potential for a bullish continuation towards the first resistance level at 2019.53, which represents a swing high resistance.
On the downside, the first support level at 1862.89 serves as a pullback support. Additionally, the second support level at 1820.25 acts as another pullback support. Furthermore, an intermediate resistance level at 1934.44 is identified as a swing high resistance.
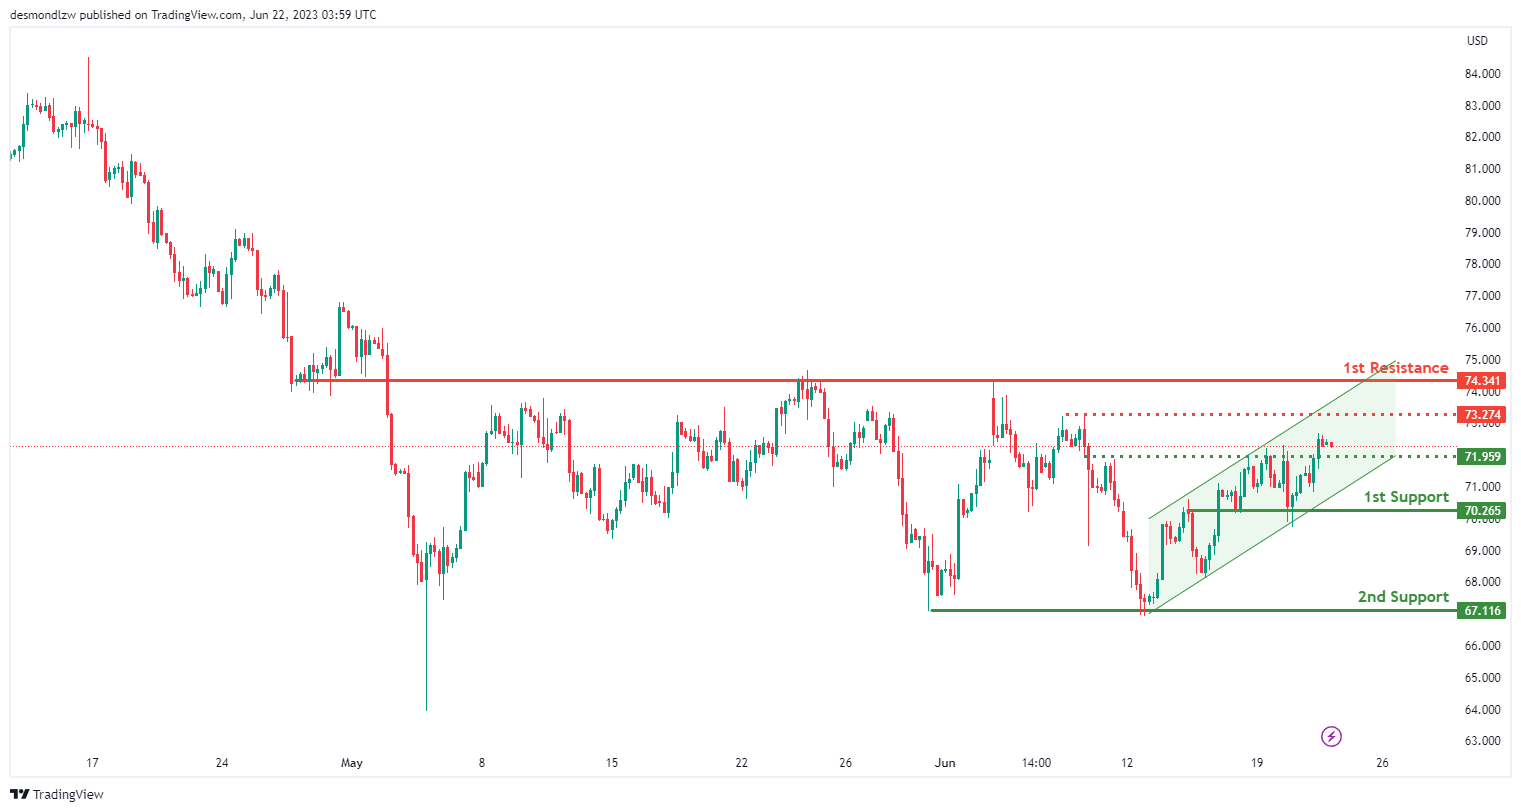
WTI/USD:
The WTI chart exhibits a bullish momentum, characterized by the price movement within an ascending channel. There is a potential for a bullish continuation towards the first resistance level at 74.34, which is identified as an overlap resistance.
On the downside, the first support level at 70.26 represents an overlap support. Additionally, the second support level at 67.11 serves as a multi-swing low support. Furthermore, an intermediate support level at 71.95 is recognized as a pullback support.
Moreover, an intermediate resistance level at 73.27 acts as a swing high resistance.
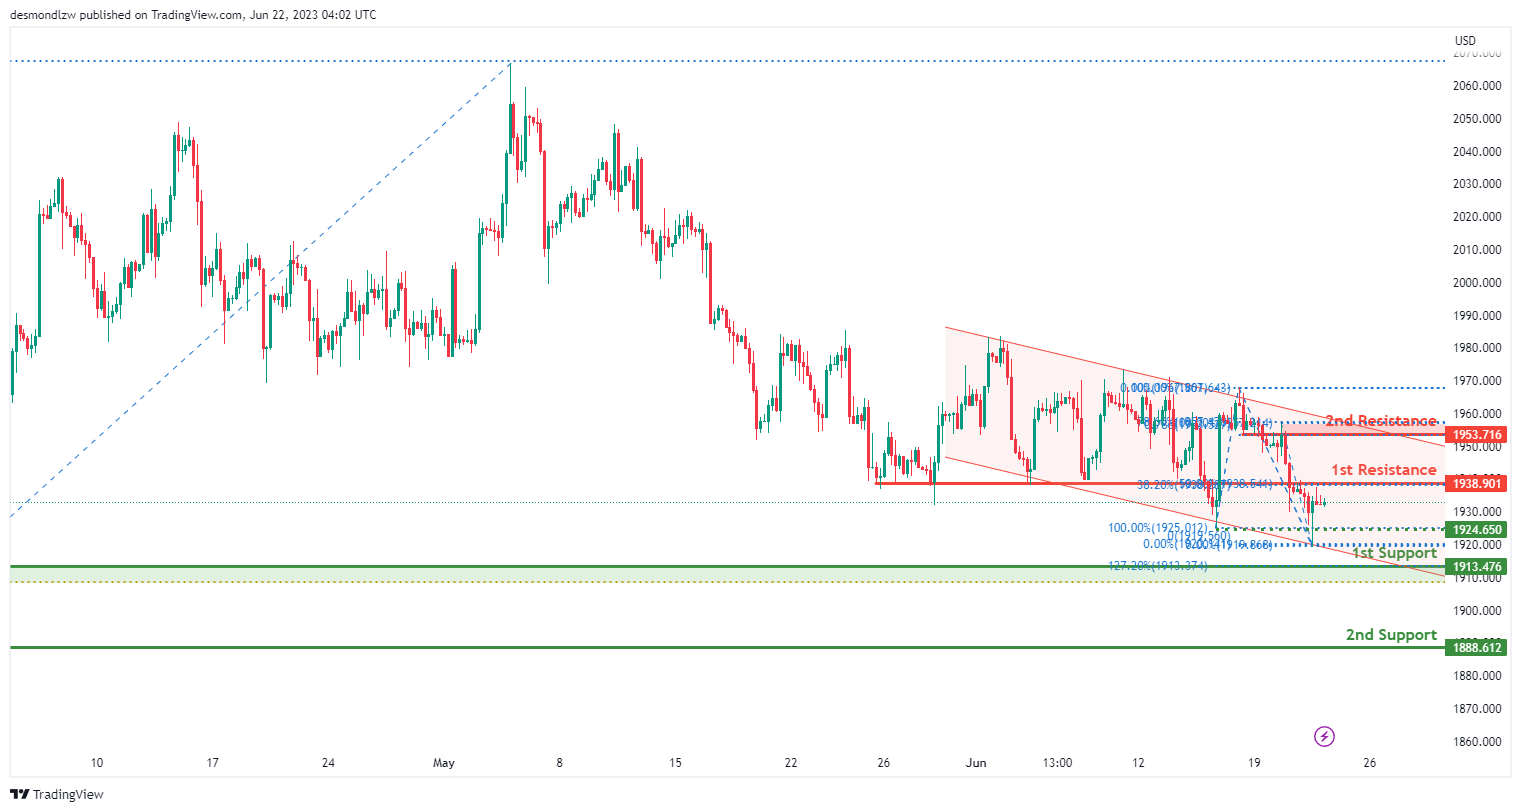
XAU/USD (GOLD):
The XAU/USD chart indicates a bearish momentum, characterized by the price movement within a descending channel. There is a potential for a bearish reaction off the first resistance level at 1938.90, which is an overlap resistance and aligns with both the 38.20% and 50% Fibonacci Retracement levels (Fibonacci confluence). Additionally, the second resistance level at 1953.71 serves as another overlap resistance, coinciding with the 78.60% Fibonacci Retracement and 78.60% Fibonacci Projection.
On the downside, the first support level at 1913.47 is identified as an overlap support, encompassing the 127.20% Fibonacci Extension and 61.80% Fibonacci Retracement (Fibonacci confluence). Furthermore, the second support level at 1888.61 represents another overlap support. Additionally, an intermediate support level at 1924.65 is recognized as a pullback support.


.)