
Gold price is moving lower below the $1,928 support. Crude oil price is also declining and remains at a risk of more losses below $69.00.
Important Takeaways for Gold and Oil Prices Analysis Today
- Gold price failed to clear the $1,965 resistance and start a fresh decline against the US Dollar.
- It is now following a key bearish trend line with resistance near $1,915 on the hourly chart of gold at FXOpen.
- Crude oil prices are also moving lower below $71.20 and $70.20 levels.
- There was a break below a major bullish trend line with support near $70.85 on the hourly chart of XTI/USD at FXOpen.
Gold Price Technical Analysis
On the hourly chart of Gold at FXOpen, the price struggled to start a fresh increase above the $1,965 resistance. The price started a fresh decline below the $1,938 support.
There was a close below the 50-hour simple moving average and $1,928. It tested the $1,910 support zone. A low is formed at $1,910.40 and the price is now consolidating losses. It is following a key bearish trend line with resistance near $1,915.
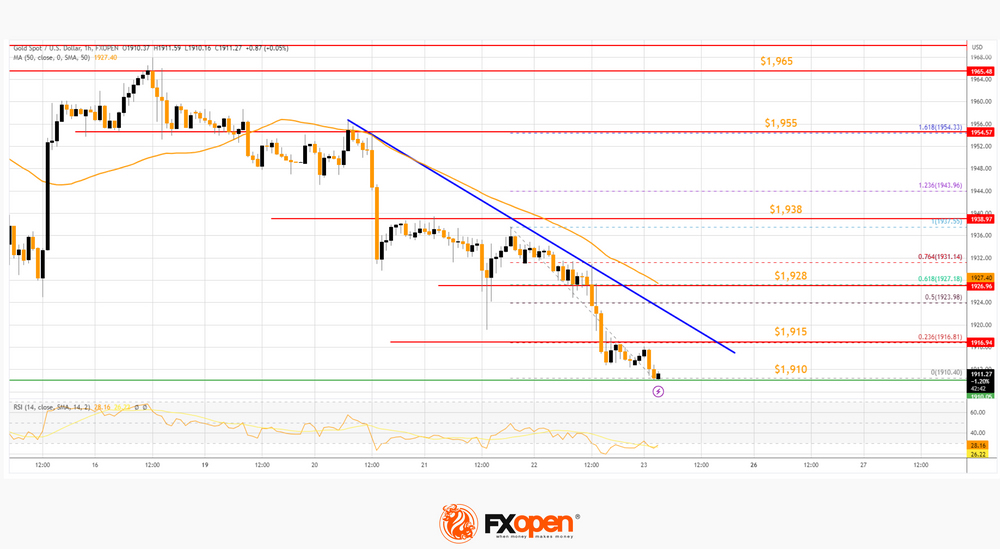
The trend line is close to the 23.6% Fib retracement level of the downward move from the $1,955 swing high to the $1,910 low. The next major resistance is near the 50-hour simple moving average at $1,928.
The 61.8% Fib retracement level of the downward move from the $1,955 swing high to the $1,910 low is also near $1,928. An upside break above the $1,928 resistance could send Gold price toward $1,938. Any more gains may perhaps set the pace for an increase toward the $1,955 level.
Initial support on the downside is near the $1,910 level. The first major support is near the $1,900 level. The main support sits near the $1,885 level. If there is a downside break below the $1,885 support, the price might decline further. In the stated case, the price might drop toward the $1,865 support.
Oil Price Technical Analysis
On the hourly chart of WTI Crude Oil at FXOpen, the price struggled to rise above the $72.60 resistance against the US Dollar. A high was formed near $72.68 and there was a downward move.
There was a break below a major bullish trend line with support near $70.85. The price declined below the 50-hour simple moving average and RSI dropped below 30. It is now consolidating near the 1.236 Fib extension level of the upward move from the $69.74 swing low to the $72.68 high.
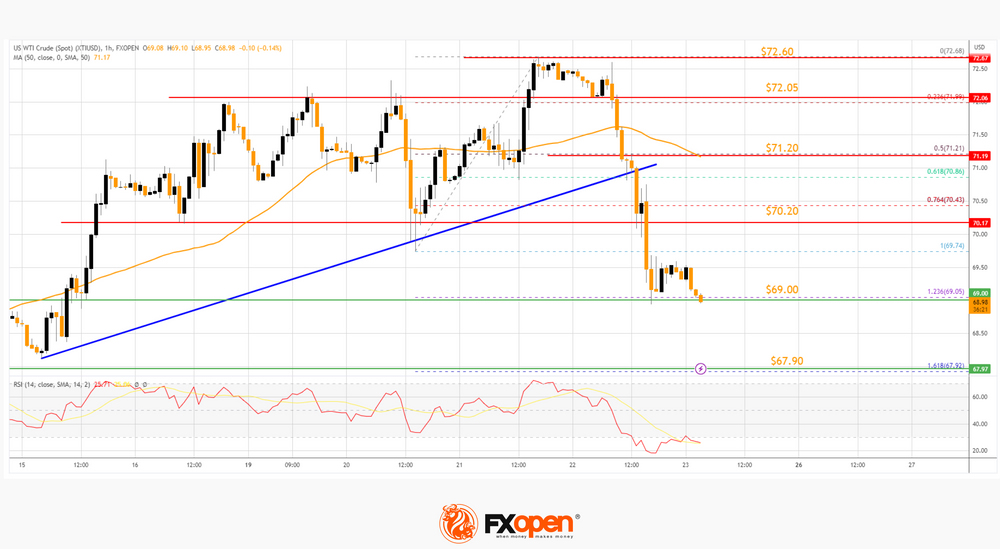
The next major support on the WTI crude oil chart is near $67.90. It coincides with the 1.618 Fib extension level of the upward move from the $69.74 swing low to the $72.68 high.
If there is a downside break, the price might decline toward $67.00. Any more losses may perhaps open the doors for a move toward the $65.50 support zone. If there is a recovery wave, the price might face resistance near $70.20.
The first major resistance is near the 50-hour simple moving average at $71.20. Any more gains might send the price toward the $72.60 level in the coming days.


