
EUR/USD started a fresh increase above the 1.0890 resistance. USD/JPY is consolidating gains and might rally further above 144.20.
Important Takeaways for EUR/USD and USD/JPY Analysis Today
- The Euro is rising and trading well above the 1.0925 resistance zone.
- There is a key bullish trend line forming with support near 1.0940 on the hourly chart of EUR/USD at FXOpen.
- USD/JPY is trading in a positive zone above the 143.40 and 143.70 levels.
- There is a major bullish trend line forming with support near 143.70 on the hourly chart at FXOpen.
EUR/USD Technical Analysis
On the hourly chart of EUR/USD at FXOpen, the pair started a fresh increase from the 1.0845 zone. The Euro climbed above the 1.0890 resistance zone against the US Dollar.
The pair even settled above the 1.0925 resistance and the 50-hour simple moving average. There was an upside break above the 50% Fib retracement level of the last key decline from the 1.1012 swing high to the 1.0844 low.
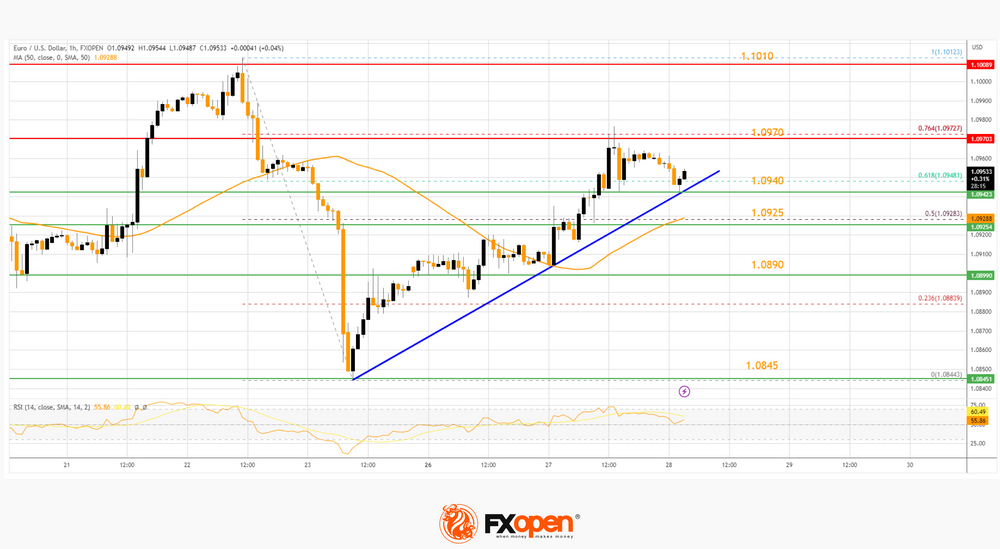
Finally, the bears appeared near the 76.4% Fib retracement level of the last key decline from the 1.1012 swing high to the 1.0844 low at 1.0970.
The pair is now consolidating gains below the 1.0970 resistance. The first major support is near a key bullish trend line at 1.0940.
The next key support is near the 50-hour simple moving average at 1.0925. If there is a downside break below 1.0925, the pair could drop toward the 1.0910 support. The main support on the EUR/USD chart is near 1.0890, below which the pair could start a major decline.
On the upside, the pair is now facing resistance near 1.0970. The next major resistance is near the 1.1010 level. An upside break above 1.1010 could set the pace for another increase. In the stated case, the pair might rise toward 1.1065.
USD/JPY Technical Analysis
On the hourly chart of USD/JPY at FXOpen, the pair started a strong increase from the 141.20 zone. It gained bullish momentum and was able to clear the 142.90 resistance.
The pair even climbed above the 50-hour simple moving average and 143.70. It traded to a new multi-week high at 144.17 and is currently consolidating gains. It is trading near the 23.6% Fib retracement level of the upward move from the 142.93 swing low to the 144.17 high.
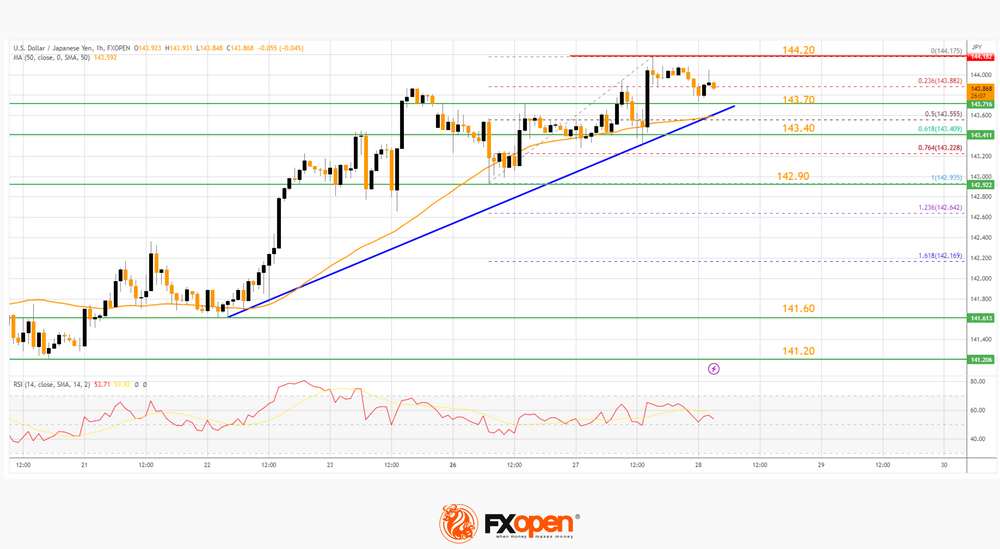
The first major support on the USD/JPY chart is near a major bullish trend line at 143.70. The next major support is near the 61.8% Fib retracement level of the upward move from the 142.93 swing low to the 144.17 high at 143.40.
If there is a close below 143.40, the pair could decline steadily. In the stated case, the pair might drop toward the 142.90 support.
On the upside, the pair is facing resistance near the 144.20 level. The first major resistance is near the 144.50 level. If there is a close above the 144.50 level and RSI moves above 60, the pair could rise toward 145.40. The next major resistance is near 146.20, above which the pair could test 148.00 in the coming days.


