
- Ex-post Apple and Amazon earnings results reinforced the current +1.4% rebound seen on Index from its 3 August 2023 low in today’s 4 August Asian session hours.
- The ongoing rebound is still not showing any clear signs of a reversal from its current short-term downtrend phase in place since 29 July 2023 as price actions remained below the 20-day moving average.
- Medium-term momentum has turned bearish as indicated by the bearish divergence condition seen in the daily RSI at its overbought region which may see a further extension of the current short-term downtrend phase.
- Key short-term resistance to watch will be at 15,600.
The price actions of the US Nas 100 Index (a proxy for the Nasdaq 100 futures) have shaped a decline of -3.6% from its 29 July 2023 high of 15,818 to print a recent intraday low of 15,255 on 3 August reinforced by a significant surge in longer-term US Treasury yields triggered by the aftermath of Fitch’s US sovereign debt credit rating downgrade to AA+ from AAA.
In today, 4 August early Asian session; the two US mega-cap technology firms; Apple and Amazon reported their respective earnings results for the quarter that ended June 2023. Ex-post earnings results release saw the share price of Apple tumble by -2% in the after-hours trading session due third consecutive quarter year-on-year revenue decline hampered by lacklustre demand for iPhones, Mac laptops, and iPads.
In contrast, the share price of Amazon soared by +8.7% in after-hours trading reinforced by its biggest earnings beat since Q4 2020 assisted by significant cost-cutting measures implemented in the prior two quarters.
The overall net effect is a rebound of +1.4% seen on the US Nas 100 Index from its 3 August 2023 low of 15,255 to today’s 4 August Asian session intraday high of 15,441 at this time of the writing.
Medium-term momentum has turned bearish
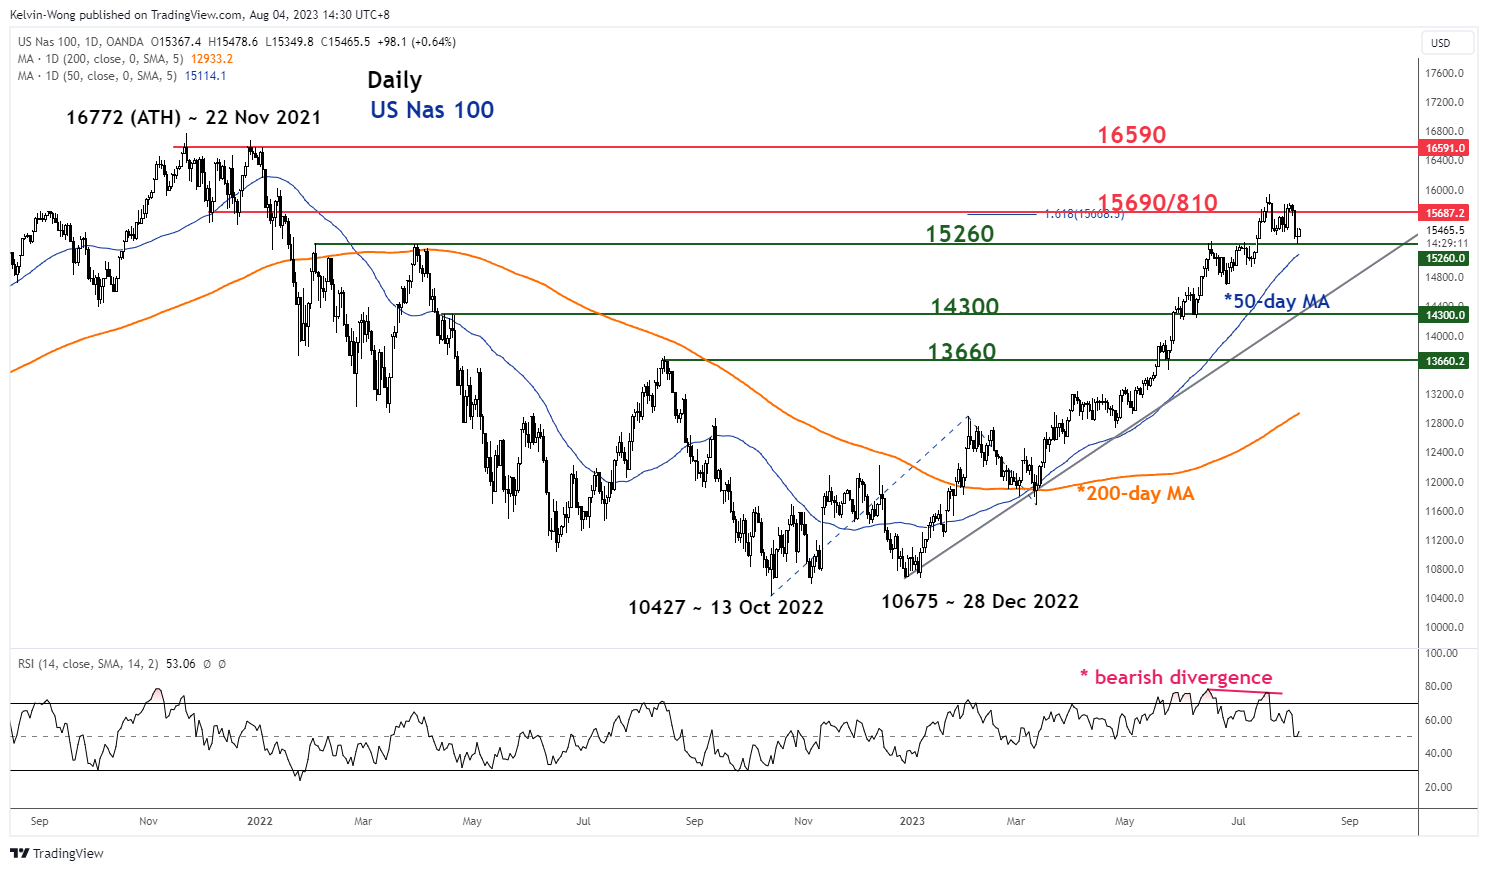
Fig 1: Nasdaq 100 medium-term trend as of 4 Aug 2023 (Source: TradingView, click to enlarge chart)
The daily RSI oscillator has flashed a bearish divergence condition (lower highs in RSI in contrast with higher highs in the corresponding price actions of the Index) at its overbought region which suggests that the medium-term uptrend phase of the Index in place since 28 December 2023 low of 10,675 may have reached a terminal point at the 15,690/15,810 key medium-term resistance.
The odds now have increased for a potential multi-week corrective decline to retrace a portion of the medium-term uptrend in the first step if 15,260 near-term support fails to hold (also the 50-day moving average).
Still below the 20-day moving average
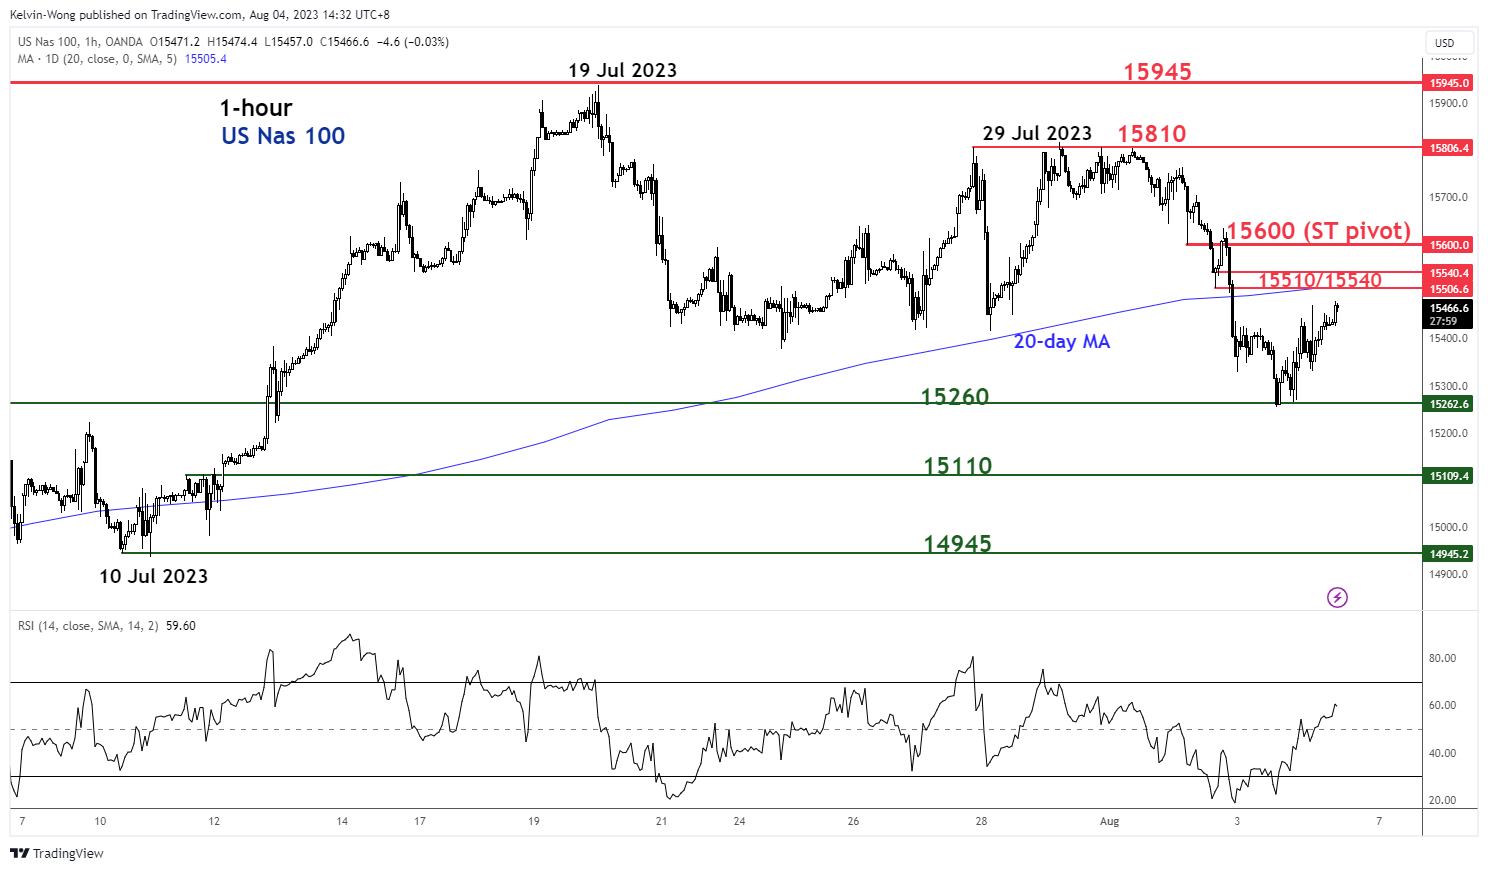
Fig 2: Nasdaq 100 minor short-term trend as of 4 Aug 2023 (Source: TradingView, click to enlarge chart)
The ongoing rebound from its 3 August 2023 low of 15,255 has not surpassed its 20-day moving average which is acting as an intermediate resistance at 15,510/15,540.
Watch the 15,600 key short-term pivotal resistance (also the 61.8% Fibonacci retracement of the decline from the 29 July 2023 high to the 3 August 2023 low) to maintain the short-term downtrend to retest 15,260 and a break below it exposes the next support at 15,110 in the first step.
On the flip side, a clearance above 15,600 invalidates the short-term bearish tone for a retest on the 15,810 key medium-term resistance.


 have shaped a decline of -3.6% from its 29 July 2023 high of 15,818 to print a recent intraday low of 15,255 on 3 August reinforced by a significant surge in longer-term US Treasury yields triggered by the aftermath of Fitch’s US sovereign debt credit rating downgrade to AA+ from AAA.)